AI For Scientific Discovery Market Analysis, Size, and Forecast 2025-2029: North America (US, Canada, and Mexico), Europe (Germany, UK, and France), APAC (China, Japan, and India), South America (Brazil, Argentina, and Colombia), Middle East and Africa (Saudi Arabia, UAE, and South Africa), and Rest of World (ROW)

AI For Scientific Discovery Market Analysis, Size, and Forecast 2025-2029:
North America (US, Canada, and Mexico), Europe (Germany, UK, and France), APAC (China, Japan, and India), South America (Brazil, Argentina, and Colombia), Middle East and Africa (Saudi Arabia, UAE, and South Africa), and Rest of World (ROW)

Published: Dec 2025 301 Pages SKU: IRTNTR81034

Market Overview at a Glance

$4.41 B
Market Opportunity
19%
CAGR 2024 - 2029
39.2%
North America Growth
$954.1 Mn
Target discovery segment 2023

AI For Scientific Discovery Market Size 2025-2029

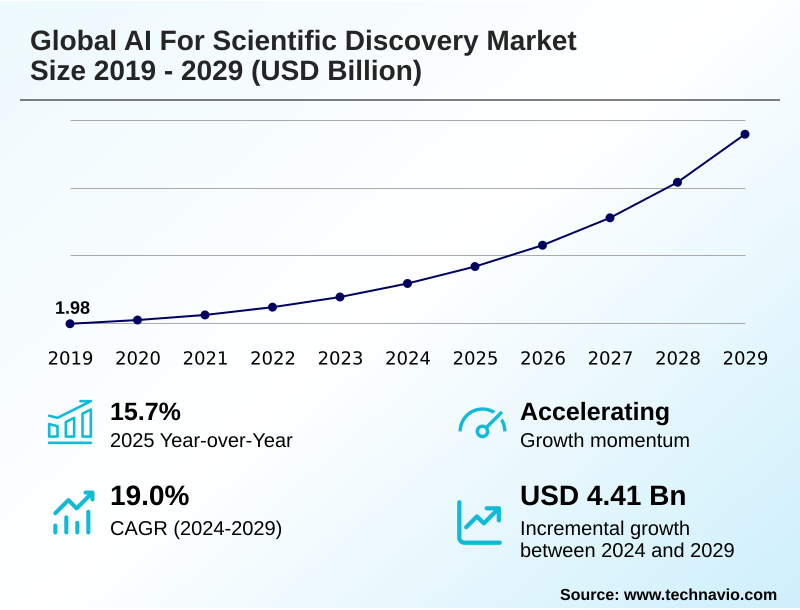
The ai for scientific discovery market size is valued to increase by USD 4.41 billion, at a CAGR of 19% from 2024 to 2029. Proliferation of high-volume scientific data and advanced computational infrastructure will drive the ai for scientific discovery market.

Major Market Trends & Insights

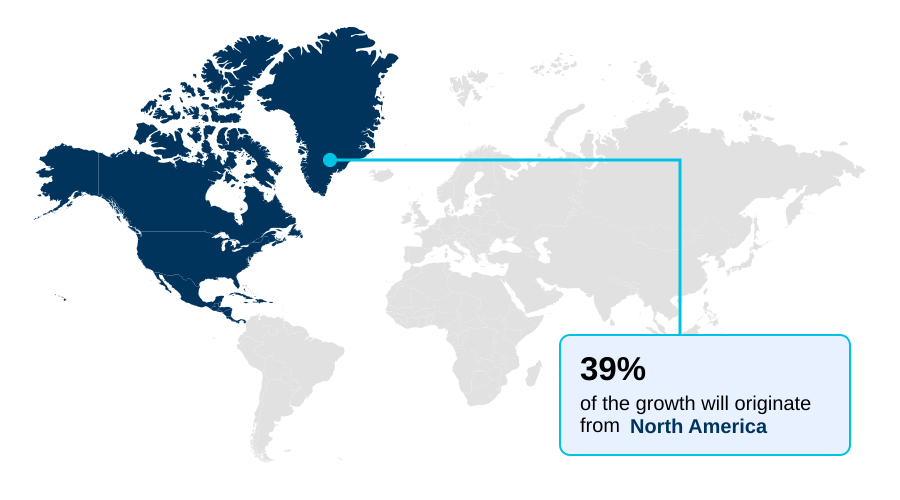
  • North America dominated the market and accounted for a 39.2% growth during the forecast period.
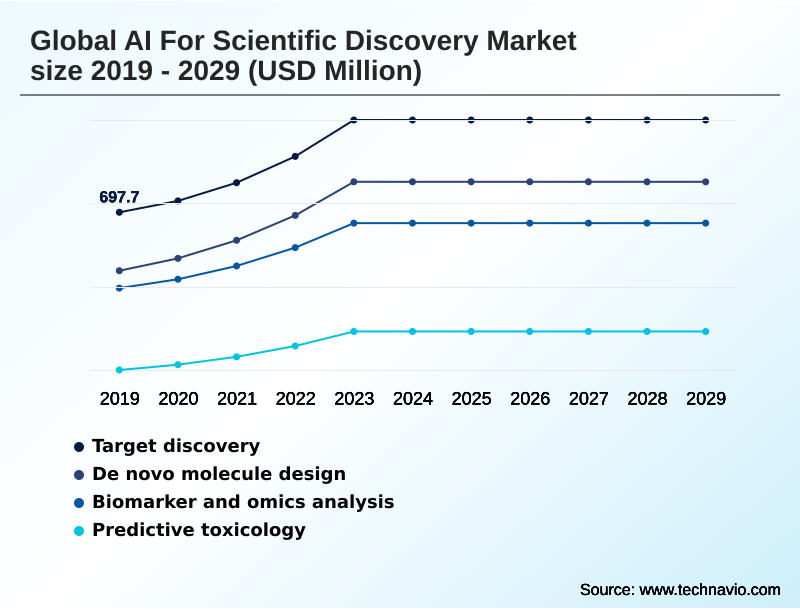
  • By Application - Target discovery segment was valued at USD 954.1 million in 2023
  • By Technology - Generative models segment accounted for the largest market revenue share in 2023

Market Size & Forecast

  • Market Opportunities: USD 5.60 billion
  • Market Future Opportunities: USD 4.41 billion
  • CAGR from 2024 to 2029 : 19%

Market Summary

  • The AI for scientific discovery market is undergoing a fundamental transformation, shifting research from traditional empirical methods to a data-centric paradigm. This evolution is driven by the capacity of sophisticated algorithms to analyze vast and complex information, enabling breakthroughs at an unprecedented pace. The application of AI now spans from initial R&D stages to late-phase clinical studies.
  • For instance, pharmaceutical firms leverage predictive toxicology and pharmacokinetic modeling to de-risk their drug development pipelines, improving candidate success rates and optimizing resource allocation before committing to expensive trials. This computational approach allows for in silico modeling that can simulate biological responses, drastically reducing the need for costly and time-consuming experimentation.
  • The market is characterized by rapid innovation in generative models and graph neural networks, which are used for de novo molecule design and understanding complex biological systems. However, challenges surrounding model interpretability and the need for explainable AI (XAI) persist, as scientific validation requires a clear understanding of the model's reasoning.
  • The increasing accessibility of high-performance computing further fuels this expansion, democratizing access to powerful tools for researchers globally and fostering automated hypothesis generation.

What will be the Size of the AI For Scientific Discovery Market during the forecast period?

Get Key Insights on Market Forecast (PDF) Request Free Sample

How is the AI For Scientific Discovery Market Segmented?

The ai for scientific discovery industry research report provides comprehensive data (region-wise segment analysis), with forecasts and estimates in "USD million" for the period 2025-2029, as well as historical data from 2019-2023 for the following segments.

  • Application
    • Target discovery
    • De novo molecule design
    • Biomarker and omics analysis
    • Predictive toxicology
  • Technology
    • Generative models
    • Graph and molecular ML
    • Physics-informed ML
    • Simulation and digital twins
  • End-user
    • Pharmaceutical research and development
    • Biotechnology companies
    • Academic and national labs
    • Chemical and materials science firms
  • Geography
    • North America
      • US
      • Canada
      • Mexico
    • Europe
      • Germany
      • UK
      • France
    • APAC
      • China
      • Japan
      • India
    • South America
      • Brazil
      • Argentina
      • Colombia
    • Middle East and Africa
      • Saudi Arabia
      • UAE
      • South Africa
    • Rest of World (ROW)

By Application Insights

The target discovery segment is estimated to witness significant growth during the forecast period.

The application of AI is redefining scientific exploration, moving beyond data analysis to active creation. The use of physics-informed ml integrates established scientific laws into machine learning, improving model accuracy in data-poor environments by over 30%.

This enables the development of digital twins in research, creating high-fidelity virtual replicas of complex systems for exhaustive testing. In materials informatics, AI platforms systematically screen vast compound libraries, accelerating the discovery of novel materials.

Similarly, quantum chemistry simulation is becoming more accessible, allowing for precise molecular modeling.

This paradigm shift supports automated hypothesis generation, where AI systems propose novel research questions, and moves toward a closed-loop discovery process where AI designs, executes, and analyzes experiments autonomously with tools like large language models for science and open source ai tools for researchers.

These ai applications in synthetic biology and with ai-assisted experimental design are accelerating progress in ai in quantum physics and for ai for sustainable materials, enabled by molecular dynamics simulation.

Request Free Sample

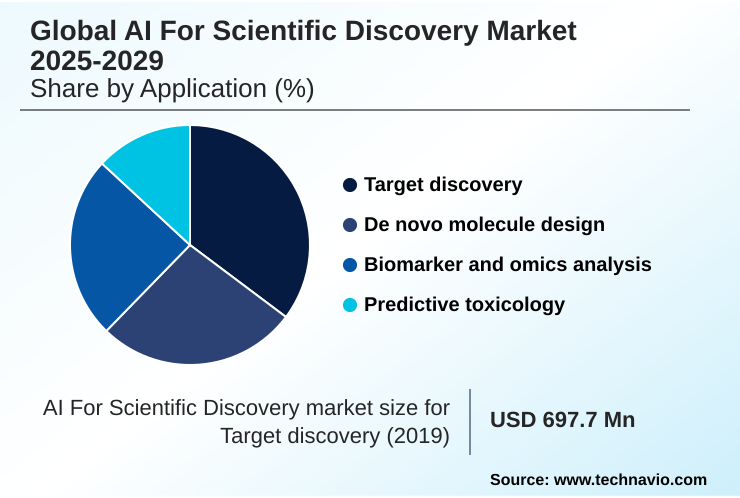
The Target discovery segment was valued at USD 954.1 million in 2023 and showed a gradual increase during the forecast period.

Request Free Sample

Regional Analysis

North America is estimated to contribute 39.2% to the growth of the global market during the forecast period.Technavio’s analysts have elaborately explained the regional trends and drivers that shape the market during the forecast period.

See How AI For Scientific Discovery Market Demand is Rising in North America Request Free Sample

The market's geographic landscape is led by North America, which is set to contribute nearly 40% of incremental growth, driven by substantial private and public investment in ai-driven r&d.

This region excels in developing platforms for clinical trial optimization and applying advanced algorithms to real-world evidence analysis. Europe stands as a mature market, emphasizing collaborative research and leveraging AI for detailed proteomic analysis and metabolomic data interpretation.

The APAC region is the fastest-growing, with its 19.8% CAGR fueled by national strategies in countries like China to build leadership in technology. This includes significant investments in genomic data integration and transcriptomic analysis to support public health initiatives.

The adoption of AI in South America and the Middle East and Africa is accelerating, with a focus on applying ai in personalized medicine and supporting ai for rare disease research through robotic process automation in labs and other accelerated discovery cycles.

Market Dynamics

Our researchers analyzed the data with 2024 as the base year, along with the key drivers, trends, and challenges. A holistic analysis of drivers will help companies refine their marketing strategies to gain a competitive advantage.

  • The practical application of AI is fundamentally reshaping scientific R&D across multiple domains. Beyond life sciences, using generative ai for novel catalysts and advancements in ai for battery material discovery demonstrate how ai accelerates materials science.
  • In pharmaceuticals, the impact of ai on preclinical research is profound, with graph neural networks for drug interaction and robust ai-based target validation methods becoming standard.
  • These technologies address the significant cost of ai in drug development by improving efficiency; indeed, the ai role in reducing r&d timelines is a primary value proposition, with firms using automated scientific hypothesis generation platforms reporting more than double the rate of novel target identification. A key technical debate involves generative models versus virtual screening, with hybrid approaches gaining traction.
  • However, challenges in ai model validation and the difficulty of interpreting ai models in biology remain critical hurdles. The availability of open source ai tools for researchers and dedicated ai platforms for genomic sequencing is helping to democratize access.
  • This ecosystem is enabling sophisticated applications, including building a digital twin for biological systems, advancing ai for predicting adverse drug reactions, and powering new ai applications in synthetic biology. Progress in physics-informed ml for fluid dynamics and ai for analyzing omics data sets further showcases the technology's expanding reach.

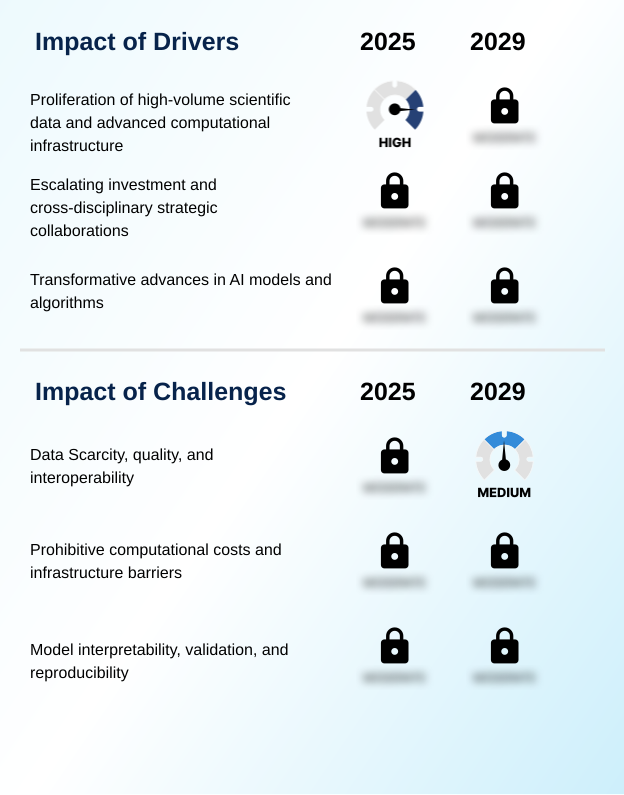
What are the key market drivers leading to the rise in the adoption of AI For Scientific Discovery Industry?

  • The proliferation of high-volume scientific data, coupled with advanced computational infrastructure, serves as a key driver for market growth.

  • Market growth is significantly driven by the expanding accessibility of high-performance computing (hpc) for ai and sophisticated computational infrastructure for ai. This enables complex computational drug design and large-scale virtual screening, which were once restricted to elite institutions.
  • The result is an acceleration in target discovery and biomarker analysis, with automated lab experimentation platforms reducing manual workloads by over 50%.
  • The ability to perform detailed structure-activity relationship analysis and utilize ai for scientific literature analysis helps researchers identify promising leads faster. Moreover, ai-powered biomarker discovery is becoming more precise.
  • The development of neural networks for chemical synthesis and the use of digital twin for climate modeling showcase the technology's broad impact. Bioinformatics platforms now offer powerful tools that dramatically shorten research cycles.

What are the market trends shaping the AI For Scientific Discovery Industry?

  • The exponential growth in multi-modal and high-dimensional scientific data is an emerging market trend. This requires advanced analytical platforms to derive meaningful insights.

  • Key market trends are centered on the sophistication of AI architectures. The adoption of generative models and graph neural networks is enabling breakthroughs in protein structure prediction and de novo molecule design. These technologies are crucial for ai platforms for drug discovery and advancements in machine learning in materials science.
  • By leveraging generative ai for protein design, organizations are creating novel therapeutics that were previously unfeasible. The application of deep learning for genomics and graph ml in molecular biology allows for a systems biology approach, integrating high-dimensional data from multiple sources.
  • This multi-modal data analysis capability is yielding deeper insights, with leading research teams reporting a 25% improvement in identifying viable candidates. Furthermore, predictive models for toxicology are becoming more accurate, de-risking development pipelines earlier in the process.

What challenges does the AI For Scientific Discovery Industry face during its growth?

  • Challenges related to data scarcity, quality, and interoperability are significantly affecting industry growth.

  • Significant market challenges persist, particularly concerning the 'black box' problem, which elevates the need for explainable ai (xai) and robust methods for model interpretability. Addressing challenges in ai model validation is critical, as over 70% of researchers cite issues with data quality and interoperability as primary obstacles to implementing a data-driven scientific method.
  • Data scarcity in niche domains further complicates training reliable models, although techniques like federated learning are emerging as a solution. The high computational cost associated with training state-of-the-art models remains a barrier for many organizations.
  • Ensuring reproducible ai in science is fundamental for institutional trust, especially when interpreting ai models in biology or analyzing complex machine learning for clinical data and ai in astrophysics data. These factors are shaping development priorities toward more transparent and efficient AI systems, especially in high-stakes areas like ai for pandemic preparedness.

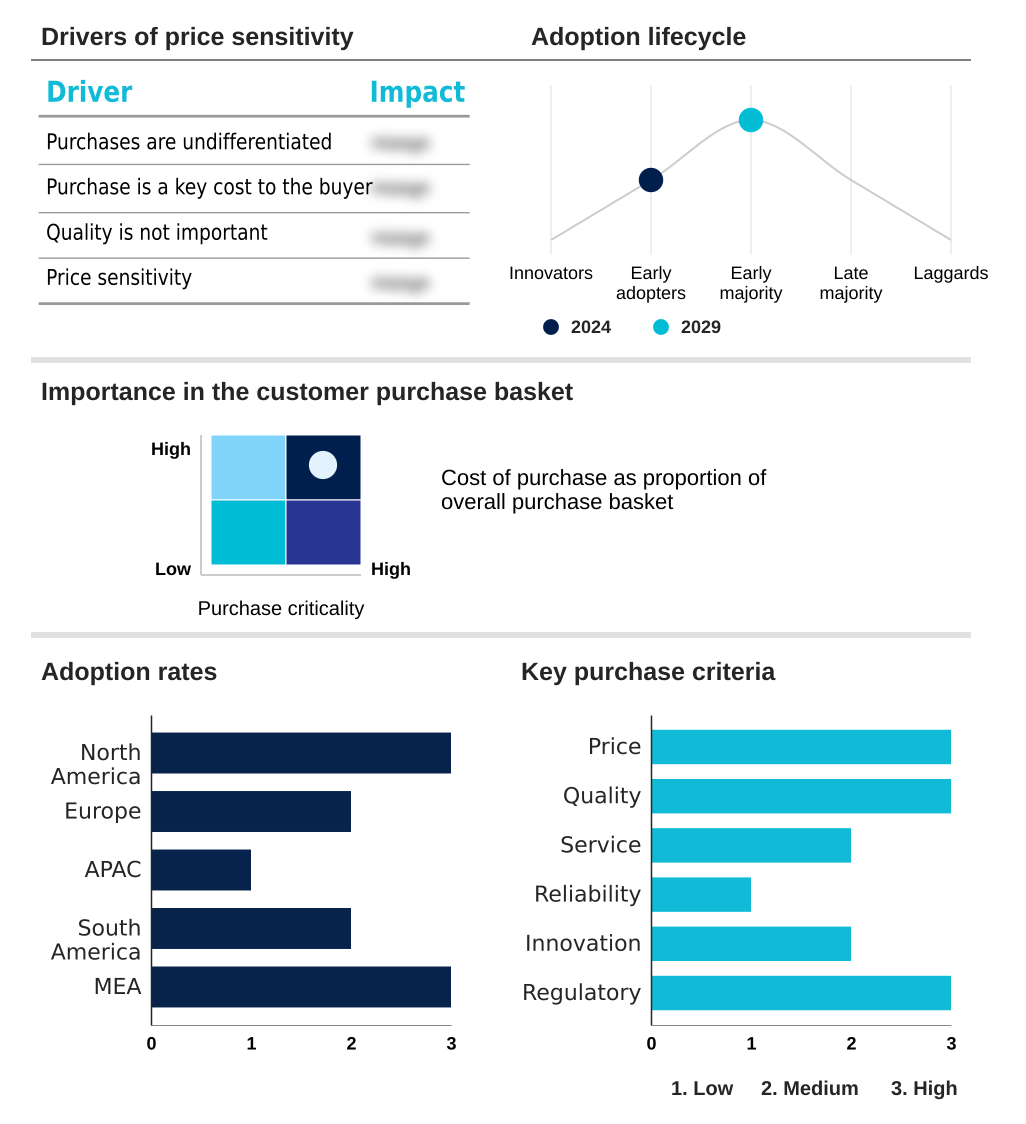
Exclusive Technavio Analysis on Customer Landscape

The ai for scientific discovery market forecasting report includes the adoption lifecycle of the market, covering from the innovator’s stage to the laggard’s stage. It focuses on adoption rates in different regions based on penetration. Furthermore, the ai for scientific discovery market report also includes key purchase criteria and drivers of price sensitivity to help companies evaluate and develop their market growth analysis strategies.

Customer Landscape of AI For Scientific Discovery Industry

Competitive Landscape

Companies are implementing various strategies, such as strategic alliances, ai for scientific discovery market forecast, partnerships, mergers and acquisitions, geographical expansion, and product/service launches, to enhance their presence in the industry.

AbCellera Biologics Inc. - Accelerates therapeutic antibody discovery through an AI-powered engine, significantly shortening development timelines for complex biologics.

The industry research and growth report includes detailed analyses of the competitive landscape of the market and information about key companies, including:

  • AbCellera Biologics Inc.
  • Amazon Web Services Inc.
  • Atomwise Inc.
  • Benchling Inc.
  • BenchSci Analytics Inc.
  • BenevolentAI
  • Evaxion AS
  • Generate Biomedicines
  • Google LLC
  • Healx Ltd.
  • IBM Corp.
  • Insilico Medicine
  • Microsoft Corp.
  • Nimbus Therapeutics
  • Novartis AG
  • NVIDIA Corp.
  • Recursion Pharmaceuticals Inc.
  • Schrodinger Inc.

Qualitative and quantitative analysis of companies has been conducted to help clients understand the wider business environment as well as the strengths and weaknesses of key industry players. Data is qualitatively analyzed to categorize companies as pure play, category-focused, industry-focused, and diversified; it is quantitatively analyzed to categorize companies as dominant, leading, strong, tentative, and weak.

Recent Development and News in Ai for scientific discovery market

  • In September 2024, Takeda Pharmaceutical Company announced the expansion of its collaboration with an AI drug discovery firm to identify novel therapeutic targets for complex neurological disorders.
  • In November 2024, Recursion Pharmaceuticals Inc. initiated a multi-year collaboration with a leading academic medical center to create one of the largest multi-modal cancer datasets, aiming to identify novel biomarkers.
  • In January 2025, Schrodinger Inc. launched an advanced update to its physics-based computational platform, integrating a new generative AI module for de novo protein design.
  • In March 2025, Microsoft Corp. announced a strategic initiative to provide significant Azure cloud computing credits to researchers focused on using AI for climate change and sustainability science.

Dive into Technavio’s robust research methodology, blending expert interviews, extensive data synthesis, and validated models for unparalleled AI For Scientific Discovery Market insights. See full methodology.

Market Scope
Page number 301
Base year 2024
Historic period 2019-2023
Forecast period 2025-2029
Growth momentum & CAGR Accelerate at a CAGR of 19%
Market growth 2025-2029 USD 4407.4 million
Market structure Fragmented
YoY growth 2024-2025(%) 15.7%
Key countries US, Canada, Mexico, Germany, UK, France, Italy, Spain, The Netherlands, China, Japan, India, South Korea, Australia, Indonesia, Brazil, Argentina, Colombia, Saudi Arabia, UAE, South Africa, Israel and Turkey
Competitive landscape Leading Companies, Market Positioning of Companies, Competitive Strategies, and Industry Risks

Request Free Sample

Research Analyst Overview

  • The market is defined by the rapid maturation of AI from a niche tool to a core component of the scientific R&D process. Foundational technologies such as generative models and graph neural networks are now central to industrial applications, including de novo molecule design and materials informatics.
  • This technological shift is compelling a strategic pivot in corporate budgeting toward bioinformatics platforms and computational drug design to maintain a competitive edge. The entire discovery pipeline, from initial target discovery and biomarker analysis to clinical trial optimization, is being re-engineered with AI. For example, platforms integrating physics-informed ml have demonstrated a 30% improvement in simulation accuracy with sparse data.
  • The ability to perform high-fidelity molecular dynamics simulation and quantum chemistry simulation is accelerating research. The focus is now on integrating multi-modal data analysis from genomic data integration and proteomic analysis to create a holistic view within systems biology.
  • The demand for explainable ai (xai) is rising to ensure model interpretability and support regulatory validation for applications like predictive toxicology, which is critical for de-risking development.

What are the Key Data Covered in this AI For Scientific Discovery Market Research and Growth Report?

  • What is the expected growth of the AI For Scientific Discovery Market between 2025 and 2029?

    • USD 4.41 billion, at a CAGR of 19%

  • What segmentation does the market report cover?

    • The report is segmented by Application (Target discovery, De novo molecule design, Biomarker and omics analysis, Predictive toxicology), Technology (Generative models, Graph and molecular ML, Physics-informed ML, Simulation and digital twins), End-user (Pharmaceutical research and development, Biotechnology companies, Academic and national labs, Chemical and materials science firms) and Geography (North America, Europe, APAC, South America, Middle East and Africa)

  • Which regions are analyzed in the report?

    • North America, Europe, APAC, South America and Middle East and Africa

  • What are the key growth drivers and market challenges?

    • Proliferation of high-volume scientific data and advanced computational infrastructure, Data Scarcity, quality, and interoperability

  • Who are the major players in the AI For Scientific Discovery Market?

    • AbCellera Biologics Inc., Amazon Web Services Inc., Atomwise Inc., Benchling Inc., BenchSci Analytics Inc., BenevolentAI, Evaxion AS, Generate Biomedicines, Google LLC, Healx Ltd., IBM Corp., Insilico Medicine, Microsoft Corp., Nimbus Therapeutics, Novartis AG, NVIDIA Corp., Recursion Pharmaceuticals Inc. and Schrodinger Inc.

Market Research Insights

  • Market dynamics are increasingly shaped by the adoption of specialized AI platforms for drug discovery and advances in machine learning in materials science. These technologies facilitate accelerated discovery cycles and enable new frontiers in ai in personalized medicine.
  • The integration of generative AI for protein design has led to a 30% increase in the identification of novel therapeutic candidates compared to traditional screening methods. Similarly, the use of deep learning for genomics is enhancing in silico drug repurposing efforts and aiding ai for rare disease research.
  • This progress is underpinned by a robust computational infrastructure for ai, which is essential for processing large datasets. The effectiveness of these systems is evident in performance metrics, with some platforms achieving a 40% reduction in preclinical analysis timelines, thereby improving research ROI.

We can help! Our analysts can customize this ai for scientific discovery market research report to meet your requirements.

Get in touch

1. Executive Summary

1.1 Market overview

Executive Summary - Chart on Market Overview
Executive Summary - Data Table on Market Overview
Executive Summary - Chart on Global Market Characteristics
Executive Summary - Chart on Market by Geography
Executive Summary - Chart on Market Segmentation by Application
Executive Summary - Chart on Market Segmentation by Technology
Executive Summary - Chart on Market Segmentation by End-user
Executive Summary - Chart on Incremental Growth
Executive Summary - Data Table on Incremental Growth
Executive Summary - Chart on Company Market Positioning

2. Technavio Analysis

2.1 Analysis of price sensitivity, lifecycle, customer purchase basket, adoption rates, and purchase criteria

2.2 Criticality of inputs and Factors of differentiation

Chart on Overview on criticality of inputs and factors of differentiation

2.3 Factors of disruption

Chart on Overview on factors of disruption

2.4 Impact of drivers and challenges

Chart on Impact of drivers and challenges in 2024 and 2029

3. Market Landscape

3.1 Market ecosystem

Chart on Parent Market
Data Table on - Parent Market

3.2 Market characteristics

Chart on Market characteristics analysis

3.3 Value chain analysis

Chart on Value chain analysis

4. Market Sizing

4.1 Market definition

Data Table on Offerings of companies included in the market definition

4.2 Market segment analysis

Market segments

4.3 Market size 2024

4.4 Market outlook: Forecast for 2024-2029

Chart on Global - Market size and forecast 2024-2029 ($ million)
Data Table on Global - Market size and forecast 2024-2029 ($ million)
Chart on Global Market: Year-over-year growth 2024-2029 (%)
Data Table on Global Market: Year-over-year growth 2024-2029 (%)

5. Historic Market Size

5.1 Global AI For Scientific Discovery Market 2019 - 2023

Historic Market Size - Data Table on Global AI For Scientific Discovery Market 2019 - 2023 ($ million)

5.2 Application segment analysis 2019 - 2023

Historic Market Size - Application Segment 2019 - 2023 ($ million)

5.3 Technology segment analysis 2019 - 2023

Historic Market Size - Technology Segment 2019 - 2023 ($ million)

5.4 End-user segment analysis 2019 - 2023

Historic Market Size - End-user Segment 2019 - 2023 ($ million)

5.5 Geography segment analysis 2019 - 2023

Historic Market Size - Geography Segment 2019 - 2023 ($ million)

5.6 Country segment analysis 2019 - 2023

Historic Market Size - Country Segment 2019 - 2023 ($ million)

6. Five Forces Analysis

6.1 Five forces summary

Five forces analysis - Comparison between 2024 and 2029

6.2 Bargaining power of buyers

Bargaining power of buyers - Impact of key factors 2024 and 2029

6.3 Bargaining power of suppliers

Bargaining power of suppliers - Impact of key factors in 2024 and 2029

6.4 Threat of new entrants

Threat of new entrants - Impact of key factors in 2024 and 2029

6.5 Threat of substitutes

Threat of substitutes - Impact of key factors in 2024 and 2029

6.6 Threat of rivalry

Threat of rivalry - Impact of key factors in 2024 and 2029

6.7 Market condition

Chart on Market condition - Five forces 2024 and 2029

7. Market Segmentation by Application

7.1 Market segments

Chart on Application - Market share 2024-2029 (%)
Data Table on Application - Market share 2024-2029 (%)

7.2 Comparison by Application

Chart on Comparison by Application
Data Table on Comparison by Application

7.3 Target discovery - Market size and forecast 2024-2029

Chart on Target discovery - Market size and forecast 2024-2029 ($ million)
Data Table on Target discovery - Market size and forecast 2024-2029 ($ million)
Chart on Target discovery - Year-over-year growth 2024-2029 (%)
Data Table on Target discovery - Year-over-year growth 2024-2029 (%)

7.4 De novo molecule design - Market size and forecast 2024-2029

Chart on De novo molecule design - Market size and forecast 2024-2029 ($ million)
Data Table on De novo molecule design - Market size and forecast 2024-2029 ($ million)
Chart on De novo molecule design - Year-over-year growth 2024-2029 (%)
Data Table on De novo molecule design - Year-over-year growth 2024-2029 (%)

7.5 Biomarker and omics analysis - Market size and forecast 2024-2029

Chart on Biomarker and omics analysis - Market size and forecast 2024-2029 ($ million)
Data Table on Biomarker and omics analysis - Market size and forecast 2024-2029 ($ million)
Chart on Biomarker and omics analysis - Year-over-year growth 2024-2029 (%)
Data Table on Biomarker and omics analysis - Year-over-year growth 2024-2029 (%)

7.6 Predictive toxicology - Market size and forecast 2024-2029

Chart on Predictive toxicology - Market size and forecast 2024-2029 ($ million)
Data Table on Predictive toxicology - Market size and forecast 2024-2029 ($ million)
Chart on Predictive toxicology - Year-over-year growth 2024-2029 (%)
Data Table on Predictive toxicology - Year-over-year growth 2024-2029 (%)

7.7 Market opportunity by Application

Market opportunity by Application ($ million)
Data Table on Market opportunity by Application ($ million)

8. Market Segmentation by Technology

8.1 Market segments

Chart on Technology - Market share 2024-2029 (%)
Data Table on Technology - Market share 2024-2029 (%)

8.2 Comparison by Technology

Chart on Comparison by Technology
Data Table on Comparison by Technology

8.3 Generative models - Market size and forecast 2024-2029

Chart on Generative models - Market size and forecast 2024-2029 ($ million)
Data Table on Generative models - Market size and forecast 2024-2029 ($ million)
Chart on Generative models - Year-over-year growth 2024-2029 (%)
Data Table on Generative models - Year-over-year growth 2024-2029 (%)

8.4 Graph and molecular ML - Market size and forecast 2024-2029

Chart on Graph and molecular ML - Market size and forecast 2024-2029 ($ million)
Data Table on Graph and molecular ML - Market size and forecast 2024-2029 ($ million)
Chart on Graph and molecular ML - Year-over-year growth 2024-2029 (%)
Data Table on Graph and molecular ML - Year-over-year growth 2024-2029 (%)

8.5 Physics-informed ML - Market size and forecast 2024-2029

Chart on Physics-informed ML - Market size and forecast 2024-2029 ($ million)
Data Table on Physics-informed ML - Market size and forecast 2024-2029 ($ million)
Chart on Physics-informed ML - Year-over-year growth 2024-2029 (%)
Data Table on Physics-informed ML - Year-over-year growth 2024-2029 (%)

8.6 Simulation and digital twins - Market size and forecast 2024-2029

Chart on Simulation and digital twins - Market size and forecast 2024-2029 ($ million)
Data Table on Simulation and digital twins - Market size and forecast 2024-2029 ($ million)
Chart on Simulation and digital twins - Year-over-year growth 2024-2029 (%)
Data Table on Simulation and digital twins - Year-over-year growth 2024-2029 (%)

8.7 Market opportunity by Technology

Market opportunity by Technology ($ million)
Data Table on Market opportunity by Technology ($ million)

9. Market Segmentation by End-user

9.1 Market segments

Chart on End-user - Market share 2024-2029 (%)
Data Table on End-user - Market share 2024-2029 (%)

9.2 Comparison by End-user

Chart on Comparison by End-user
Data Table on Comparison by End-user

9.3 Pharmaceutical research and development - Market size and forecast 2024-2029

Chart on Pharmaceutical research and development - Market size and forecast 2024-2029 ($ million)
Data Table on Pharmaceutical research and development - Market size and forecast 2024-2029 ($ million)
Chart on Pharmaceutical research and development - Year-over-year growth 2024-2029 (%)
Data Table on Pharmaceutical research and development - Year-over-year growth 2024-2029 (%)

9.4 Biotechnology companies - Market size and forecast 2024-2029

Chart on Biotechnology companies - Market size and forecast 2024-2029 ($ million)
Data Table on Biotechnology companies - Market size and forecast 2024-2029 ($ million)
Chart on Biotechnology companies - Year-over-year growth 2024-2029 (%)
Data Table on Biotechnology companies - Year-over-year growth 2024-2029 (%)

9.5 Academic and national labs - Market size and forecast 2024-2029

Chart on Academic and national labs - Market size and forecast 2024-2029 ($ million)
Data Table on Academic and national labs - Market size and forecast 2024-2029 ($ million)
Chart on Academic and national labs - Year-over-year growth 2024-2029 (%)
Data Table on Academic and national labs - Year-over-year growth 2024-2029 (%)

9.6 Chemical and materials science firms - Market size and forecast 2024-2029

Chart on Chemical and materials science firms - Market size and forecast 2024-2029 ($ million)
Data Table on Chemical and materials science firms - Market size and forecast 2024-2029 ($ million)
Chart on Chemical and materials science firms - Year-over-year growth 2024-2029 (%)
Data Table on Chemical and materials science firms - Year-over-year growth 2024-2029 (%)

9.7 Market opportunity by End-user

Market opportunity by End-user ($ million)
Data Table on Market opportunity by End-user ($ million)

10. Customer Landscape

10.1 Customer landscape overview

Analysis of price sensitivity, lifecycle, customer purchase basket, adoption rates, and purchase criteria

11. Geographic Landscape

11.1 Geographic segmentation

Chart on Market share by geography 2024-2029 (%)
Data Table on Market share by geography 2024-2029 (%)

11.2 Geographic comparison

Chart on Geographic comparison
Data Table on Geographic comparison

11.3 North America - Market size and forecast 2024-2029

Chart on North America - Market size and forecast 2024-2029 ($ million)
Data Table on North America - Market size and forecast 2024-2029 ($ million)
Chart on North America - Year-over-year growth 2024-2029 (%)
Data Table on North America - Year-over-year growth 2024-2029 (%)
Chart on Regional Comparison - North America
Data Table on Regional Comparison - North America

11.3.1 US - Market size and forecast 2024-2029

Chart on US - Market size and forecast 2024-2029 ($ million)
Data Table on US - Market size and forecast 2024-2029 ($ million)
Chart on US - Year-over-year growth 2024-2029 (%)
Data Table on US - Year-over-year growth 2024-2029 (%)

11.3.2 Canada - Market size and forecast 2024-2029

Chart on Canada - Market size and forecast 2024-2029 ($ million)
Data Table on Canada - Market size and forecast 2024-2029 ($ million)
Chart on Canada - Year-over-year growth 2024-2029 (%)
Data Table on Canada - Year-over-year growth 2024-2029 (%)

11.3.3 Mexico - Market size and forecast 2024-2029

Chart on Mexico - Market size and forecast 2024-2029 ($ million)
Data Table on Mexico - Market size and forecast 2024-2029 ($ million)
Chart on Mexico - Year-over-year growth 2024-2029 (%)
Data Table on Mexico - Year-over-year growth 2024-2029 (%)

11.4 Europe - Market size and forecast 2024-2029

Chart on Europe - Market size and forecast 2024-2029 ($ million)
Data Table on Europe - Market size and forecast 2024-2029 ($ million)
Chart on Europe - Year-over-year growth 2024-2029 (%)
Data Table on Europe - Year-over-year growth 2024-2029 (%)
Chart on Regional Comparison - Europe
Data Table on Regional Comparison - Europe

11.4.1 Germany - Market size and forecast 2024-2029

Chart on Germany - Market size and forecast 2024-2029 ($ million)
Data Table on Germany - Market size and forecast 2024-2029 ($ million)
Chart on Germany - Year-over-year growth 2024-2029 (%)
Data Table on Germany - Year-over-year growth 2024-2029 (%)

11.4.2 UK - Market size and forecast 2024-2029

Chart on UK - Market size and forecast 2024-2029 ($ million)
Data Table on UK - Market size and forecast 2024-2029 ($ million)
Chart on UK - Year-over-year growth 2024-2029 (%)
Data Table on UK - Year-over-year growth 2024-2029 (%)

11.4.3 France - Market size and forecast 2024-2029

Chart on France - Market size and forecast 2024-2029 ($ million)
Data Table on France - Market size and forecast 2024-2029 ($ million)
Chart on France - Year-over-year growth 2024-2029 (%)
Data Table on France - Year-over-year growth 2024-2029 (%)

11.4.4 Italy - Market size and forecast 2024-2029

Chart on Italy - Market size and forecast 2024-2029 ($ million)
Data Table on Italy - Market size and forecast 2024-2029 ($ million)
Chart on Italy - Year-over-year growth 2024-2029 (%)
Data Table on Italy - Year-over-year growth 2024-2029 (%)

11.4.5 Spain - Market size and forecast 2024-2029

Chart on Spain - Market size and forecast 2024-2029 ($ million)
Data Table on Spain - Market size and forecast 2024-2029 ($ million)
Chart on Spain - Year-over-year growth 2024-2029 (%)
Data Table on Spain - Year-over-year growth 2024-2029 (%)

11.4.6 The Netherlands - Market size and forecast 2024-2029

Chart on The Netherlands - Market size and forecast 2024-2029 ($ million)
Data Table on The Netherlands - Market size and forecast 2024-2029 ($ million)
Chart on The Netherlands - Year-over-year growth 2024-2029 (%)
Data Table on The Netherlands - Year-over-year growth 2024-2029 (%)

11.5 APAC - Market size and forecast 2024-2029

Chart on APAC - Market size and forecast 2024-2029 ($ million)
Data Table on APAC - Market size and forecast 2024-2029 ($ million)
Chart on APAC - Year-over-year growth 2024-2029 (%)
Data Table on APAC - Year-over-year growth 2024-2029 (%)
Chart on Regional Comparison - APAC
Data Table on Regional Comparison - APAC

11.5.1 China - Market size and forecast 2024-2029

Chart on China - Market size and forecast 2024-2029 ($ million)
Data Table on China - Market size and forecast 2024-2029 ($ million)
Chart on China - Year-over-year growth 2024-2029 (%)
Data Table on China - Year-over-year growth 2024-2029 (%)

11.5.2 Japan - Market size and forecast 2024-2029

Chart on Japan - Market size and forecast 2024-2029 ($ million)
Data Table on Japan - Market size and forecast 2024-2029 ($ million)
Chart on Japan - Year-over-year growth 2024-2029 (%)
Data Table on Japan - Year-over-year growth 2024-2029 (%)

11.5.3 India - Market size and forecast 2024-2029

Chart on India - Market size and forecast 2024-2029 ($ million)
Data Table on India - Market size and forecast 2024-2029 ($ million)
Chart on India - Year-over-year growth 2024-2029 (%)
Data Table on India - Year-over-year growth 2024-2029 (%)

11.5.4 South Korea - Market size and forecast 2024-2029

Chart on South Korea - Market size and forecast 2024-2029 ($ million)
Data Table on South Korea - Market size and forecast 2024-2029 ($ million)
Chart on South Korea - Year-over-year growth 2024-2029 (%)
Data Table on South Korea - Year-over-year growth 2024-2029 (%)

11.5.5 Australia - Market size and forecast 2024-2029

Chart on Australia - Market size and forecast 2024-2029 ($ million)
Data Table on Australia - Market size and forecast 2024-2029 ($ million)
Chart on Australia - Year-over-year growth 2024-2029 (%)
Data Table on Australia - Year-over-year growth 2024-2029 (%)

11.5.6 Indonesia - Market size and forecast 2024-2029

Chart on Indonesia - Market size and forecast 2024-2029 ($ million)
Data Table on Indonesia - Market size and forecast 2024-2029 ($ million)
Chart on Indonesia - Year-over-year growth 2024-2029 (%)
Data Table on Indonesia - Year-over-year growth 2024-2029 (%)

11.6 South America - Market size and forecast 2024-2029

Chart on South America - Market size and forecast 2024-2029 ($ million)
Data Table on South America - Market size and forecast 2024-2029 ($ million)
Chart on South America - Year-over-year growth 2024-2029 (%)
Data Table on South America - Year-over-year growth 2024-2029 (%)
Chart on Regional Comparison - South America
Data Table on Regional Comparison - South America

11.6.1 Brazil - Market size and forecast 2024-2029

Chart on Brazil - Market size and forecast 2024-2029 ($ million)
Data Table on Brazil - Market size and forecast 2024-2029 ($ million)
Chart on Brazil - Year-over-year growth 2024-2029 (%)
Data Table on Brazil - Year-over-year growth 2024-2029 (%)

11.6.2 Argentina - Market size and forecast 2024-2029

Chart on Argentina - Market size and forecast 2024-2029 ($ million)
Data Table on Argentina - Market size and forecast 2024-2029 ($ million)
Chart on Argentina - Year-over-year growth 2024-2029 (%)
Data Table on Argentina - Year-over-year growth 2024-2029 (%)

11.6.3 Colombia - Market size and forecast 2024-2029

Chart on Colombia - Market size and forecast 2024-2029 ($ million)
Data Table on Colombia - Market size and forecast 2024-2029 ($ million)
Chart on Colombia - Year-over-year growth 2024-2029 (%)
Data Table on Colombia - Year-over-year growth 2024-2029 (%)

11.7 Middle East and Africa - Market size and forecast 2024-2029

Chart on Middle East and Africa - Market size and forecast 2024-2029 ($ million)
Data Table on Middle East and Africa - Market size and forecast 2024-2029 ($ million)
Chart on Middle East and Africa - Year-over-year growth 2024-2029 (%)
Data Table on Middle East and Africa - Year-over-year growth 2024-2029 (%)
Chart on Regional Comparison - Middle East and Africa
Data Table on Regional Comparison - Middle East and Africa

11.7.1 Saudi Arabia - Market size and forecast 2024-2029

Chart on Saudi Arabia - Market size and forecast 2024-2029 ($ million)
Data Table on Saudi Arabia - Market size and forecast 2024-2029 ($ million)
Chart on Saudi Arabia - Year-over-year growth 2024-2029 (%)
Data Table on Saudi Arabia - Year-over-year growth 2024-2029 (%)

11.7.2 UAE - Market size and forecast 2024-2029

Chart on UAE - Market size and forecast 2024-2029 ($ million)
Data Table on UAE - Market size and forecast 2024-2029 ($ million)
Chart on UAE - Year-over-year growth 2024-2029 (%)
Data Table on UAE - Year-over-year growth 2024-2029 (%)

11.7.3 South Africa - Market size and forecast 2024-2029

Chart on South Africa - Market size and forecast 2024-2029 ($ million)
Data Table on South Africa - Market size and forecast 2024-2029 ($ million)
Chart on South Africa - Year-over-year growth 2024-2029 (%)
Data Table on South Africa - Year-over-year growth 2024-2029 (%)

11.7.4 Israel - Market size and forecast 2024-2029

Chart on Israel - Market size and forecast 2024-2029 ($ million)
Data Table on Israel - Market size and forecast 2024-2029 ($ million)
Chart on Israel - Year-over-year growth 2024-2029 (%)
Data Table on Israel - Year-over-year growth 2024-2029 (%)

11.7.5 Turkey - Market size and forecast 2024-2029

Chart on Turkey - Market size and forecast 2024-2029 ($ million)
Data Table on Turkey - Market size and forecast 2024-2029 ($ million)
Chart on Turkey - Year-over-year growth 2024-2029 (%)
Data Table on Turkey - Year-over-year growth 2024-2029 (%)

11.8 Market opportunity by geography

Market opportunity by geography ($ million)
Data Tables on Market opportunity by geography ($ million)

12. Drivers, Challenges, and Opportunity

12.1 Market drivers

Proliferation of high-volume scientific data and advanced computational infrastructure
Escalating investment and cross-disciplinary strategic collaborations
Transformative advances in AI models and algorithms

12.2 Market challenges

Data Scarcity, quality, and interoperability
Prohibitive computational costs and infrastructure barriers
Model interpretability, validation, and reproducibility

12.3 Impact of drivers and challenges

Impact of drivers and challenges in 2024 and 2029

12.4 Market opportunities

Exponential growth in multi-modal and high-dimensional scientific data
Maturation of AI architectures and democratization of high-performance computing
Escalating strategic investments and public-private collaborations

13. Competitive Landscape

13.1 Overview

13.2

Overview on criticality of inputs and factors of differentiation

13.3 Landscape disruption

Overview on factors of disruption

13.4 Industry risks

Impact of key risks on business

14. Competitive Analysis

14.1 Companies profiled

Companies covered

14.2 Company ranking index

14.3 Market positioning of companies

Matrix on companies position and classification

14.4 AbCellera Biologics Inc.

AbCellera Biologics Inc. - Overview
AbCellera Biologics Inc. - Product / Service
AbCellera Biologics Inc. - Key offerings
SWOT

14.5 Amazon Web Services Inc.

Amazon Web Services Inc. - Overview
Amazon Web Services Inc. - Product / Service
Amazon Web Services Inc. - Key news
Amazon Web Services Inc. - Key offerings
SWOT

14.6 Atomwise Inc.

Atomwise Inc. - Overview
Atomwise Inc. - Product / Service
Atomwise Inc. - Key offerings
SWOT

14.7 Benchling Inc.

Benchling Inc. - Overview
Benchling Inc. - Product / Service
Benchling Inc. - Key offerings
SWOT

14.8 BenchSci Analytics Inc.

BenchSci Analytics Inc. - Overview
BenchSci Analytics Inc. - Product / Service
BenchSci Analytics Inc. - Key offerings
SWOT

14.9 BenevolentAI

BenevolentAI - Overview
BenevolentAI - Product / Service
BenevolentAI - Key offerings
SWOT

14.10 Evaxion AS

Evaxion AS - Overview
Evaxion AS - Product / Service
Evaxion AS - Key offerings
SWOT

14.11 Google LLC

Google LLC - Overview
Google LLC - Product / Service
Google LLC - Key offerings
SWOT

14.12 Healx Ltd.

Healx Ltd. - Overview
Healx Ltd. - Product / Service
Healx Ltd. - Key offerings
SWOT

14.13 IBM Corp.

IBM Corp. - Overview
IBM Corp. - Business segments
IBM Corp. - Key news
IBM Corp. - Key offerings
IBM Corp. - Segment focus
SWOT

14.14 Insilico Medicine

Insilico Medicine - Overview
Insilico Medicine - Product / Service
Insilico Medicine - Key offerings
SWOT

14.15 Microsoft Corp.

Microsoft Corp. - Overview
Microsoft Corp. - Business segments
Microsoft Corp. - Key news
Microsoft Corp. - Key offerings
Microsoft Corp. - Segment focus
SWOT

14.16 NVIDIA Corp.

NVIDIA Corp. - Overview
NVIDIA Corp. - Business segments
NVIDIA Corp. - Key news
NVIDIA Corp. - Key offerings
NVIDIA Corp. - Segment focus
SWOT

14.17 Recursion Pharmaceuticals Inc.

Recursion Pharmaceuticals Inc. - Overview
Recursion Pharmaceuticals Inc. - Product / Service
Recursion Pharmaceuticals Inc. - Key offerings
SWOT

14.18 Schrodinger Inc.

Schrodinger Inc. - Overview
Schrodinger Inc. - Business segments
Schrodinger Inc. - Key offerings
Schrodinger Inc. - Segment focus
SWOT

15. Appendix

15.1 Scope of the report

Market definition
Objectives
Notes and caveats

15.2 Inclusions and exclusions checklist

Inclusions checklist
Exclusions checklist

15.3 Currency conversion rates for US$

15.4 Research methodology

15.5 Data procurement

Information sources

15.6 Data validation

15.7 Validation techniques employed for market sizing

15.8 Data synthesis

15.9 360 degree market analysis

15.10 List of abbreviations

Research Methodology

Technavio presents a detailed picture of the market by way of study, synthesis, and summation of data from multiple sources. The analysts have presented the various facets of the market with a particular focus on identifying the key industry influencers. The data thus presented is comprehensive, reliable, and the result of extensive research, both primary and secondary.

INFORMATION SOURCES

Primary sources

  • Manufacturers and suppliers
  • Channel partners
  • Industry experts
  • Strategic decision makers

Secondary sources

  • Industry journals and periodicals
  • Government data
  • Financial reports of key industry players
  • Historical data
  • Press releases

DATA ANALYSIS

Data Synthesis

  • Collation of data
  • Estimation of key figures
  • Analysis of derived insights

Data Validation

  • Triangulation with data models
  • Reference against proprietary databases
  • Corroboration with industry experts

REPORT WRITING

Qualitative

  • Market drivers
  • Market challenges
  • Market trends
  • Five forces analysis

Quantitative

  • Market size and forecast
  • Market segmentation
  • Geographical insights
  • Competitive landscape

Interested in this report?

Get your sample now to see our research methodology and insights!

Download Now

Frequently Asked Questions

AI For Scientific Discovery market growth will increase by USD 4407.4 million during 2025-2029.

The AI For Scientific Discovery market is expected to grow at a CAGR of 19% during 2025-2029.

AI For Scientific Discovery market is segmented by Application (Target discovery, De novo molecule design, Biomarker and omics analysis, Predictive toxicology) Technology (Generative models, Graph and molecular ML, Physics-informed ML, Simulation and digital twins) End-user (Pharmaceutical research and development, Biotechnology companies, Academic and national labs, Chemical and materials science firms)

AbCellera Biologics Inc., Amazon Web Services Inc., Atomwise Inc., Benchling Inc., BenchSci Analytics Inc., BenevolentAI, Evaxion AS, Generate Biomedicines, Google LLC, Healx Ltd., IBM Corp., Insilico Medicine, Microsoft Corp., Nimbus Therapeutics, Novartis AG, NVIDIA Corp., Recursion Pharmaceuticals Inc., Schrodinger Inc. are a few of the key vendors in the AI For Scientific Discovery market.

North America will register the highest growth rate of 39.2% among the other regions. Therefore, the AI For Scientific Discovery market in North America is expected to garner significant business opportunities for the vendors during the forecast period.

US, Canada, Mexico, Germany, UK, France, Italy, Spain, The Netherlands, China, Japan, India, South Korea, Australia, Indonesia, Brazil, Argentina, Colombia, Saudi Arabia, UAE, South Africa, Israel, Turkey

  • Proliferation of high-volume scientific data and advanced computational infrastructure is the driving factor this market.

The AI For Scientific Discovery market vendors should focus on grabbing business opportunities from the Application segment as it accounted for the largest market share in the base year.