AI For Security Compliance Market Analysis, Size, and Forecast 2025-2029: North America (US, Canada, and Mexico), Europe (Germany, UK, and France), APAC (Japan, South Korea, and China), South America (Brazil, Argentina, and Colombia), Middle East and Africa (Saudi Arabia, UAE, and South Africa), and Rest of World (ROW)

AI For Security Compliance Market Analysis, Size, and Forecast 2025-2029:
North America (US, Canada, and Mexico), Europe (Germany, UK, and France), APAC (Japan, South Korea, and China), South America (Brazil, Argentina, and Colombia), Middle East and Africa (Saudi Arabia, UAE, and South Africa), and Rest of World (ROW)

Published: Dec 2025 283 Pages SKU: IRTNTR81004

Market Overview at a Glance

$6.13 B
Market Opportunity
17.1%
CAGR
32.6%
North America Growth

AI For Security Compliance Market Size 2025-2029

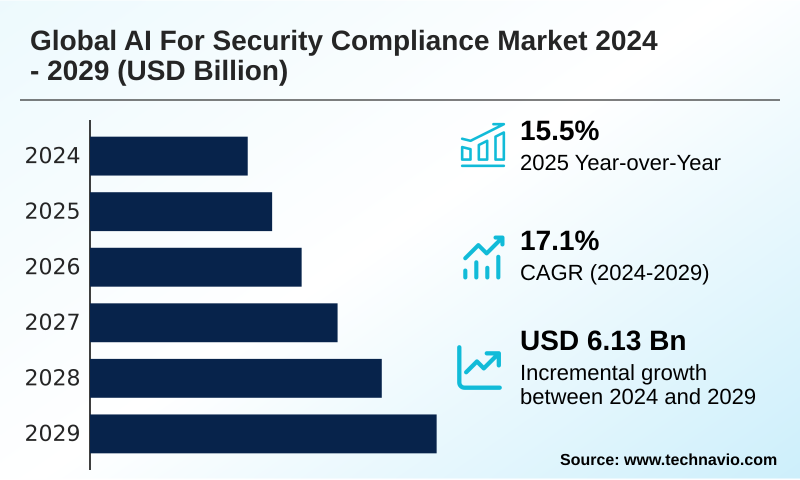
The ai for security compliance market size is valued to increase by USD 6.13 billion, at a CAGR of 17.1% from 2024 to 2029. Rising regulatory complexity and global compliance mandates will drive the ai for security compliance market.

Major Market Trends & Insights

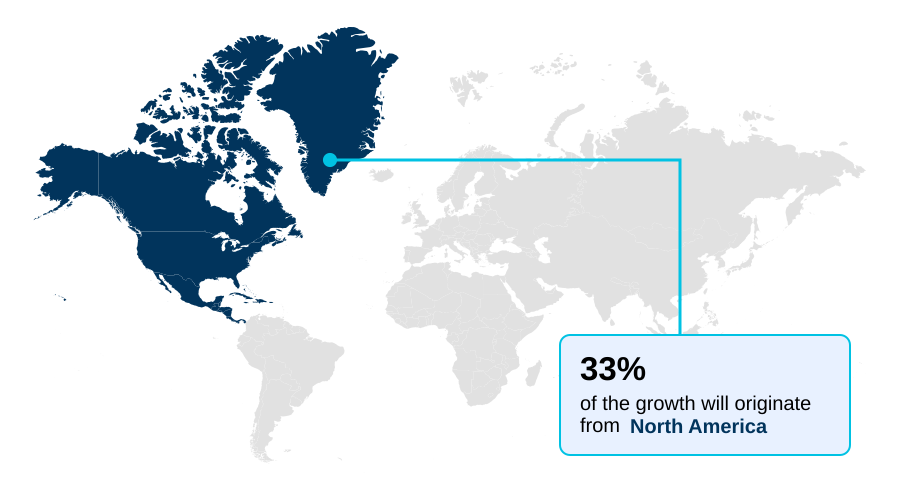
  • North America dominated the market and accounted for a 32.6% growth during the forecast period.
  • CAGR from 2024 to 2029 : 17.1%

Market Summary

  • The AI for security compliance market is fundamentally reshaping how organizations manage regulatory adherence and cybersecurity. Enterprises are moving beyond manual checks, adopting AI-driven systems for continuous compliance and robust data governance. These platforms leverage natural language processing to interpret evolving legal texts and employ machine learning models for predictive compliance analytics, identifying potential violations before they occur.
  • For instance, a financial institution can deploy an AI solution for automated security audits, using behavioral analytics to monitor transactions for AML and KYC compliance, thereby improving detection accuracy by over 30% while ensuring complete, real-time audit trails.
  • This shift toward intelligent, proactive frameworks like zero-trust architecture is driven by the need for greater precision in a landscape of increasing threats. The adoption of AI copilot for security and AI-powered risk assessment tools is becoming standard as businesses seek to fortify their security posture and automate security incident response effectively.
  • Ultimately, these technologies enable a more resilient and efficient approach to navigating complex compliance demands.

What will be the Size of the AI For Security Compliance Market during the forecast period?

Get Key Insights on Market Forecast (PDF) Request Free Sample

How is the AI For Security Compliance Market Segmented?

The ai for security compliance industry research report provides comprehensive data (region-wise segment analysis), with forecasts and estimates in "USD million" for the period 2025-2029.

  • Component
    • Solution
    • Services
  • Business segment
    • Large enterprises
    • Small and medium enterprises
  • End-user
    • BFSI
    • Government and public utilities
    • IT and telecom
    • Healthcare
    • Others
  • Geography
    • North America
      • US
      • Canada
      • Mexico
    • Europe
      • Germany
      • UK
      • France
    • APAC
      • Japan
      • South Korea
      • China
    • South America
      • Brazil
      • Argentina
      • Colombia
    • Middle East and Africa
      • Saudi Arabia
      • UAE
      • South Africa
    • Rest of World (ROW)

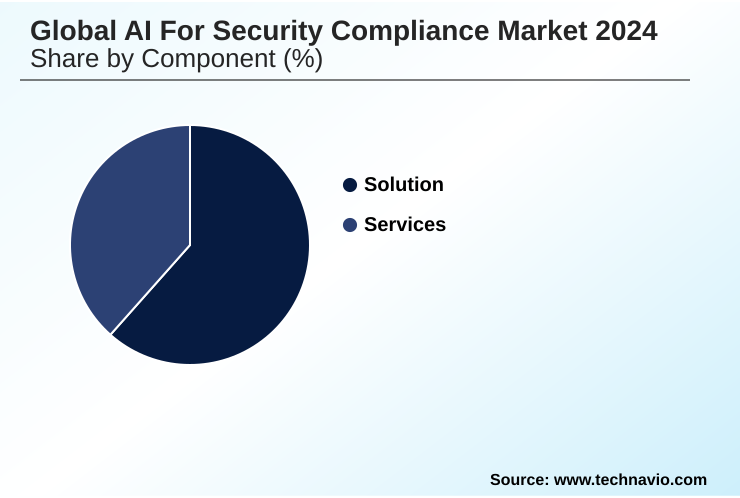
By Component Insights

The solution segment is estimated to witness significant growth during the forecast period.

The market's solution segment provides software platforms essential for navigating complex regulatory landscapes. These tools facilitate compliance automation through a policy enforcement engine and provide real-time audit trails for verification.

Organizations are leveraging AI for HIPAA compliance and AI for GDPR compliance, with nearly 40% of enterprise users utilizing these systems for automated data classification.

Key functionalities include a risk scoring engine and policy-as-code frameworks that enable proactive risk management and automated policy validation.

This intelligent compliance platform integrates machine learning models and offers AI-driven GRC capabilities, streamlining operations and ensuring adherence to standards like PCI-DSS through AI for pci-dss compliance.

Request Free Sample

Regional Analysis

North America is estimated to contribute 32.6% to the growth of the global market during the forecast period.Technavio’s analysts have elaborately explained the regional trends and drivers that shape the market during the forecast period.

See How AI For Security Compliance Market Demand is Rising in North America Request Free Sample

The geographic landscape is led by North America, which accounts for 32.6% of the market's incremental growth, driven by advanced regulatory frameworks and high enterprise adoption of compliance monitoring tools.

In this region, 69% of firms now consider AI essential for cybersecurity, utilizing AI-driven threat detection for insider threat detection and automated evidence collection.

Europe is a close second, with its stringent EU AI Act mandating high standards for AI in internal controls and data loss prevention. This has accelerated the adoption of AI for data privacy and data residency management.

Both regions are pioneering the use of AI-based auditing and ai-powered audit techniques, setting global benchmarks for responsible and effective regulatory technology.

Market Dynamics

Our researchers analyzed the data with 2024 as the base year, along with the key drivers, trends, and challenges. A holistic analysis of drivers will help companies refine their marketing strategies to gain a competitive advantage.

  • Enterprises are increasingly adopting specialized AI solutions to address nuanced compliance challenges across various sectors. The use of AI for security compliance in financial services is now standard practice, with platforms focused on predictive compliance for anti-money laundering and real-time fraud detection.
  • In parallel, healthcare organizations are leveraging AI-driven policy enforcement in healthcare to protect patient data and manage regulatory adherence. A critical development is automating GDPR compliance with machine learning, which allows for dynamic consent management and data processing verification, showing efficiency gains of over 50% in audit preparation compared to manual methods.
  • The push for transparency is being met by using explainable AI for audit trail generation, which provides clear, defensible logs for regulators. In cloud-native organizations, continuous compliance monitoring for cloud environments and SaaS compliance automation for remote workforces have become essential. These systems rely on AI-powered risk scoring for cybersecurity threats to prioritize alerts and automate remediation of compliance violations.
  • The application of natural language processing for regulatory text analysis helps legal teams stay current, while identity governance and access management with AI strengthens security perimeters. Furthermore, generative AI governance for enterprise data and tools for mitigating LLM risks with AI governance tools are emerging to address new threat vectors.
  • This comprehensive approach, encompassing everything from AI-powered data classification for privacy protection to integrating threat intelligence with compliance AI, defines the modern GRC strategy.

What are the key market drivers leading to the rise in the adoption of AI For Security Compliance Industry?

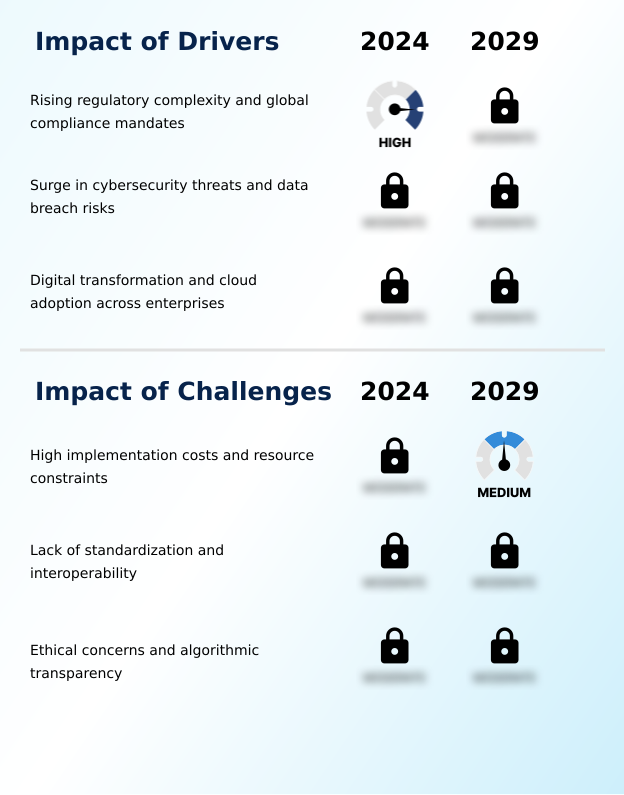
  • The market is significantly driven by the escalating complexity of regulations and the growing number of global compliance mandates.

  • Market growth is fueled by escalating regulatory complexity and a heightened threat landscape. With cybercrime increasing by over 50% in recent years, organizations are compelled to adopt AI-driven GRC frameworks for robust security incident response and proactive risk management.
  • Digital transformation is another primary catalyst, as migration to cloud platforms multiplies compliance exposure, making manual oversight untenable. AI-powered risk assessment and compliance reporting automation are essential for managing this complexity.
  • Consequently, 69% of firms now view AI as critical for maintaining their cybersecurity posture and achieving regulatory change management.
  • This has spurred demand for solutions that provide compliance as a service, featuring capabilities like regulatory text analysis and AI-based forensics, to ensure resilience and operational integrity.

What are the market trends shaping the AI For Security Compliance Industry?

  • The increasing demand for transparency in automated decision-making is a primary factor driving the rise of explainable AI (XAI). This trend is becoming critical within compliance workflows.

  • Key market trends are centered on enhancing transparency, integration, and real-time oversight. The rise of explainable AI is driven by regulatory demands for clear justifications, with over 70% of enterprises expected to require model transparency for compliance workflows. This push for algorithmic transparency and AI bias detection is reshaping product development.
  • Simultaneously, the integration of intelligent compliance platform tools with cloud security platforms is creating a unified approach to governance, enabling automated security audits and security policy automation across hybrid environments. This trend supports continuous compliance monitoring for cloud environments and AI-enhanced SIEM capabilities.
  • Firms adopting these integrated systems report up to a 50% reduction in mean time to resolution for compliance-related incidents, underscoring the shift toward proactive, embedded governance with automated compliance monitoring.

What challenges does the AI For Security Compliance Industry face during its growth?

  • Industry growth is notably constrained by high implementation costs and significant resource limitations, particularly for smaller enterprises.

  • Significant market challenges hinder widespread adoption, primarily high implementation costs and a lack of standardization. The initial investment in AI infrastructure is prohibitive for many, with fewer than 30% of small to medium-sized enterprises able to deploy advanced AI-powered systems. The fragmented ecosystem lacks interoperability, making AI model governance and cloud security posture management difficult to unify across different platforms.
  • Furthermore, ethical concerns surrounding black-box algorithms persist, as over 60% of current models lack full transparency, complicating compliance orchestration and regulatory technology integration. This opacity poses legal risks and slows trust-building, requiring a greater focus on developing standardized, ethical AI in compliance and LLM risk management solutions that are accessible to a broader market.

Exclusive Technavio Analysis on Customer Landscape

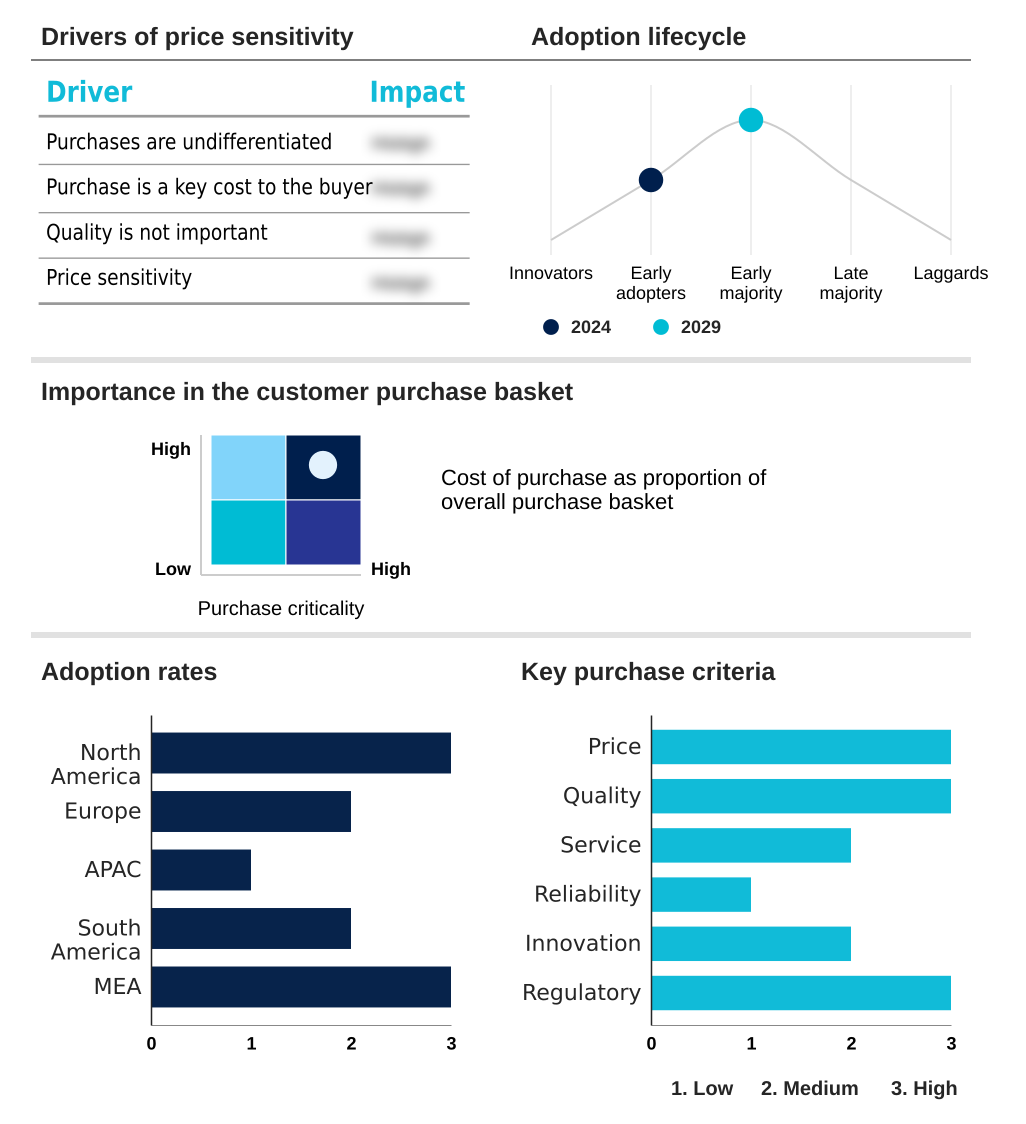
The ai for security compliance market forecasting report includes the adoption lifecycle of the market, covering from the innovator’s stage to the laggard’s stage. It focuses on adoption rates in different regions based on penetration. Furthermore, the ai for security compliance market report also includes key purchase criteria and drivers of price sensitivity to help companies evaluate and develop their market growth analysis strategies.

Customer Landscape of AI For Security Compliance Industry

Competitive Landscape

Companies are implementing various strategies, such as strategic alliances, ai for security compliance market forecast, partnerships, mergers and acquisitions, geographical expansion, and product/service launches, to enhance their presence in the industry.

Amazon Web Services Inc. - Offerings include AI-driven solutions for advanced threat detection and streamlined compliance orchestration, enhancing security posture across enterprise environments.

The industry research and growth report includes detailed analyses of the competitive landscape of the market and information about key companies, including:

  • Amazon Web Services Inc.
  • Arctic Wolf Networks Inc.
  • S.C. BITDEFENDER S.R.L.
  • Check Point Software Tech Ltd.
  • Cisco Systems Inc.
  • CrowdStrike Inc.
  • CyberArk Software Ltd.
  • Fortinet Inc.
  • Google LLC
  • IBM Corp.
  • Microsoft Corp.
  • Okta Inc.
  • Palo Alto Networks Inc.
  • Qualys Inc.
  • Sentinelone Inc.
  • Trend Micro Inc.
  • Trust Arc Inc.
  • Zscaler Inc.

Qualitative and quantitative analysis of companies has been conducted to help clients understand the wider business environment as well as the strengths and weaknesses of key industry players. Data is qualitatively analyzed to categorize companies as pure play, category-focused, industry-focused, and diversified; it is quantitatively analyzed to categorize companies as dominant, leading, strong, tentative, and weak.

Recent Development and News in Ai for security compliance market

  • In August 2024, Atos and Ooredoo launched an AI-powered cybersecurity framework designed for Qatar's TASMU Smart City initiative, integrating intelligent threat detection and compliance analytics.
  • In February 2025, Banorte initiated an AI-powered compliance engine to monitor financial transactions, using deep learning to detect behavioral anomalies aligned with anti-money laundering standards.
  • In April 2025, MedStack introduced an AI-powered audit engine for healthcare providers, which cross-references patient data with privacy regulations in real-time to improve compliance accuracy.
  • In July 2025, Lleverage launched a compliance orchestration platform incorporating risk scoring and data lineage tracking, tailored to meet both GDPR and EU AI Act requirements for fintech firms.

Dive into Technavio’s robust research methodology, blending expert interviews, extensive data synthesis, and validated models for unparalleled AI For Security Compliance Market insights. See full methodology.

Market Scope
Page number 283
Base year 2024
Forecast period 2025-2029
Growth momentum & CAGR Accelerate at a CAGR of 17.1%
Market growth 2025-2029 USD 6127.3 million
Market structure Fragmented
YoY growth 2024-2025(%) 15.5%
Key countries US, Canada, Mexico, Germany, UK, France, Italy, The Netherlands, Spain, Japan, South Korea, China, India, Australia, Indonesia, Brazil, Argentina, Colombia, Saudi Arabia, UAE, South Africa, Israel and Turkey
Competitive landscape Leading Companies, Market Positioning of Companies, Competitive Strategies, and Industry Risks

Request Free Sample

Research Analyst Overview

  • The market has reached a critical inflection point where AI is no longer a peripheral tool but the core engine of modern governance, risk, and compliance frameworks. Boardroom decisions are now centered on deploying systems that offer not just compliance automation but also strategic foresight through predictive compliance analytics.
  • The integration of natural language processing for regulatory mapping and machine learning models for anomaly detection has become standard. Advanced capabilities like generative AI governance, AI security posture management, and automated remediation are defining competitive differentiation.
  • We are seeing a decisive shift toward platforms offering continuous compliance and a robust risk scoring engine, enabling organizations to move from a reactive to a proactive stance. These systems facilitate real-time control validation and vulnerability management. Explainable AI is now a key purchasing criterion, as organizations must justify automated decisions to auditors and regulators.
  • Systems that embed a zero-trust architecture and strong data sovereignty controls are gaining traction, with some firms reporting a 40% reduction in false-positive alerts, directly improving security operations efficiency. This evolution underscores a strategic pivot toward holistic, AI-driven resilience.

What are the Key Data Covered in this AI For Security Compliance Market Research and Growth Report?

  • What is the expected growth of the AI For Security Compliance Market between 2025 and 2029?

    • USD 6.13 billion, at a CAGR of 17.1%

  • What segmentation does the market report cover?

    • The report is segmented by Component (Solution, Services), Business Segment (Large enterprises, Small and medium enterprises), End-user (BFSI, Government and public utilities, IT and telecom, Healthcare, Others) and Geography (North America, Europe, APAC, South America, Middle East and Africa)

  • Which regions are analyzed in the report?

    • North America, Europe, APAC, South America and Middle East and Africa

  • What are the key growth drivers and market challenges?

    • Rising regulatory complexity and global compliance mandates, High implementation costs and resource constraints

  • Who are the major players in the AI For Security Compliance Market?

    • Amazon Web Services Inc., Arctic Wolf Networks Inc., S.C. BITDEFENDER S.R.L., Check Point Software Tech Ltd., Cisco Systems Inc., CrowdStrike Inc., CyberArk Software Ltd., Fortinet Inc., Google LLC, IBM Corp., Microsoft Corp., Okta Inc., Palo Alto Networks Inc., Qualys Inc., Sentinelone Inc., Trend Micro Inc., Trust Arc Inc. and Zscaler Inc.

Market Research Insights

  • The market is defined by a shift toward proactive, intelligent compliance frameworks. Enterprises are adopting AI in regulatory technology to automate complex processes, with firms leveraging AI for data privacy seeing up to a 60% improvement in response times to data subject requests.
  • The integration of AI for financial compliance is critical, where AI-enhanced SIEM systems and AI-based forensics are reducing investigation times by more than 40%. The demand for algorithmic transparency and AI bias detection is shaping vendor offerings, pushing for more ethical AI in compliance.
  • As organizations adopt cloud compliance automation and DevSecOps integration, the focus on digital risk protection and AI model governance is intensifying, establishing a new standard for operational resilience.

We can help! Our analysts can customize this ai for security compliance market research report to meet your requirements.

Get in touch

1. Executive Summary

1.1 Market overview

Executive Summary - Chart on Market Overview
Executive Summary - Data Table on Market Overview
Executive Summary - Chart on Global Market Characteristics
Executive Summary - Chart on Market by Geography
Executive Summary - Chart on Market Segmentation by Component
Executive Summary - Chart on Market Segmentation by Business Segment
Executive Summary - Chart on Market Segmentation by End-user
Executive Summary - Chart on Incremental Growth
Executive Summary - Data Table on Incremental Growth
Executive Summary - Chart on Company Market Positioning

2. Technavio Analysis

2.1 Analysis of price sensitivity, lifecycle, customer purchase basket, adoption rates, and purchase criteria

2.2 Criticality of inputs and Factors of differentiation

Chart on Overview on criticality of inputs and factors of differentiation

2.3 Factors of disruption

Chart on Overview on factors of disruption

2.4 Impact of drivers and challenges

Chart on Impact of drivers and challenges in 2024 and 2029

3. Market Landscape

3.1 Market ecosystem

Chart on Parent Market
Data Table on - Parent Market

3.2 Market characteristics

Chart on Market characteristics analysis

3.3 Value chain analysis

Chart on Value chain analysis

4. Market Sizing

4.1 Market definition

Data Table on Offerings of companies included in the market definition

4.2 Market segment analysis

Market segments

4.3 Market size 2024

4.4 Market outlook: Forecast for 2024-2029

Chart on Global - Market size and forecast 2024-2029 ($ million)
Data Table on Global - Market size and forecast 2024-2029 ($ million)
Chart on Global Market: Year-over-year growth 2024-2029 (%)
Data Table on Global Market: Year-over-year growth 2024-2029 (%)

5. Five Forces Analysis

5.1 Five forces summary

Five forces analysis - Comparison between 2024 and 2029

5.2 Bargaining power of buyers

Bargaining power of buyers - Impact of key factors 2024 and 2029

5.3 Bargaining power of suppliers

Bargaining power of suppliers - Impact of key factors in 2024 and 2029

5.4 Threat of new entrants

Threat of new entrants - Impact of key factors in 2024 and 2029

5.5 Threat of substitutes

Threat of substitutes - Impact of key factors in 2024 and 2029

5.6 Threat of rivalry

Threat of rivalry - Impact of key factors in 2024 and 2029

5.7 Market condition

Chart on Market condition - Five forces 2024 and 2029

6. Market Segmentation by Component

6.1 Market segments

Chart on Component - Market share 2024-2029 (%)
Data Table on Component - Market share 2024-2029 (%)

6.2 Comparison by Component

Chart on Comparison by Component
Data Table on Comparison by Component

6.3 Solution - Market size and forecast 2024-2029

Chart on Solution - Market size and forecast 2024-2029 ($ million)
Data Table on Solution - Market size and forecast 2024-2029 ($ million)
Chart on Solution - Year-over-year growth 2024-2029 (%)
Data Table on Solution - Year-over-year growth 2024-2029 (%)

6.4 Services - Market size and forecast 2024-2029

Chart on Services - Market size and forecast 2024-2029 ($ million)
Data Table on Services - Market size and forecast 2024-2029 ($ million)
Chart on Services - Year-over-year growth 2024-2029 (%)
Data Table on Services - Year-over-year growth 2024-2029 (%)

6.5 Market opportunity by Component

Market opportunity by Component ($ million)
Data Table on Market opportunity by Component ($ million)

7. Market Segmentation by Business Segment

7.1 Market segments

Chart on Market Segmentation by Business Segment - Market share 2024-2029 (%)
Data Table on Market Segmentation by Business Segment - Market share 2024-2029 (%)

7.2 Comparison by Market Segmentation by Business Segment

Chart on Comparison by Market Segmentation by Business Segment
Data Table on Comparison by Market Segmentation by Business Segment

7.3 Large enterprises - Market size and forecast 2024-2029

Chart on Large enterprises - Market size and forecast 2024-2029 ($ million)
Data Table on Large enterprises - Market size and forecast 2024-2029 ($ million)
Chart on Large enterprises - Year-over-year growth 2024-2029 (%)
Data Table on Large enterprises - Year-over-year growth 2024-2029 (%)

7.4 Small and medium enterprises - Market size and forecast 2024-2029

Chart on Small and medium enterprises - Market size and forecast 2024-2029 ($ million)
Data Table on Small and medium enterprises - Market size and forecast 2024-2029 ($ million)
Chart on Small and medium enterprises - Year-over-year growth 2024-2029 (%)
Data Table on Small and medium enterprises - Year-over-year growth 2024-2029 (%)

7.5 Market opportunity by Market Segmentation by Business Segment

Market opportunity by Market Segmentation by Business Segment ($ million)
Data Table on Market opportunity by Market Segmentation by Business Segment ($ million)

8. Market Segmentation by End-user

8.1 Market segments

Chart on End-user - Market share 2024-2029 (%)
Data Table on End-user - Market share 2024-2029 (%)

8.2 Comparison by End-user

Chart on Comparison by End-user
Data Table on Comparison by End-user

8.3 BFSI - Market size and forecast 2024-2029

Chart on BFSI - Market size and forecast 2024-2029 ($ million)
Data Table on BFSI - Market size and forecast 2024-2029 ($ million)
Chart on BFSI - Year-over-year growth 2024-2029 (%)
Data Table on BFSI - Year-over-year growth 2024-2029 (%)

8.4 Government and public utilities - Market size and forecast 2024-2029

Chart on Government and public utilities - Market size and forecast 2024-2029 ($ million)
Data Table on Government and public utilities - Market size and forecast 2024-2029 ($ million)
Chart on Government and public utilities - Year-over-year growth 2024-2029 (%)
Data Table on Government and public utilities - Year-over-year growth 2024-2029 (%)

8.5 IT and telecom - Market size and forecast 2024-2029

Chart on IT and telecom - Market size and forecast 2024-2029 ($ million)
Data Table on IT and telecom - Market size and forecast 2024-2029 ($ million)
Chart on IT and telecom - Year-over-year growth 2024-2029 (%)
Data Table on IT and telecom - Year-over-year growth 2024-2029 (%)

8.6 Healthcare - Market size and forecast 2024-2029

Chart on Healthcare - Market size and forecast 2024-2029 ($ million)
Data Table on Healthcare - Market size and forecast 2024-2029 ($ million)
Chart on Healthcare - Year-over-year growth 2024-2029 (%)
Data Table on Healthcare - Year-over-year growth 2024-2029 (%)

8.7 Others - Market size and forecast 2024-2029

Chart on Others - Market size and forecast 2024-2029 ($ million)
Data Table on Others - Market size and forecast 2024-2029 ($ million)
Chart on Others - Year-over-year growth 2024-2029 (%)
Data Table on Others - Year-over-year growth 2024-2029 (%)

8.8 Market opportunity by End-user

Market opportunity by End-user ($ million)
Data Table on Market opportunity by End-user ($ million)

9. Customer Landscape

9.1 Customer landscape overview

Analysis of price sensitivity, lifecycle, customer purchase basket, adoption rates, and purchase criteria

10. Geographic Landscape

10.1 Geographic segmentation

Chart on Market share by geography 2024-2029 (%)
Data Table on Market share by geography 2024-2029 (%)

10.2 Geographic comparison

Chart on Geographic comparison
Data Table on Geographic comparison

10.3 North America - Market size and forecast 2024-2029

Chart on North America - Market size and forecast 2024-2029 ($ million)
Data Table on North America - Market size and forecast 2024-2029 ($ million)
Chart on North America - Year-over-year growth 2024-2029 (%)
Data Table on North America - Year-over-year growth 2024-2029 (%)
Chart on Regional Comparison - North America
Data Table on Regional Comparison - North America

10.3.1 US - Market size and forecast 2024-2029

Chart on US - Market size and forecast 2024-2029 ($ million)
Data Table on US - Market size and forecast 2024-2029 ($ million)
Chart on US - Year-over-year growth 2024-2029 (%)
Data Table on US - Year-over-year growth 2024-2029 (%)

10.3.2 Canada - Market size and forecast 2024-2029

Chart on Canada - Market size and forecast 2024-2029 ($ million)
Data Table on Canada - Market size and forecast 2024-2029 ($ million)
Chart on Canada - Year-over-year growth 2024-2029 (%)
Data Table on Canada - Year-over-year growth 2024-2029 (%)

10.3.3 Mexico - Market size and forecast 2024-2029

Chart on Mexico - Market size and forecast 2024-2029 ($ million)
Data Table on Mexico - Market size and forecast 2024-2029 ($ million)
Chart on Mexico - Year-over-year growth 2024-2029 (%)
Data Table on Mexico - Year-over-year growth 2024-2029 (%)

10.4 Europe - Market size and forecast 2024-2029

Chart on Europe - Market size and forecast 2024-2029 ($ million)
Data Table on Europe - Market size and forecast 2024-2029 ($ million)
Chart on Europe - Year-over-year growth 2024-2029 (%)
Data Table on Europe - Year-over-year growth 2024-2029 (%)
Chart on Regional Comparison - Europe
Data Table on Regional Comparison - Europe

10.4.1 Germany - Market size and forecast 2024-2029

Chart on Germany - Market size and forecast 2024-2029 ($ million)
Data Table on Germany - Market size and forecast 2024-2029 ($ million)
Chart on Germany - Year-over-year growth 2024-2029 (%)
Data Table on Germany - Year-over-year growth 2024-2029 (%)

10.4.2 UK - Market size and forecast 2024-2029

Chart on UK - Market size and forecast 2024-2029 ($ million)
Data Table on UK - Market size and forecast 2024-2029 ($ million)
Chart on UK - Year-over-year growth 2024-2029 (%)
Data Table on UK - Year-over-year growth 2024-2029 (%)

10.4.3 France - Market size and forecast 2024-2029

Chart on France - Market size and forecast 2024-2029 ($ million)
Data Table on France - Market size and forecast 2024-2029 ($ million)
Chart on France - Year-over-year growth 2024-2029 (%)
Data Table on France - Year-over-year growth 2024-2029 (%)

10.4.4 Italy - Market size and forecast 2024-2029

Chart on Italy - Market size and forecast 2024-2029 ($ million)
Data Table on Italy - Market size and forecast 2024-2029 ($ million)
Chart on Italy - Year-over-year growth 2024-2029 (%)
Data Table on Italy - Year-over-year growth 2024-2029 (%)

10.4.5 The Netherlands - Market size and forecast 2024-2029

Chart on The Netherlands - Market size and forecast 2024-2029 ($ million)
Data Table on The Netherlands - Market size and forecast 2024-2029 ($ million)
Chart on The Netherlands - Year-over-year growth 2024-2029 (%)
Data Table on The Netherlands - Year-over-year growth 2024-2029 (%)

10.4.6 Spain - Market size and forecast 2024-2029

Chart on Spain - Market size and forecast 2024-2029 ($ million)
Data Table on Spain - Market size and forecast 2024-2029 ($ million)
Chart on Spain - Year-over-year growth 2024-2029 (%)
Data Table on Spain - Year-over-year growth 2024-2029 (%)

10.5 APAC - Market size and forecast 2024-2029

Chart on APAC - Market size and forecast 2024-2029 ($ million)
Data Table on APAC - Market size and forecast 2024-2029 ($ million)
Chart on APAC - Year-over-year growth 2024-2029 (%)
Data Table on APAC - Year-over-year growth 2024-2029 (%)
Chart on Regional Comparison - APAC
Data Table on Regional Comparison - APAC

10.5.1 Japan - Market size and forecast 2024-2029

Chart on Japan - Market size and forecast 2024-2029 ($ million)
Data Table on Japan - Market size and forecast 2024-2029 ($ million)
Chart on Japan - Year-over-year growth 2024-2029 (%)
Data Table on Japan - Year-over-year growth 2024-2029 (%)

10.5.2 South Korea - Market size and forecast 2024-2029

Chart on South Korea - Market size and forecast 2024-2029 ($ million)
Data Table on South Korea - Market size and forecast 2024-2029 ($ million)
Chart on South Korea - Year-over-year growth 2024-2029 (%)
Data Table on South Korea - Year-over-year growth 2024-2029 (%)

10.5.3 China - Market size and forecast 2024-2029

Chart on China - Market size and forecast 2024-2029 ($ million)
Data Table on China - Market size and forecast 2024-2029 ($ million)
Chart on China - Year-over-year growth 2024-2029 (%)
Data Table on China - Year-over-year growth 2024-2029 (%)

10.5.4 India - Market size and forecast 2024-2029

Chart on India - Market size and forecast 2024-2029 ($ million)
Data Table on India - Market size and forecast 2024-2029 ($ million)
Chart on India - Year-over-year growth 2024-2029 (%)
Data Table on India - Year-over-year growth 2024-2029 (%)

10.5.5 Australia - Market size and forecast 2024-2029

Chart on Australia - Market size and forecast 2024-2029 ($ million)
Data Table on Australia - Market size and forecast 2024-2029 ($ million)
Chart on Australia - Year-over-year growth 2024-2029 (%)
Data Table on Australia - Year-over-year growth 2024-2029 (%)

10.5.6 Indonesia - Market size and forecast 2024-2029

Chart on Indonesia - Market size and forecast 2024-2029 ($ million)
Data Table on Indonesia - Market size and forecast 2024-2029 ($ million)
Chart on Indonesia - Year-over-year growth 2024-2029 (%)
Data Table on Indonesia - Year-over-year growth 2024-2029 (%)

10.6 South America - Market size and forecast 2024-2029

Chart on South America - Market size and forecast 2024-2029 ($ million)
Data Table on South America - Market size and forecast 2024-2029 ($ million)
Chart on South America - Year-over-year growth 2024-2029 (%)
Data Table on South America - Year-over-year growth 2024-2029 (%)
Chart on Regional Comparison - South America
Data Table on Regional Comparison - South America

10.6.1 Brazil - Market size and forecast 2024-2029

Chart on Brazil - Market size and forecast 2024-2029 ($ million)
Data Table on Brazil - Market size and forecast 2024-2029 ($ million)
Chart on Brazil - Year-over-year growth 2024-2029 (%)
Data Table on Brazil - Year-over-year growth 2024-2029 (%)

10.6.2 Argentina - Market size and forecast 2024-2029

Chart on Argentina - Market size and forecast 2024-2029 ($ million)
Data Table on Argentina - Market size and forecast 2024-2029 ($ million)
Chart on Argentina - Year-over-year growth 2024-2029 (%)
Data Table on Argentina - Year-over-year growth 2024-2029 (%)

10.6.3 Colombia - Market size and forecast 2024-2029

Chart on Colombia - Market size and forecast 2024-2029 ($ million)
Data Table on Colombia - Market size and forecast 2024-2029 ($ million)
Chart on Colombia - Year-over-year growth 2024-2029 (%)
Data Table on Colombia - Year-over-year growth 2024-2029 (%)

10.7 Middle East and Africa - Market size and forecast 2024-2029

Chart on Middle East and Africa - Market size and forecast 2024-2029 ($ million)
Data Table on Middle East and Africa - Market size and forecast 2024-2029 ($ million)
Chart on Middle East and Africa - Year-over-year growth 2024-2029 (%)
Data Table on Middle East and Africa - Year-over-year growth 2024-2029 (%)
Chart on Regional Comparison - Middle East and Africa
Data Table on Regional Comparison - Middle East and Africa

10.7.1 Saudi Arabia - Market size and forecast 2024-2029

Chart on Saudi Arabia - Market size and forecast 2024-2029 ($ million)
Data Table on Saudi Arabia - Market size and forecast 2024-2029 ($ million)
Chart on Saudi Arabia - Year-over-year growth 2024-2029 (%)
Data Table on Saudi Arabia - Year-over-year growth 2024-2029 (%)

10.7.2 UAE - Market size and forecast 2024-2029

Chart on UAE - Market size and forecast 2024-2029 ($ million)
Data Table on UAE - Market size and forecast 2024-2029 ($ million)
Chart on UAE - Year-over-year growth 2024-2029 (%)
Data Table on UAE - Year-over-year growth 2024-2029 (%)

10.7.3 South Africa - Market size and forecast 2024-2029

Chart on South Africa - Market size and forecast 2024-2029 ($ million)
Data Table on South Africa - Market size and forecast 2024-2029 ($ million)
Chart on South Africa - Year-over-year growth 2024-2029 (%)
Data Table on South Africa - Year-over-year growth 2024-2029 (%)

10.7.4 Israel - Market size and forecast 2024-2029

Chart on Israel - Market size and forecast 2024-2029 ($ million)
Data Table on Israel - Market size and forecast 2024-2029 ($ million)
Chart on Israel - Year-over-year growth 2024-2029 (%)
Data Table on Israel - Year-over-year growth 2024-2029 (%)

10.7.5 Turkey - Market size and forecast 2024-2029

Chart on Turkey - Market size and forecast 2024-2029 ($ million)
Data Table on Turkey - Market size and forecast 2024-2029 ($ million)
Chart on Turkey - Year-over-year growth 2024-2029 (%)
Data Table on Turkey - Year-over-year growth 2024-2029 (%)

10.8 Market opportunity by geography

Market opportunity by geography ($ million)
Data Tables on Market opportunity by geography ($ million)

11. Drivers, Challenges, and Opportunity

11.1 Market drivers

Rising regulatory complexity and global compliance mandates
Surge in cybersecurity threats and data breach risks
Digital transformation and cloud adoption across enterprises

11.2 Market challenges

High implementation costs and resource constraints
Lack of standardization and interoperability
Ethical concerns and algorithmic transparency

11.3 Impact of drivers and challenges

Impact of drivers and challenges in 2024 and 2029

11.4 Market opportunities

Rise of explainable AI (XAI) in compliance workflows
Integration of AI compliance tools with cloud security platforms
Adoption of AI-powered continuous compliance and risk scoring

12. Competitive Landscape

12.1 Overview

12.2

Overview on criticality of inputs and factors of differentiation

12.3 Landscape disruption

Overview on factors of disruption

12.4 Industry risks

Impact of key risks on business

13. Competitive Analysis

13.1 Companies profiled

Companies covered

13.2 Company ranking index

13.3 Market positioning of companies

Matrix on companies position and classification

13.4 Amazon Web Services Inc.

Amazon Web Services Inc. - Overview
Amazon Web Services Inc. - Product / Service
Amazon Web Services Inc. - Key news
Amazon Web Services Inc. - Key offerings
SWOT

13.5 Arctic Wolf Networks Inc.

Arctic Wolf Networks Inc. - Overview
Arctic Wolf Networks Inc. - Product / Service
Arctic Wolf Networks Inc. - Key offerings
SWOT

13.6 Check Point Software Tech Ltd.

Check Point Software Tech Ltd. - Overview
Check Point Software Tech Ltd. - Product / Service
Check Point Software Tech Ltd. - Key news
Check Point Software Tech Ltd. - Key offerings
SWOT

13.7 Cisco Systems Inc.

Cisco Systems Inc. - Overview
Cisco Systems Inc. - Business segments
Cisco Systems Inc. - Key news
Cisco Systems Inc. - Key offerings
Cisco Systems Inc. - Segment focus
SWOT

13.8 CrowdStrike Inc.

CrowdStrike Inc. - Overview
CrowdStrike Inc. - Product / Service
CrowdStrike Inc. - Key offerings
SWOT

13.9 Fortinet Inc.

Fortinet Inc. - Overview
Fortinet Inc. - Product / Service
Fortinet Inc. - Key news
Fortinet Inc. - Key offerings
SWOT

13.10 Google LLC

Google LLC - Overview
Google LLC - Product / Service
Google LLC - Key offerings
SWOT

13.11 IBM Corp.

IBM Corp. - Overview
IBM Corp. - Business segments
IBM Corp. - Key news
IBM Corp. - Key offerings
IBM Corp. - Segment focus
SWOT

13.12 Microsoft Corp.

Microsoft Corp. - Overview
Microsoft Corp. - Business segments
Microsoft Corp. - Key news
Microsoft Corp. - Key offerings
Microsoft Corp. - Segment focus
SWOT

13.13 Okta Inc.

Okta Inc. - Overview
Okta Inc. - Product / Service
Okta Inc. - Key news
Okta Inc. - Key offerings
SWOT

13.14 Palo Alto Networks Inc.

Palo Alto Networks Inc. - Overview
Palo Alto Networks Inc. - Product / Service
Palo Alto Networks Inc. - Key news
Palo Alto Networks Inc. - Key offerings
SWOT

13.15 Sentinelone Inc.

Sentinelone Inc. - Overview
Sentinelone Inc. - Product / Service
Sentinelone Inc. - Key offerings
SWOT

13.16 Trend Micro Inc.

Trend Micro Inc. - Overview
Trend Micro Inc. - Product / Service
Trend Micro Inc. - Key offerings
SWOT

13.17 Trust Arc Inc.

Trust Arc Inc. - Overview
Trust Arc Inc. - Product / Service
Trust Arc Inc. - Key offerings
SWOT

13.18 Zscaler Inc.

Zscaler Inc. - Overview
Zscaler Inc. - Product / Service
Zscaler Inc. - Key offerings
SWOT

14. Appendix

14.1 Scope of the report

Market definition
Objectives
Notes and caveats

14.2 Inclusions and exclusions checklist

Inclusions checklist
Exclusions checklist

14.3 Currency conversion rates for US$

14.4 Research methodology

14.5 Data procurement

Information sources

14.6 Data validation

14.7 Validation techniques employed for market sizing

14.8 Data synthesis

14.9 360 degree market analysis

14.10 List of abbreviations

Research Methodology

Technavio presents a detailed picture of the market by way of study, synthesis, and summation of data from multiple sources. The analysts have presented the various facets of the market with a particular focus on identifying the key industry influencers. The data thus presented is comprehensive, reliable, and the result of extensive research, both primary and secondary.

INFORMATION SOURCES

Primary sources

  • Manufacturers and suppliers
  • Channel partners
  • Industry experts
  • Strategic decision makers

Secondary sources

  • Industry journals and periodicals
  • Government data
  • Financial reports of key industry players
  • Historical data
  • Press releases

DATA ANALYSIS

Data Synthesis

  • Collation of data
  • Estimation of key figures
  • Analysis of derived insights

Data Validation

  • Triangulation with data models
  • Reference against proprietary databases
  • Corroboration with industry experts

REPORT WRITING

Qualitative

  • Market drivers
  • Market challenges
  • Market trends
  • Five forces analysis

Quantitative

  • Market size and forecast
  • Market segmentation
  • Geographical insights
  • Competitive landscape

Interested in this report?

Get your sample now to see our research methodology and insights!

Download Now

Frequently Asked Questions

AI For Security Compliance market growth will increase by USD 6127.3 million during 2025-2029 .

The AI For Security Compliance market is expected to grow at a CAGR of 17.1% during 2025-2029 .

AI For Security Compliance market is segmented by Component (Solution, Services) Business segment (Large enterprises, Small and medium enterprises) End-user (BFSI, Government and public utilities, IT and telecom, Healthcare, Others)

Amazon Web Services Inc., Arctic Wolf Networks Inc., S.C. BITDEFENDER S.R.L., Check Point Software Tech Ltd., Cisco Systems Inc., CrowdStrike Inc., CyberArk Software Ltd., Fortinet Inc., Google LLC, IBM Corp., Microsoft Corp., Okta Inc., Palo Alto Networks Inc., Qualys Inc., Sentinelone Inc., Trend Micro Inc., Trust Arc Inc., Zscaler Inc. are a few of the key vendors in the AI For Security Compliance market.

North America will register the highest growth rate of 32.6% among the other regions. Therefore, the AI For Security Compliance market in North America is expected to garner significant business opportunities for the vendors during the forecast period.

US, Canada, Mexico, Germany, UK, France, Italy, The Netherlands, Spain, Japan, South Korea, China, India, Australia, Indonesia, Brazil, Argentina, Colombia, Saudi Arabia, UAE, South Africa, Israel, Turkey

  • Rising regulatory complexity and global compliance mandates is the driving factor this market.

The AI For Security Compliance market vendors should focus on grabbing business opportunities from the Component segment as it accounted for the largest market share in the base year.