AI In Animal Health Market Size 2025-2029
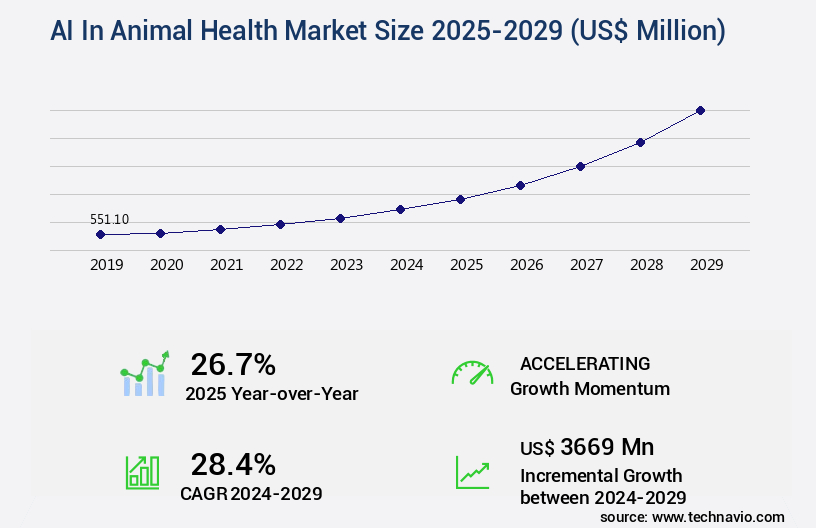
The AI in animal health market size is valued to increase by USD 3.67 billion, at a CAGR of 28.4% from 2024 to 2029. Imperative for precision livestock farming and enhanced food security will drive the ai in animal health market.
Major Market Trends & Insights
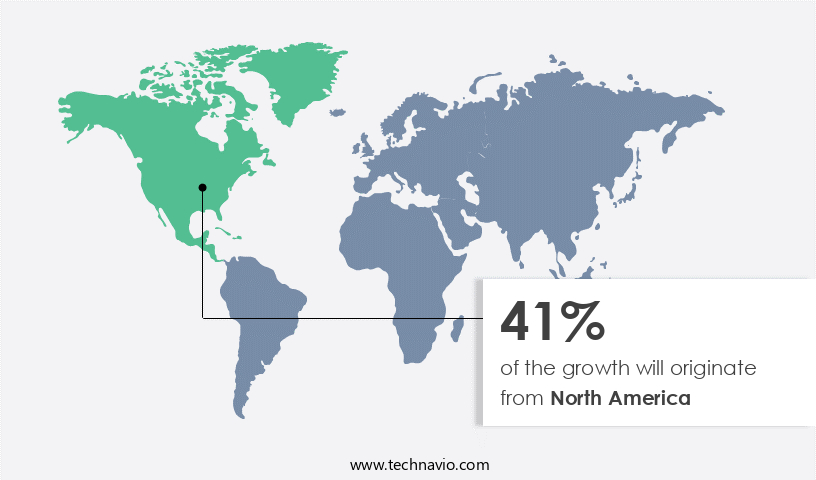
- North America dominated the market and accounted for a 41% growth during the forecast period.
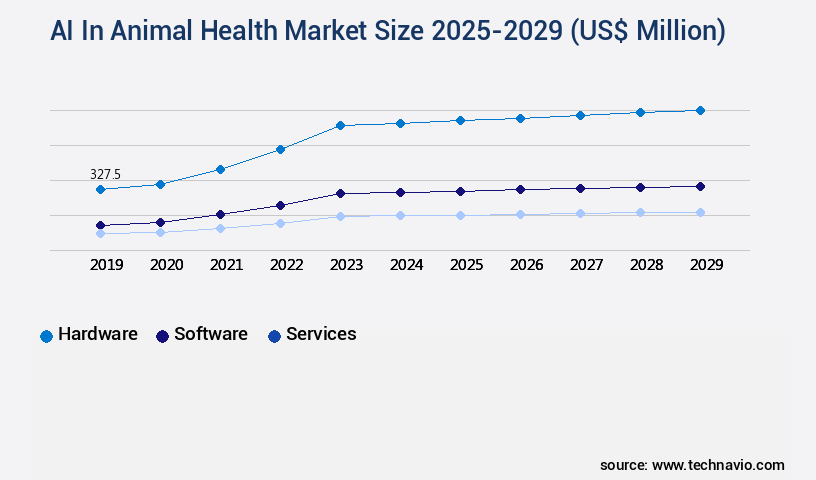
- By Component - Hardware segment was valued at USD 327.50 billion in 2023
- By Type - Companion animals segment accounted for the largest market revenue share in 2023
Market Size & Forecast
- Market Opportunities: USD 833.21 million
- Market Future Opportunities: USD 3669.00 million
- CAGR from 2024 to 2029 : 28.4%
Market Summary
- In the realm of animal health, Artificial Intelligence (AI) is making significant strides, particularly in precision livestock farming and veterinary diagnostic imaging. The global animal health AI market is projected to reach a value of USD1.5 billion by 2026, underscoring its growing importance. This growth is driven by the need for enhanced food security and improved animal welfare. In veterinary medicine, AI is revolutionizing diagnostic imaging, enabling faster and more accurate diagnoses. However, challenges persist, including data scarcity, quality, and standardization issues.
- To address these concerns, AI algorithms are being developed to learn from existing data and improve diagnostic accuracy. Furthermore, clinical decision support systems are being integrated into veterinary practices, aiding in the early detection and prevention of diseases. As AI continues to evolve, it will play a pivotal role in optimizing animal health and productivity, ultimately benefiting farmers, veterinarians, and consumers alike.
What will be the Size of the AI In Animal Health Market during the forecast period?
Get Key Insights on Market Forecast (PDF) Request Free Sample
How is the AI In Animal Health Market Segmented ?
The AI in animal health industry research report provides comprehensive data (region-wise segment analysis), with forecasts and estimates in "USD million" for the period 2025-2029, as well as historical data from 2019-2023 for the following segments.
- Component
- Hardware
- Software
- Services
- Type
- Companion animals
- Production animals
- Application
- Diagnostics
- Identification tracking and monitoring
- Others
- Geography
- North America
- US
- Canada
- Europe
- France
- Germany
- UK
- APAC
- China
- India
- Japan
- South Korea
- South America
- Brazil
- Rest of World (ROW)
- North America
By Component Insights
The hardware segment is estimated to witness significant growth during the forecast period.
The market continues to evolve, integrating advanced technologies such as machine learning algorithms and deep learning applications to revolutionize livestock health surveillance and diagnostic testing. Data analytics dashboards enable farmers to monitor individual animal health in real-time, with sensor-based animal tracking and natural language processing providing valuable insights into livestock behavior and welfare assessment. AI-powered veterinary tools, including precision livestock farming and automated farm management software, improve farm efficiency and reduce medication usage through predictive veterinary analytics and reproductive management tools. Moreover, veterinary telehealth platforms facilitate remote animal monitoring, while computer vision systems enable early disease detection and enhanced animal productivity.
According to a recent study, the use of AI in animal health has led to a 20% reduction in medication usage, highlighting its significant impact on the industry. This digital transformation also includes precision feeding strategies, treatment optimization, and automated feeding and milking systems, all driven by AI-driven treatment protocols and data-driven animal care.
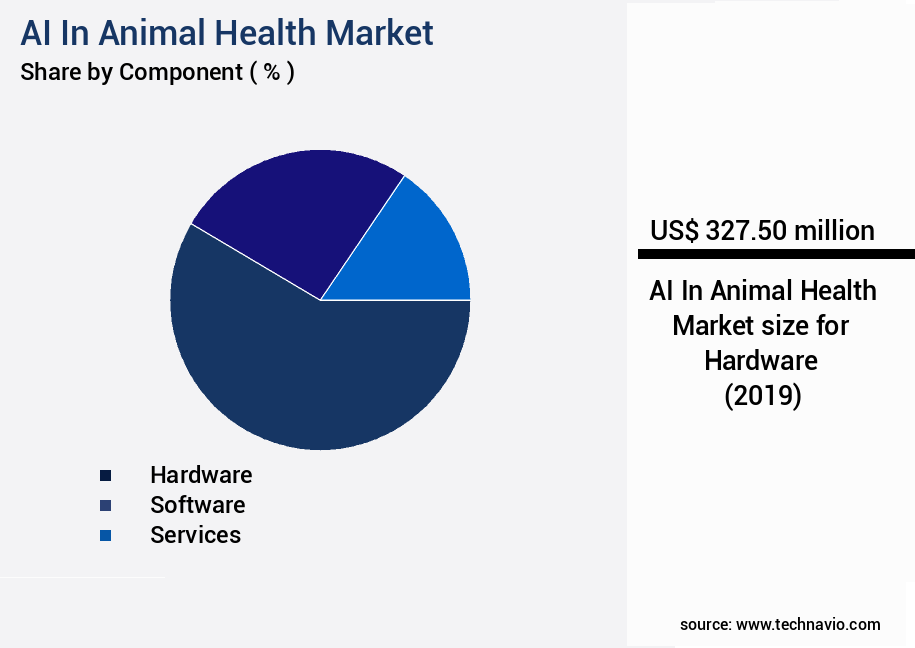
The Hardware segment was valued at USD 327.50 billion in 2019 and showed a gradual increase during the forecast period.
Regional Analysis
North America is estimated to contribute 41% to the growth of the global market during the forecast period.Technavio's analysts have elaborately explained the regional trends and drivers that shape the market during the forecast period.
See How AI In Animal Health Market Demand is Rising in North America Request Free Sample
The market is experiencing significant growth and innovation, particularly in North America, which leads the industry due to its technologically advanced livestock sector and high-value companion animal market. The region's robust demand for AI solutions is driven by factors such as increasing pet humanization trends, a large-scale livestock industry, and a thriving technology startup ecosystem. In the companion animal segment, pet owners' desire for advanced diagnostic and monitoring technologies mirrors the standard of care in human medicine. This demand is fueled by cultural shifts towards treating pets as family members, leading to a surge in the adoption of AI-driven solutions.
The North American market's size and sophistication make it an attractive hub for leading animal health corporations and startups alike. This growth is driven by the increasing adoption of AI in various applications, including animal health monitoring, disease diagnosis, and precision farming.
Market Dynamics
Our researchers analyzed the data with 2024 as the base year, along with the key drivers, trends, and challenges. A holistic analysis of drivers will help companies refine their marketing strategies to gain a competitive advantage.
The market is experiencing significant growth as farmers and veterinarians increasingly adopt advanced technologies to enhance livestock management and disease prevention. AI algorithms for livestock disease detection are revolutionizing the industry by enabling predictive modeling for animal health management. Sensor data integration for real-time monitoring allows for early warning systems for infectious disease outbreaks and automated health screening using image recognition. Machine learning applications in veterinary medicine are transforming the field, with computer vision for livestock behavior analysis and data analytics for precision livestock farming. Remote diagnostics for animal health assessment enable veterinarians to assess the health of livestock from a distance, reducing the need for physical examinations. Automated feeding systems for optimized nutrition and AI-driven protocols for disease prevention are improving animal health and productivity.
Precision breeding strategies using genomic data and improved reproduction rates through AI technologies are also gaining traction. The implementation of machine learning for livestock productivity ensures that farmers can make data-driven decisions to optimize their operations. Development of AI-driven veterinary diagnostic tools and data visualization dashboards for animal health tracking provide valuable insights for farmers and veterinarians. Deep learning is being applied to complex disease patterns to improve diagnosis and treatment, while the integration of farm data for improved decision-making is becoming essential. Reduced antibiotic use via AI-powered disease management is a significant benefit, as it promotes animal welfare and sustainability. In conclusion, The market is transforming the way farmers and veterinarians manage livestock. From disease detection and prevention to productivity optimization and precision breeding, AI technologies are enhancing animal health and welfare while promoting sustainability and reducing costs.
What are the key market drivers leading to the rise in the adoption of AI In Animal Health Industry?
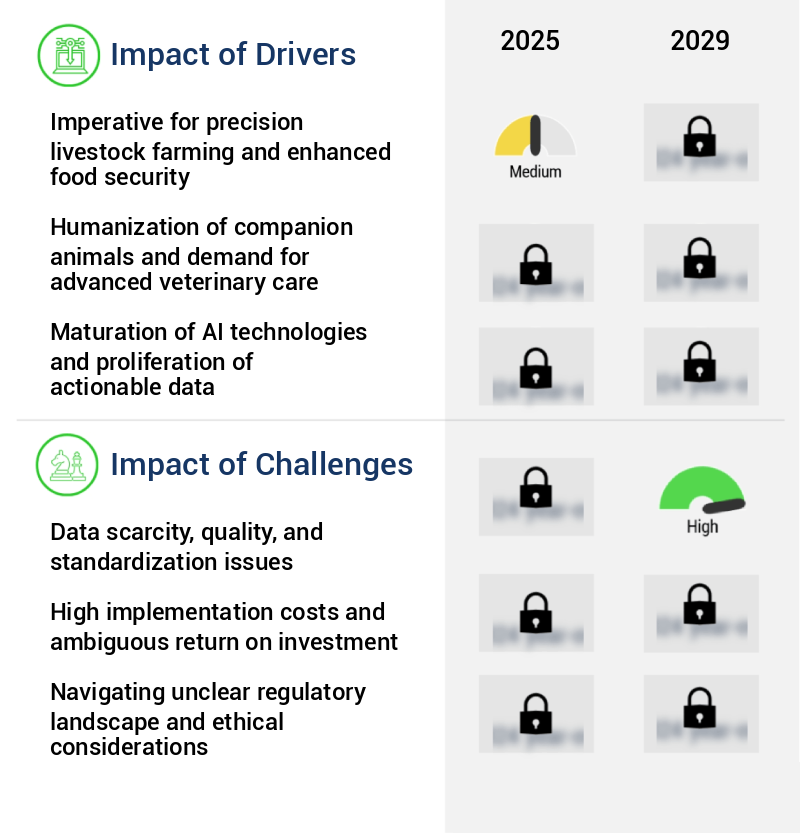
- Precision livestock farming, a crucial aspect of modern agriculture, is driven by the imperative to enhance food security and ensure professionalism in production methods. This trend is a key market driver, as the demand for efficient, sustainable, and high-quality food production continues to grow.
- The market is experiencing significant growth due to the increasing demand for more productive and sustainable agricultural practices. With a growing population and expanding consumption of animal protein, there is a pressing need to transform traditional livestock management. AI technology, specifically precision livestock farming, is becoming a crucial solution to these challenges. This approach shifts the industry from reactive herd-level interventions to proactive, individualized animal care, even on a large scale. AI systems employ various data inputs, such as computer vision for analyzing animal behavior and gait, acoustic sensors for detecting respiratory distress in poultry and swine, and biometric data from rumen boluses or ear tags for monitoring core body temperature and activity levels.
- These technological advancements enable farmers to optimize animal health and productivity while reducing environmental impact. AI's integration into animal health management is a powerful driver for the agricultural sector's transformation.
What are the market trends shaping the AI In Animal Health Industry?
- The ascendancy of artificial intelligence in veterinary diagnostic imaging and clinical decision support represents an emerging market trend. This technological advancement is poised to significantly impact the veterinary industry.
- Artificial intelligence (AI) is revolutionizing the animal health market, particularly in diagnostic imaging workflows. No longer a novelty, AI-driven analysis of radiographs, cytopathology slides, and other medical images is increasingly becoming a standard of care. This evolution is marked by the application of advanced machine learning algorithms, such as deep learning and convolutional neural networks, which are trained on extensive, curated datasets of veterinary images.
- These systems can discern subtle patterns indicative of disease that may elude the human eye, thereby boosting diagnostic precision, expediting turnaround times, and optimizing clinical efficiency. The integration of AI in veterinary medicine is a defining trend, transforming the industry and democratizing access to specialist-level expertise.
What challenges does the AI In Animal Health Industry face during its growth?
- The lack of sufficient data, coupled with issues related to data quality and standardization, poses a significant challenge to the growth of the industry.
- Artificial intelligence (AI) is revolutionizing the animal health market, offering innovative solutions across various sectors. According to recent estimates, The market is projected to expand significantly, driven by advancements in diagnostic and predictive tools. However, a fundamental challenge constraining its full potential is the issue of data availability, quality, and interoperability. AI, particularly deep learning models, is data-intensive, with performance and reliability directly linked to the volume and quality of training data. The animal health sector, however, is marked by data fragmentation and a lack of standardization.
- Unlike human healthcare, which has made strides with standards like HL7 and DICOM, the veterinary and agricultural worlds operate with a multitude of siloed systems. Despite these challenges, the integration of AI in animal health is expected to bring about substantial improvements in disease diagnosis, livestock management, and agricultural productivity.
Exclusive Technavio Analysis on Customer Landscape
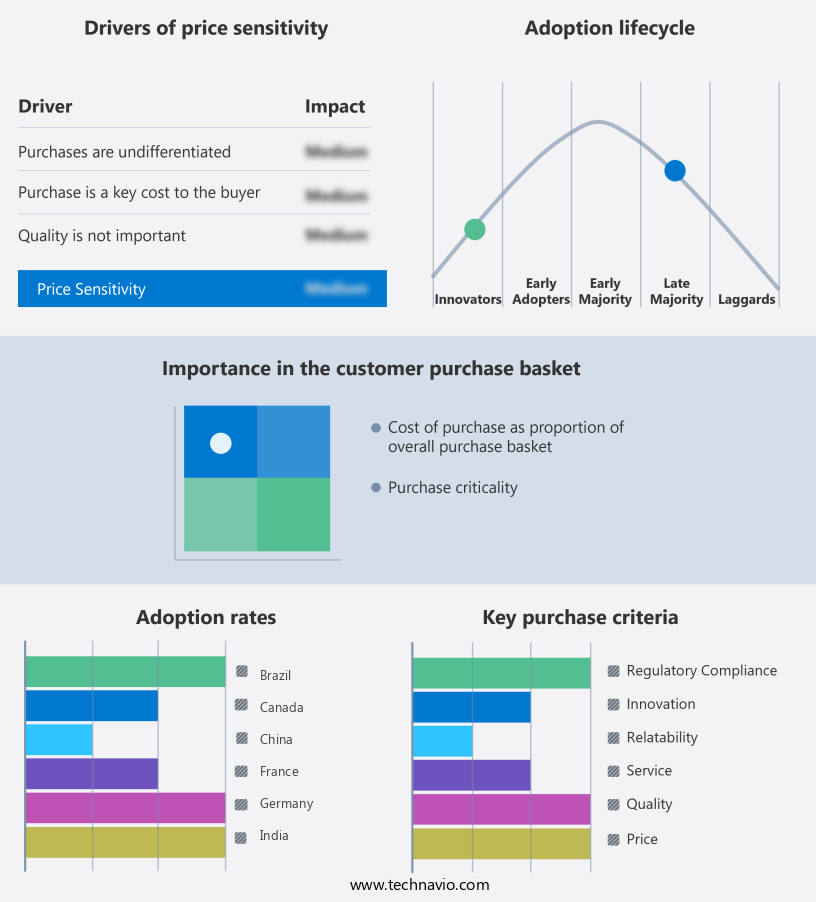
The ai in animal health market forecasting report includes the adoption lifecycle of the market, covering from the innovator's stage to the laggard's stage. It focuses on adoption rates in different regions based on penetration. Furthermore, the ai in animal health market report also includes key purchase criteria and drivers of price sensitivity to help companies evaluate and develop their market growth analysis strategies.
Customer Landscape of AI In Animal Health Industry
Competitive Landscape
Companies are implementing various strategies, such as strategic alliances, ai in animal health market forecast, partnerships, mergers and acquisitions, geographical expansion, and product/service launches, to enhance their presence in the industry.
Antech Diagnostics, Inc. - This company pioneers artificial intelligence (AI) applications in animal health, featuring AIS RapidRead for swift radiograph interpretation and Nu.Q Canine Cancer Test for early cancer detection, enhancing veterinary diagnostics and improving animal welfare.
The industry research and growth report includes detailed analyses of the competitive landscape of the market and information about key companies, including:
- Antech Diagnostics, Inc.
- Aquabyte
- Bayer AG
- Boehringer Ingelheim International GmbH
- Cargill Inc.
- Elanco Animal Health Inc.
- IDEXX Laboratories Inc.
- ImpriMed, Inc.
- Mars Inc.
- Merck and Co. Inc.
- Neogen Corp.
- OneCup AI
- PetPace
- SignalPET
- Teledyne Technologies Inc.
- Vetology LLC
- Vetoquinol SA
- Virbac SA
- Zoetis Inc.
Qualitative and quantitative analysis of companies has been conducted to help clients understand the wider business environment as well as the strengths and weaknesses of key industry players. Data is qualitatively analyzed to categorize companies as pure play, category-focused, industry-focused, and diversified; it is quantitatively analyzed to categorize companies as dominant, leading, strong, tentative, and weak.
Recent Development and News in AI In Animal Health Market
- In January 2024, Zoetis, a leading animal health company, announced the launch of its new AI-powered diagnostic tool, "Zoetis AI Dx," designed to detect bovine tuberculosis in cattle. This innovation, which received CE marking in Q4 2023, is expected to revolutionize disease diagnosis and management in the livestock industry (Zoetis Press Release, 2024).
- In March 2024, Microsoft and IBM joined forces to expand their AI offerings in the animal health sector. Their collaboration aimed to integrate IBM's Watson for Animal Health with Microsoft's Azure platform, offering advanced analytics and AI solutions to veterinary practices and animal health organizations (Microsoft News Center, 2024).
- In April 2024, Merck Animal Health, a global healthcare company, completed the acquisition of Antelliq, a leading provider of animal identification and traceability solutions. This strategic move was expected to strengthen Merck Animal Health's digital capabilities and expand its presence in the animal identification and monitoring market (Merck KGaA Press Release, 2024).
- In May 2025, the European Commission approved the use of deep learning algorithms in veterinary diagnostics, paving the way for increased adoption of AI technologies in animal health across Europe. This regulatory approval is expected to boost the growth of the European the market significantly (European Commission Press Release, 2025).
Dive into Technavio's robust research methodology, blending expert interviews, extensive data synthesis, and validated models for unparalleled AI In Animal Health Market insights. See full methodology.
|
Market Scope |
|
|
Report Coverage |
Details |
|
Page number |
231 |
|
Base year |
2024 |
|
Historic period |
2019-2023 |
|
Forecast period |
2025-2029 |
|
Growth momentum & CAGR |
Accelerate at a CAGR of 28.4% |
|
Market growth 2025-2029 |
USD 3669 million |
|
Market structure |
Fragmented |
|
YoY growth 2024-2025(%) |
26.7 |
|
Key countries |
US, China, Germany, UK, Canada, India, Japan, France, Brazil, and South Korea |
|
Competitive landscape |
Leading Companies, Market Positioning of Companies, Competitive Strategies, and Industry Risks |
Research Analyst Overview
- The animal health market continues to evolve, driven by the integration of advanced technologies such as machine learning algorithms and deep learning applications. These technologies are revolutionizing various sectors, from livestock health surveillance to on-farm diagnostic testing and animal welfare assessment. For instance, a leading farm implemented AI-powered veterinary tools to analyze livestock behavior and detect early signs of disease, resulting in a 20% reduction in medication usage and improved farm efficiency. Data analytics dashboards and natural language processing are transforming the way farmers manage their operations. Deep learning algorithms enable antimicrobial resistance prediction and disease prediction models, while precision livestock farming and individual animal tracking enhance animal productivity and welfare.
- AI-driven treatment protocols and veterinary telehealth platforms facilitate remote animal monitoring and automated feeding and milking systems. Furthermore, computer vision systems and sensor-based animal tracking enable real-time health monitoring, while precision feeding strategies and treatment optimization improve overall animal care. The industry is expected to grow at a robust rate, with predictive veterinary analytics and animal health diagnostics becoming increasingly essential components of data-driven animal care. The integration of AI in animal health is continuously unfolding, offering numerous opportunities for innovation and optimization. For example, a recent study revealed that AI-powered reproductive management tools can significantly improve breeding strategies, leading to a 15% increase in productivity for dairy farms.
- The future of animal health lies in the integration of these advanced technologies, enabling farmers to make data-driven decisions and optimize their operations for enhanced animal productivity and welfare.
What are the Key Data Covered in this AI In Animal Health Market Research and Growth Report?
-
What is the expected growth of the AI In Animal Health Market between 2025 and 2029?
-
USD 3.67 billion, at a CAGR of 28.4%
-
-
What segmentation does the market report cover?
-
The report is segmented by Component (Hardware, Software, and Services), Type (Companion animals and Production animals), Application (Diagnostics, Identification tracking and monitoring, and Others), and Geography (North America, APAC, Europe, South America, and Middle East and Africa)
-
-
Which regions are analyzed in the report?
-
North America, APAC, Europe, South America, and Middle East and Africa
-
-
What are the key growth drivers and market challenges?
-
Imperative for precision livestock farming and enhanced food security, Data scarcity, quality, and standardization issues
-
-
Who are the major players in the AI In Animal Health Market?
-
Antech Diagnostics, Inc., Aquabyte, Bayer AG, Boehringer Ingelheim International GmbH, Cargill Inc., Elanco Animal Health Inc., IDEXX Laboratories Inc., ImpriMed, Inc., Mars Inc., Merck and Co. Inc., Neogen Corp., OneCup AI, PetPace, SignalPET, Teledyne Technologies Inc., Vetology LLC, Vetoquinol SA, Virbac SA, and Zoetis Inc.
-
Market Research Insights
- The market for AI in animal health is a dynamic and ever-evolving landscape. Two key areas of growth include precision dairy farming and companion animal diagnostics. In precision dairy farming, AI is used to optimize resource allocation, improve feed efficiency, and enhance disease control. For instance, AI-powered systems can analyze milk production data to identify trends and predict potential health issues, leading to reduced mortality rates and improved animal welfare. Moreover, in companion animal diagnostics, AI is revolutionizing veterinary image analysis and automated health screening.
- These technologies enable faster and more accurate diagnoses, resulting in better treatment outcomes. Industry growth in this sector is expected to reach double digits in the coming years, reflecting the significant potential for AI to transform animal healthcare.
We can help! Our analysts can customize this ai in animal health market research report to meet your requirements.
 RIA -
RIA - 
