AI In Computer Vision Market Size 2026-2030
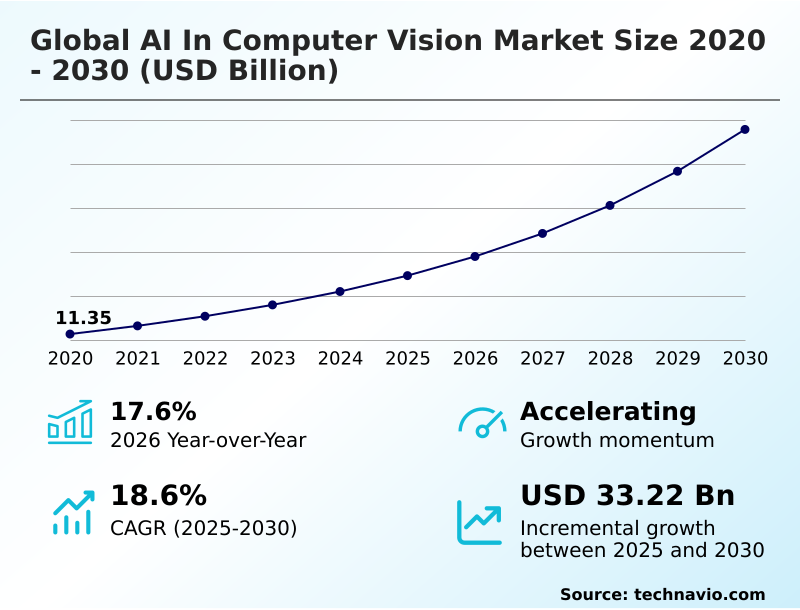
The ai in computer vision market size is valued to increase by USD 33.22 billion, at a CAGR of 18.6% from 2025 to 2030. Accelerated digital transformation in industrial and manufacturing operations will drive the ai in computer vision market.
Major Market Trends & Insights
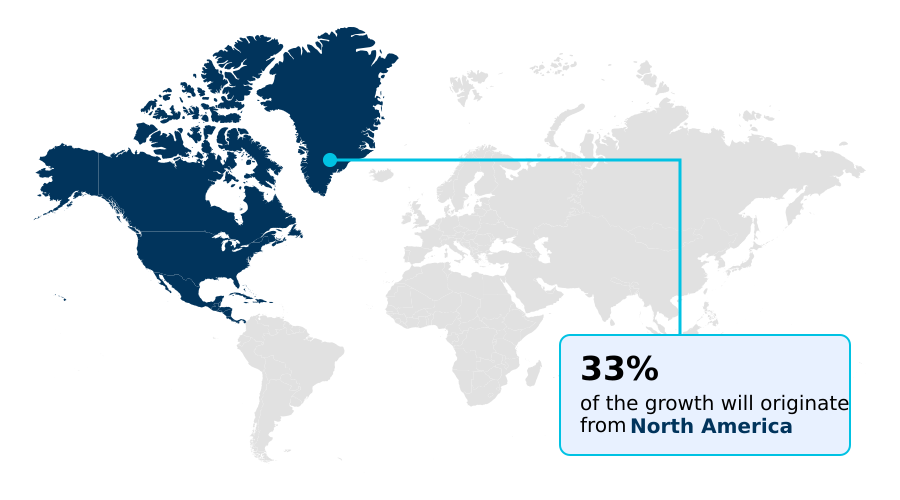
- North America dominated the market and accounted for a 32.8% growth during the forecast period.
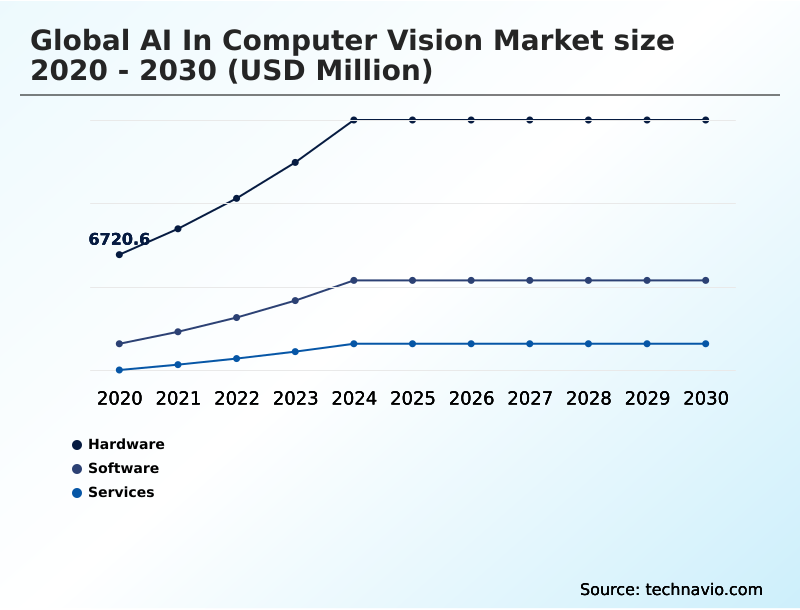
- By Component - Hardware segment was valued at USD 12.53 billion in 2024
- By Application - Image identification segment accounted for the largest market revenue share in 2024
Market Size & Forecast
- Market Opportunities: USD 46.51 billion
- Market Future Opportunities: USD 33.22 billion
- CAGR from 2025 to 2030 : 18.6%
Market Summary
- The AI in computer vision market is characterized by a rapid evolution from basic image recognition to sophisticated systems capable of high-precision visual intelligence and real-time spatial reasoning.
- This advancement is driven by the integration of deep learning architectures, such as convolutional neural networks, with powerful hardware like graphics processing units, enabling machines to interpret complex visual data with human-like accuracy. A key trend is the convergence with generative artificial intelligence, which allows systems not only to analyze but also to create visual content.
- In a practical business scenario, a logistics company can deploy automated visual inspection systems on its assembly lines, using vision-guided robotics to identify and sort packages, significantly improving throughput and reducing errors without manual intervention. However, the market also grapples with challenges related to algorithmic bias and the need for explainable AI to ensure transparency and trust.
- The continuous development of technologies like Vision Transformers and the move toward decentralized processing at the edge are set to further transform industrial automation, healthcare diagnostics, and autonomous systems.
What will be the Size of the AI In Computer Vision Market during the forecast period?
Get Key Insights on Market Forecast (PDF) Get Free Sample
How is the AI In Computer Vision Market Segmented?
The ai in computer vision industry research report provides comprehensive data (region-wise segment analysis), with forecasts and estimates in "USD million" for the period 2026-2030, as well as historical data from 2020-2024 for the following segments.
- Component
- Hardware
- Software
- Services
- Application
- Image identification
- Predictive maintenance
- Facial recognition
- Positioning
- Others
- End-user
- Consumer electronics
- Automotive
- Healthcare
- Food and packaging
- Others
- Geography
- North America
- US
- Canada
- Mexico
- APAC
- China
- Japan
- India
- Europe
- Germany
- UK
- France
- South America
- Brazil
- Argentina
- Middle East and Africa
- UAE
- Saudi Arabia
- South Africa
- Rest of World (ROW)
- North America
By Component Insights
The hardware segment is estimated to witness significant growth during the forecast period.
The hardware segment provides the foundational computational power for the global AI in computer vision market 2026-2030, integrating components like graphics processing units and specialized industrial cameras.
This segment's evolution is marked by a shift toward edge computing, where decentralized processing on neural processing units enables real-time spatial reasoning. Vision-guided robotics, crucial for industrial automation, rely on these advanced hardware capabilities.
Innovations in application specific integrated circuits and high-resolution sensors are essential for high-precision visual intelligence in fields from manufacturing to cashierless stores.
Systems deploying vision transformers achieve over 99% accuracy in complex sorting tasks, a significant improvement over manual processes, showcasing the impact of robust hardware in achieving physics-level accuracy and supporting agentic autonomy.
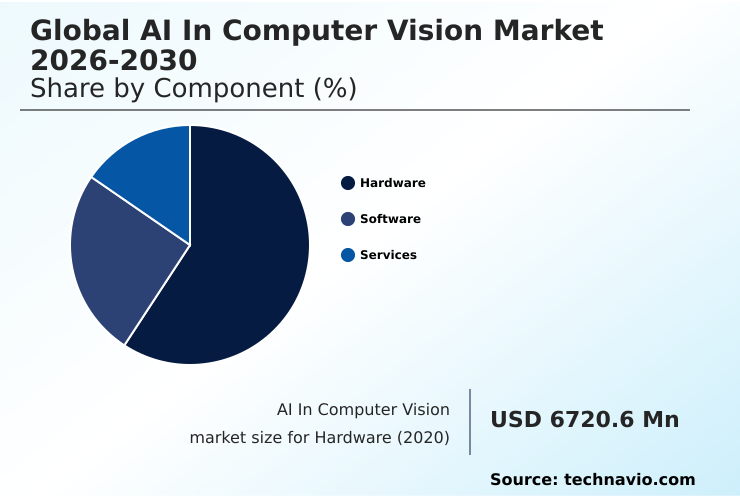
The Hardware segment was valued at USD 12.53 billion in 2024 and showed a gradual increase during the forecast period.
Regional Analysis
North America is estimated to contribute 32.8% to the growth of the global market during the forecast period.Technavio’s analysts have elaborately explained the regional trends and drivers that shape the market during the forecast period.
See How AI In Computer Vision Market Demand is Rising in North America Get Free Sample
The geographic landscape is led by North America, which accounts for over 32% of the market, driven by high R&D spending and leadership in deep learning frameworks and real-time threat detection and forensic search.
APAC is the fastest-growing region, fueled by massive investments in smart manufacturing, giga-projects, and public safety initiatives that leverage automated license plate recognition.
Europe emphasizes ethical governance and data-centric AI, with a strong focus on industrial applications like automated sorting and palletizing and predictive maintenance for machinery.
South America is seeing growth in precision agriculture, where AI for crop health monitoring is becoming vital.
The market in the Middle East and Africa is expanding through smart city projects and security applications like in-cabin monitoring for driver alertness and visual analytics for public safety.
Market Dynamics
Our researchers analyzed the data with 2025 as the base year, along with the key drivers, trends, and challenges. A holistic analysis of drivers will help companies refine their marketing strategies to gain a competitive advantage.
- The global AI in computer vision market 2026-2030 is witnessing a significant shift toward specialized, high-impact applications that deliver measurable operational value. In healthcare, the use of augmented reality overlays for surgical guidance and AI-powered screening of radiological scans is enhancing precision and patient outcomes. Simultaneously, remote diagnostics for underserved populations are becoming more feasible through mobile-based vision tools.
- Public safety is being transformed by real-time threat detection and forensic search capabilities, alongside automated license plate recognition for traffic management and real-time analysis of pedestrian movement for urban planning. In industrial settings, high-speed quality assurance is now standard, with automated defect detection in manufacturing and structural inspection of heavy machinery reducing downtime and improving safety.
- Vision systems for industrial safety and in-cabin monitoring for driver alertness are becoming critical in transportation. Supply chains benefit from vision-based inventory management systems and automated sorting and palletizing, which improve efficiency by more than 40% compared to manual methods.
- The agricultural sector is adopting AI for crop health monitoring and the automated grading of agricultural commodities, while non-contact vital sign detection and visual data interpretation for urban planning showcase the technology's versatility. High-precision assembly and surface quality inspection and automated monitoring of production lines remain key to advanced manufacturing.
What are the key market drivers leading to the rise in the adoption of AI In Computer Vision Industry?
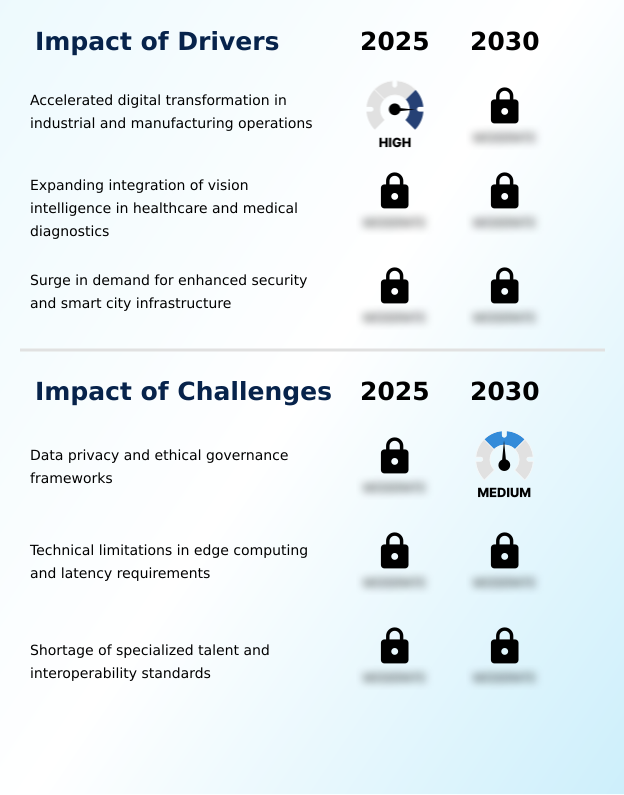
- Accelerated digital transformation in industrial and manufacturing operations is a primary driver fueling the growth of the AI in computer vision market.
- The market is primarily driven by the accelerating digital transformation in industrial sectors, where automated quality inspection systems have become essential.
- The integration of vision intelligence in healthcare is another major driver, with AI-powered tools improving diagnostic accuracy for radiological scans by over 30%.
- The demand for enhanced security and the development of smart city infrastructure are also fueling growth, as computer vision enables real-time threat detection and traffic flow optimization.
- This global push toward automation is supported by the increasing availability of high-performance computing and refined neural network architectures.
- Consequently, industries are witnessing a clear return on investment through reduced downtime and improved product yields, cementing visual intelligence as a cornerstone of market expansion and operational efficiency.
What are the market trends shaping the AI In Computer Vision Industry?
- The increasing adoption of synthetic data is a pivotal trend, enabling the development and training of more robust and sophisticated deep learning models for computer vision applications.
- Key trends are reshaping the market, with the adoption of synthetic data generation accelerating model development and reducing reliance on costly real-world data collection, leading to an 18% improvement in model training times. The convergence of computer vision with large-scale generative models is creating new paradigms, enabling photorealistic environments for simulations and automated content creation.
- Vision-as-a-service (VaaS) models and sophisticated cloud-to-edge orchestration are democratizing access to advanced technologies like automated machine learning, allowing smaller enterprises to deploy scalable solutions. The rise of self-supervised learning and multimodal learning enables AI systems to achieve a more holistic understanding by processing diverse data streams, improving accuracy in complex scenarios by up to 25%.
What challenges does the AI In Computer Vision Industry face during its growth?
- The complexities of data privacy and the need for robust ethical governance frameworks present a significant challenge to the widespread growth and adoption of computer vision technologies.
- Primary challenges stem from the intricate landscape of data privacy and the need for ethical governance, with non-compliance costs rising by 20% in some jurisdictions. Technical limitations in edge computing, including power consumption and latency, constrain the deployment of complex models for real-time applications, where even a 1% loss in accuracy from model pruning is unacceptable.
- The significant shortage of specialized talent with expertise in mathematics, deep learning, and hardware engineering creates fierce competition for resources. A lack of universal interoperability standards for data anonymization and model deployment results in fragmented ecosystems, hindering the integration of vision systems from multiple vendors and increasing deployment complexities for end-users.
Exclusive Technavio Analysis on Customer Landscape
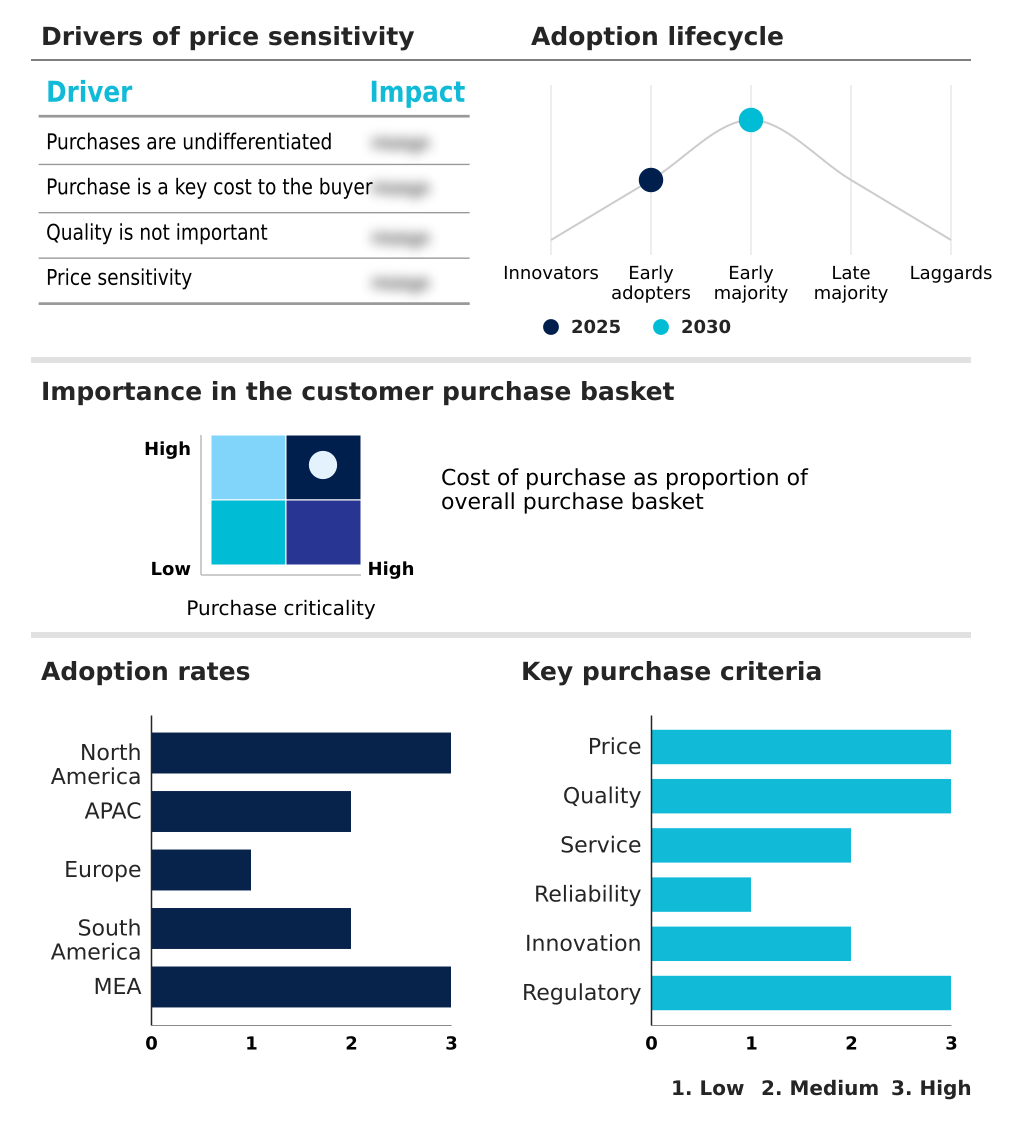
The ai in computer vision market forecasting report includes the adoption lifecycle of the market, covering from the innovator’s stage to the laggard’s stage. It focuses on adoption rates in different regions based on penetration. Furthermore, the ai in computer vision market report also includes key purchase criteria and drivers of price sensitivity to help companies evaluate and develop their market growth analysis strategies.
Customer Landscape of AI In Computer Vision Industry
Competitive Landscape
Companies are implementing various strategies, such as strategic alliances, ai in computer vision market forecast, partnerships, mergers and acquisitions, geographical expansion, and product/service launches, to enhance their presence in the industry.
Amazon Web Services Inc. - Offerings include advanced image and video analysis for automated defect detection, leveraging sophisticated AI in computer vision to enhance industrial quality control and operational efficiency.
The industry research and growth report includes detailed analyses of the competitive landscape of the market and information about key companies, including:
- Amazon Web Services Inc.
- Basler AG
- Beijing Kuangshi Technology
- Clarifai Inc.
- Cognex Corp.
- Google LLC
- Hailo Technologies Ltd.
- IBM Corp.
- Intel Corp.
- Keyence Corp.
- Microsoft Corp.
- Neurala Inc.
- NVIDIA Corp.
- OMRON Corp.
- Qualcomm Inc.
- SAP SE
- SenseTime Group Inc.
- SICK AG
- Sony Group Corp.
- Teledyne Technologies Inc.
Qualitative and quantitative analysis of companies has been conducted to help clients understand the wider business environment as well as the strengths and weaknesses of key industry players. Data is qualitatively analyzed to categorize companies as pure play, category-focused, industry-focused, and diversified; it is quantitatively analyzed to categorize companies as dominant, leading, strong, tentative, and weak.
Recent Development and News in Ai in computer vision market
- In May 2025, Intel Corp. unveiled the Arc Pro B-Series graphics processing units, which are specifically engineered to accelerate artificial intelligence inference and professional workstation tasks, providing computational power for complex visual data analysis.
- In March 2025, Goldi Solar inaugurated the first artificial intelligence-integrated solar manufacturing plant, which uses advanced computer vision algorithms to monitor and optimize solar panel production lines, ensuring high-quality output through automated defect detection.
- In February 2025, the European Commission released the first set of harmonized standards for high-risk AI applications, targeting computer vision systems used in critical infrastructure and public transportation to provide a clear roadmap for manufacturers.
- In February 2025, the Brazilian Ministry of Science and Technology inaugurated a center for excellence in AI focused on developing vision systems for sustainable agriculture and deforestation monitoring in the Amazon rainforest.
Dive into Technavio’s robust research methodology, blending expert interviews, extensive data synthesis, and validated models for unparalleled AI In Computer Vision Market insights. See full methodology.
| Market Scope | |
|---|---|
| Page number | 314 |
| Base year | 2025 |
| Historic period | 2020-2024 |
| Forecast period | 2026-2030 |
| Growth momentum & CAGR | Accelerate at a CAGR of 18.6% |
| Market growth 2026-2030 | USD 33224.4 million |
| Market structure | Fragmented |
| YoY growth 2025-2026(%) | 17.6% |
| Key countries | US, Canada, Mexico, China, Japan, India, South Korea, Australia, Indonesia, Germany, UK, France, Italy, Spain, The Netherlands, Brazil, Argentina, Chile, UAE, Saudi Arabia, South Africa, Egypt and Nigeria |
| Competitive landscape | Leading Companies, Market Positioning of Companies, Competitive Strategies, and Industry Risks |
Research Analyst Overview
- The AI in computer vision market's growth is propelled by the integration of agentic autonomy and high-precision visual intelligence into core business operations. Key advancements in deep learning frameworks and generative artificial intelligence are enabling sophisticated applications like image classification and semantic segmentation.
- The adoption of vision transformers and multimodal learning is leading to more accurate and context-aware systems, with automated visual inspection achieving over 99% accuracy in manufacturing settings.
- The technology's expansion into predictive maintenance and real-time spatial reasoning is a direct result of progress in edge computing and the development of specialized hardware, including application specific integrated circuits and neural processing units. As organizations implement digital twin capabilities and autonomous agentic frameworks, the demand for high-resolution sensors and robust industrial cameras intensifies.
- The move toward decentralized processing, physics-level accuracy, and object detection addresses latency and data privacy concerns, making real-time applications like facial recognition technology and vision-guided robotics increasingly viable for mainstream adoption across industries.
What are the Key Data Covered in this AI In Computer Vision Market Research and Growth Report?
-
What is the expected growth of the AI In Computer Vision Market between 2026 and 2030?
-
USD 33.22 billion, at a CAGR of 18.6%
-
-
What segmentation does the market report cover?
-
The report is segmented by Component (Hardware, Software, and Services), Application (Image identification, Predictive maintenance, Facial recognition, Positioning, and Others), End-user (Consumer electronics, Automotive, Healthcare, Food and packaging, and Others) and Geography (North America, APAC, Europe, South America, Middle East and Africa)
-
-
Which regions are analyzed in the report?
-
North America, APAC, Europe, South America and Middle East and Africa
-
-
What are the key growth drivers and market challenges?
-
Accelerated digital transformation in industrial and manufacturing operations , Data privacy and ethical governance frameworks
-
-
Who are the major players in the AI In Computer Vision Market?
-
Amazon Web Services Inc., Basler AG, Beijing Kuangshi Technology, Clarifai Inc., Cognex Corp., Google LLC, Hailo Technologies Ltd., IBM Corp., Intel Corp., Keyence Corp., Microsoft Corp., Neurala Inc., NVIDIA Corp., OMRON Corp., Qualcomm Inc., SAP SE, SenseTime Group Inc., SICK AG, Sony Group Corp. and Teledyne Technologies Inc.
-
Market Research Insights
- Market dynamics are defined by a move toward increasingly sophisticated applications, where automated cataloging and visual heat-mapping are becoming standard in retail environments. The adoption of vision-as-a-service (VaaS) models allows businesses to leverage advanced vision APIs without significant upfront investment, democratizing access to the technology.
- The integration of computer vision into the industrial internet of things (IIoT) has led to significant efficiency gains, with some manufacturers reporting a 30% reduction in production line downtime through predictive maintenance. Similarly, the use of automated visual inspection has improved defect detection rates by over 40% compared to manual methods.
- This shift is supported by advanced cloud-to-edge orchestration, which balances processing loads for optimal performance and cost-efficiency in applications ranging from precision agriculture to intelligent transport systems.
We can help! Our analysts can customize this ai in computer vision market research report to meet your requirements.
 RIA -
RIA - 
