
AI In Data Quality Market Size 2025-2029
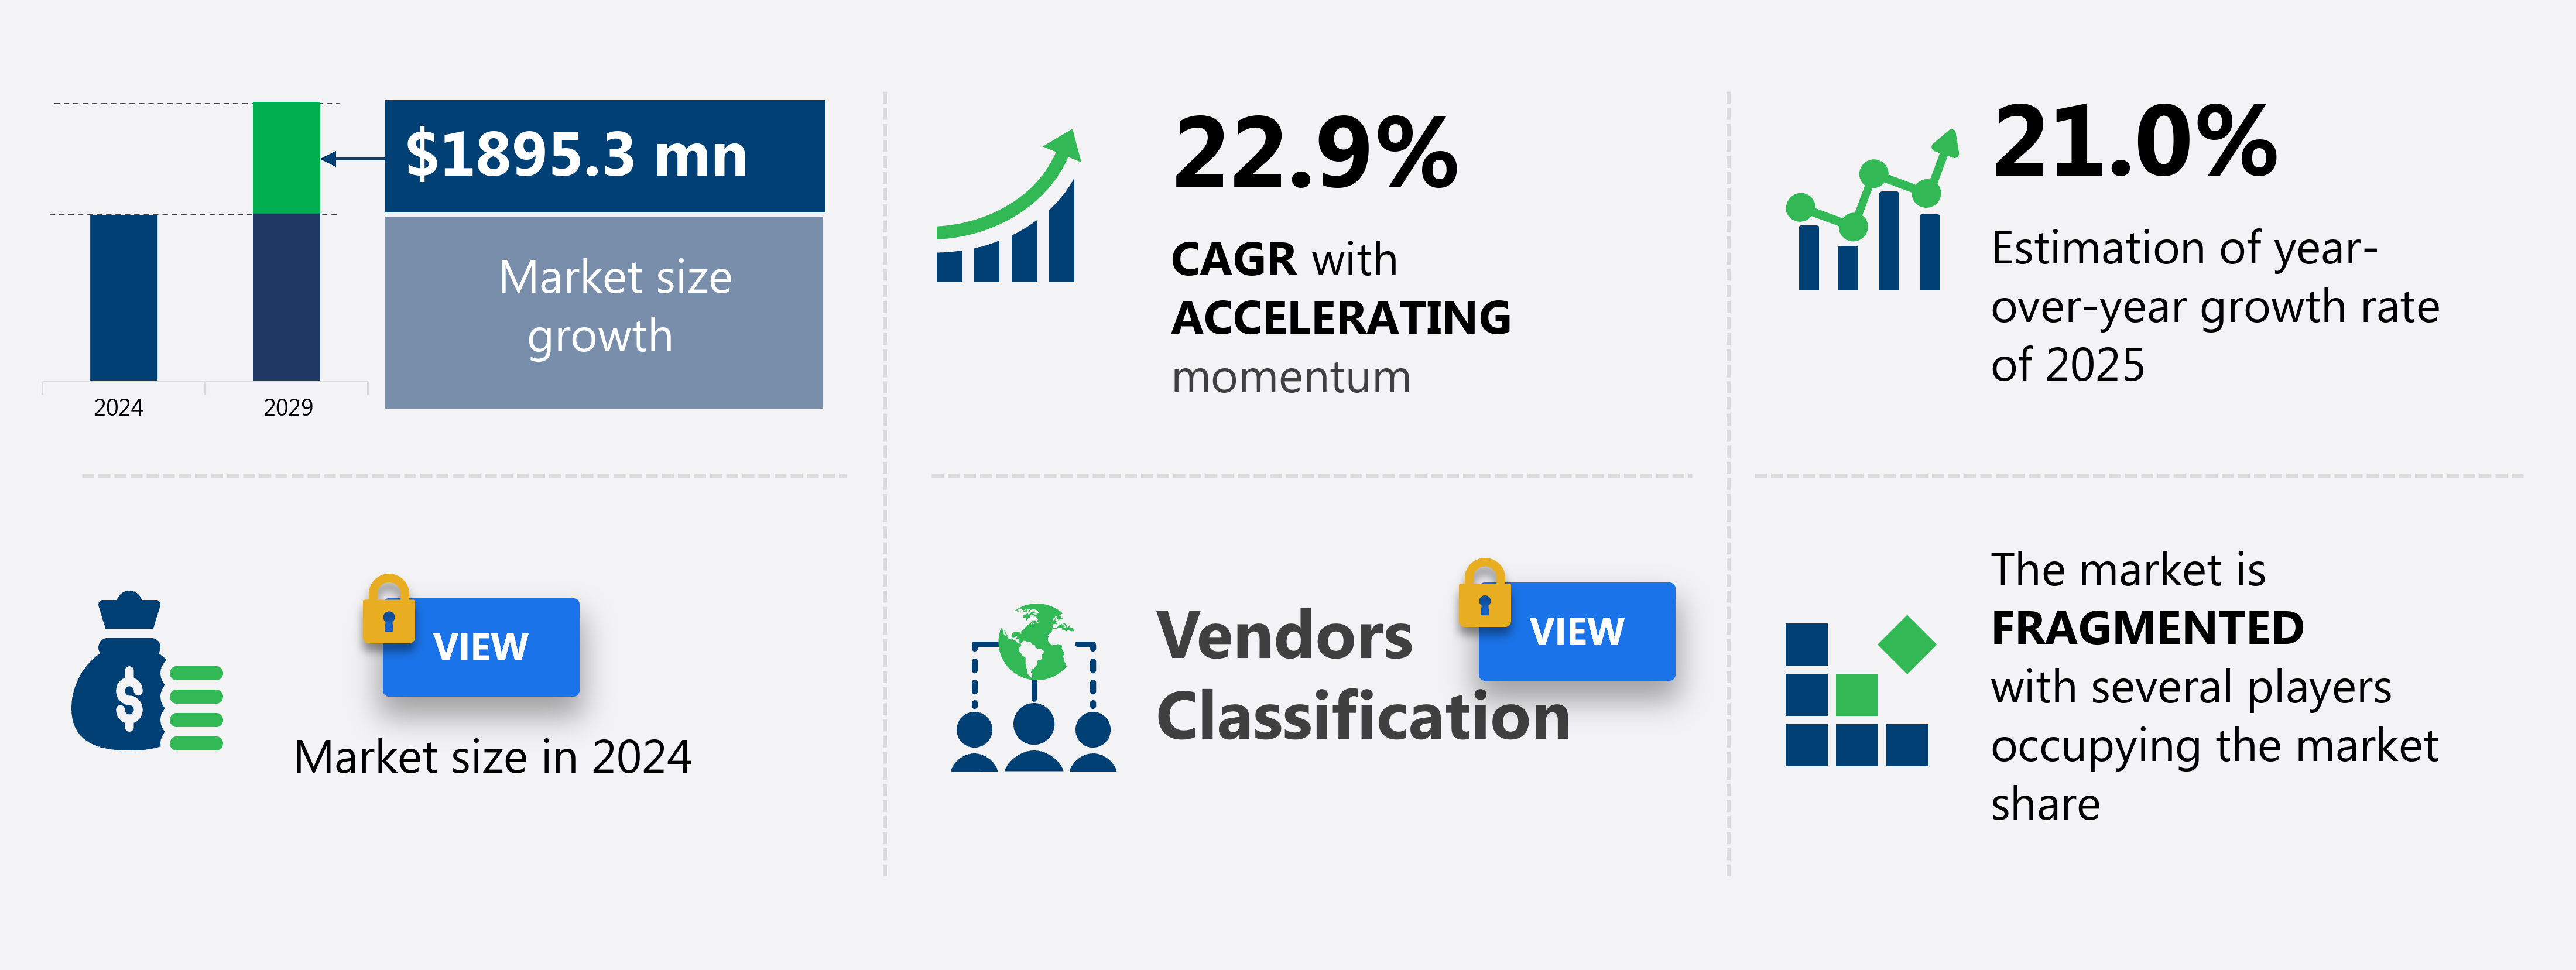
The ai in data quality market size is valued to increase by USD 1.9 billion, at a CAGR of 22.9% from 2024 to 2029. Proliferation of big data and escalating data complexity will drive the ai in data quality market.
Major Market Trends & Insights
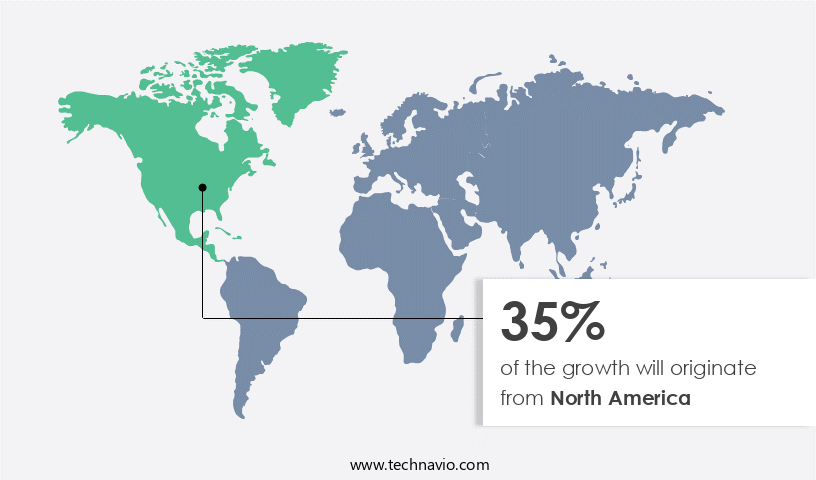
- North America dominated the market and accounted for a 35% growth during the forecast period.
- By Deployment - Cloud-based segment accounted for the largest market revenue share in 2023
- CAGR from 2024 to 2029 : 22.9%
Market Summary
- In the realm of data management, the integration of Artificial Intelligence (AI) in data quality has emerged as a game-changer. According to recent estimates, The market is projected to reach a value of USD12.2 billion by 2025, underscoring its growing significance. This growth is driven by the proliferation of big data and escalating data complexity. AI's ability to analyze vast amounts of data and extract valuable insights has become indispensable for businesses seeking to enhance their data quality and gain a competitive edge. The fusion of generative AI and natural language interfaces is another key trend.
- This development enables more intuitive and user-friendly interactions with data, making it easier for businesses to identify and address data quality issues. However, the complexity of integrating AI with heterogeneous and legacy IT environments poses a significant challenge. Despite these hurdles, the future direction of AI in data quality is undeniably forward. As businesses continue to grapple with the intricacies of managing and leveraging their data, the role of AI in ensuring data quality and accuracy will only become more essential.
What will be the Size of the AI In Data Quality Market during the forecast period?
Get Key Insights on Market Forecast (PDF) Request Free Sample
How is the AI In Data Quality Market Segmented and what are the key trends of market segmentation?
The ai in data quality industry research report provides comprehensive data (region-wise segment analysis), with forecasts and estimates in "USD million" for the period 2025-2029, as well as historical data from 2019-2023 for the following segments.
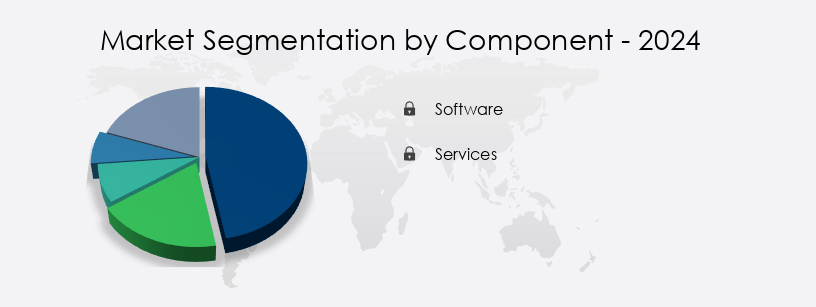
- Component
- Software
- Services
- Deployment
- Cloud-based
- On premises
- Industry Application
- BFSI
- IT and telecommunications
- Healthcare
- Retail and e commerce
- Others
- Geography
- North America
- US
- Canada
- Europe
- France
- Germany
- Italy
- UK
- APAC
- China
- India
- Japan
- South Korea
- Rest of World (ROW)
- North America
By Component Insights
The software segment is estimated to witness significant growth during the forecast period.
The market continues to evolve, with the software segment driving innovation. This segment encompasses platforms, tools, and applications that automate data integrity processes. Traditional rule-based systems have given way to AI-driven solutions, which autonomously monitor data quality. The software segment can be divided into standalone platforms, integrated modules, and embedded features. Standalone platforms offer end-to-end capabilities, while integrated modules function within larger data management or governance suites. Embedded features, found in cloud data warehouses and lakehouse platforms, provide AI-powered checks as native functionalities. In 2021, the market size for AI-driven data quality solutions was estimated at USD3.5 billion, reflecting the growing importance of maintaining data accuracy and consistency.
Regional Analysis
North America is estimated to contribute 35% to the growth of the global market during the forecast period.Technavio's analysts have elaborately explained the regional trends and drivers that shape the market during the forecast period.
See How AI In Data Quality Market Demand is Rising in North America Request Free Sample
The market is witnessing significant growth and evolution, with North America leading the charge. Comprising the United States and Canada, this region is home to the world's most advanced technology companies and a thriving venture capital ecosystem. This unique combination of technological expertise and investment has led to the early adoption of foundational technologies such as cloud computing, big data analytics, and machine learning. As a result, the North American market is characterized by a sophisticated customer base that recognizes the strategic value of data and the importance of its integrity.
This growth is driven by the increasing demand for data accuracy, security, and compliance in various industries, including finance, healthcare IT, and retail. AI technologies, such as machine learning algorithms and natural language processing, are increasingly being used to improve data quality, enhance customer experiences, and drive business growth.
Market Dynamics
Our researchers analyzed the data with 2024 as the base year, along with the key drivers, trends, and challenges. A holistic analysis of drivers will help companies refine their marketing strategies to gain a competitive advantage.
The global market for improving data quality using AI is experiencing significant growth as businesses increasingly recognize the value of accurate and reliable data. This trend is driven by the adoption of advanced AI algorithms for data cleansing, which leverage machine learning to identify and correct errors, inconsistencies, and anomalies in real-time. One key application of AI in data quality is the use of deep learning for data quality, which enables organizations to automatically learn and adapt to new data patterns and improve data accuracy over time. Real-time data quality monitoring is another critical area where AI is making a difference, with data quality dashboards and scorecards providing actionable insights into data health and helping to identify potential issues before they become major problems.
Implementing a data quality framework that incorporates AI is becoming a best practice for businesses seeking to build an AI-powered data quality system. Statistical methods and data quality rules and validation are essential components of such a framework, and AI can help automate these processes, reducing manual effort and improving efficiency. Predictive modeling for data quality is another area where AI is making a significant impact. By analyzing historical data and identifying trends and patterns, AI algorithms can help organizations anticipate potential data quality issues and take proactive steps to address them. Data governance and data quality are closely related, and AI can help organizations ensure compliance with regulations and industry standards by automating data access controls and providing real-time monitoring and reporting.
Automated data quality checks are another key application of AI in data quality, with machine learning algorithms able to identify and correct errors and inconsistencies in large datasets more efficiently than manual methods. Data quality metrics and KPIs are essential for measuring the effectiveness of data quality initiatives, and AI can help organizations collect and analyze these metrics in real-time, providing valuable insights into data health and performance. Master data management and data quality are critical for ensuring data consistency and accuracy across an organization. AI can help automate data profiling and data quality processes, enabling organizations to identify and resolve data lineage and metadata management issues more effectively.
Data integration and data quality are also closely related, with AI helping to automate data mapping and digital transformation processes, reducing errors and improving overall data quality. According to recent studies, more than 80% of businesses report experiencing data quality issues, with the costs of poor data quality estimated to be in the billions of dollars each year. However, the adoption of AI in data quality is helping organizations to address these challenges and improve data accuracy and reliability, ultimately leading to better business outcomes and increased competitiveness.
What are the key market drivers leading to the rise in the adoption of AI In Data Quality Industry?
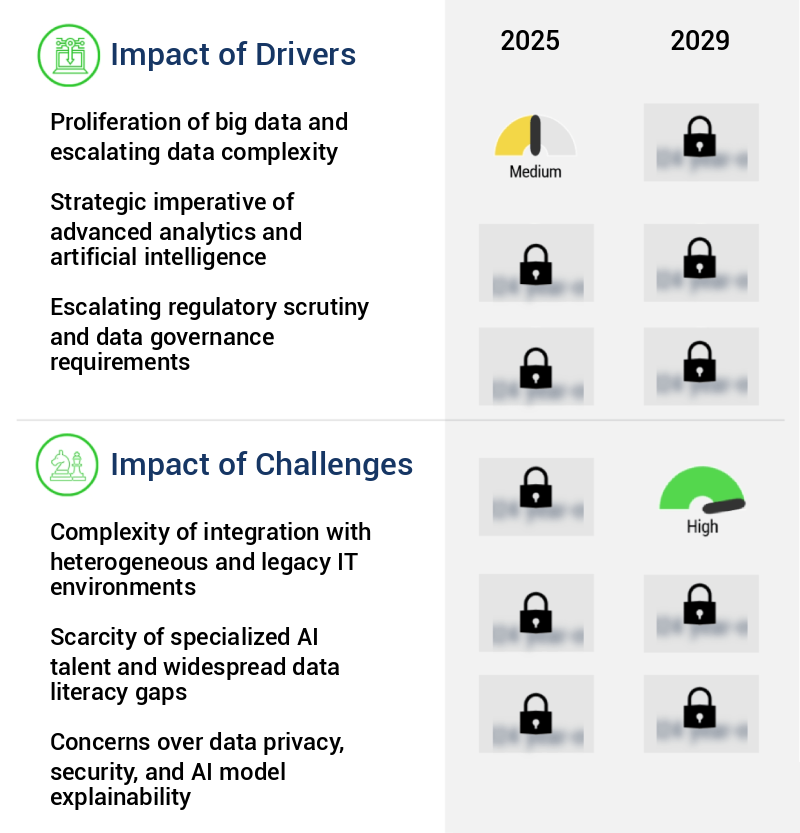
- The surge in big data and the resulting complexity are the primary factors fueling market growth. (Word count: 10)
- The market experiences continuous expansion due to the escalating volume, velocity, and complexity of data in today's business landscape. Modern enterprises grapple with an extensive range of data sources, encompassing structured data from relational databases and enterprise applications, semi-structured data from weblogs, JSON files, and social media feeds, and unstructured data from emails, documents, images, and video footage. The emergence of the Internet of Things (IoT) has intensified this trend, with billions of connected devices generating massive volumes of high-velocity sensor data.
- AI technologies, such as machine learning and natural language processing, play a pivotal role in managing and enhancing data quality, ensuring data accuracy, consistency, and completeness. These advanced solutions enable organizations to gain valuable insights, improve operational efficiency, and make informed decisions based on accurate and reliable data.
What are the market trends shaping the AI In Data Quality Industry?
- The fusion of generative AI and natural language interfaces is an emerging market trend. This technological convergence promises to enhance user experiences by enabling more sophisticated and intuitive interactions between humans and machines.
- The market is undergoing a significant transformation, marked by the increasing adoption of generative artificial intelligence and large language models (LLMs). This evolution signifies a major shift from conventional machine learning, revolutionizing user experiences and broadening access to advanced data quality solutions. The core innovation lies in the transition from intricate, code-dependent, or menu-driven interfaces to conversational interactions. This empowers even non-technical business stakeholders to engage with data quality platforms using natural language.
What challenges does the AI In Data Quality Industry face during its growth?
- The integration complexity with heterogeneous and legacy IT environments is a significant challenge that hinders industry growth, requiring professionals to possess extensive knowledge and expertise to effectively manage and streamline these systems.
- The integration of Artificial Intelligence (AI) in data quality solutions has become a significant focus in today's business landscape. The complexity of IT environments in established organizations poses a considerable challenge to the seamless adoption of AI. These landscapes are a heterogeneous mix of modern cloud services, on-premises data warehouses, and legacy systems, some of which have been operational for decades. The vast array of data sources, including mainframe databases, aging ERP systems, custom-built applications, and cloud data lakes, necessitates AI platforms with advanced data ingestion capabilities. According to recent studies, The market is projected to reach a substantial size, with market growth driven by the increasing demand for data accuracy and the need to enhance operational efficiency.
- The integration of AI in data quality processes can lead to improved data accuracy, reduced manual efforts, and enhanced data security. Despite the challenges, the potential benefits make AI in data quality an indispensable tool for organizations seeking to gain a competitive edge in their respective industries.
Exclusive Technavio Analysis on Customer Landscape
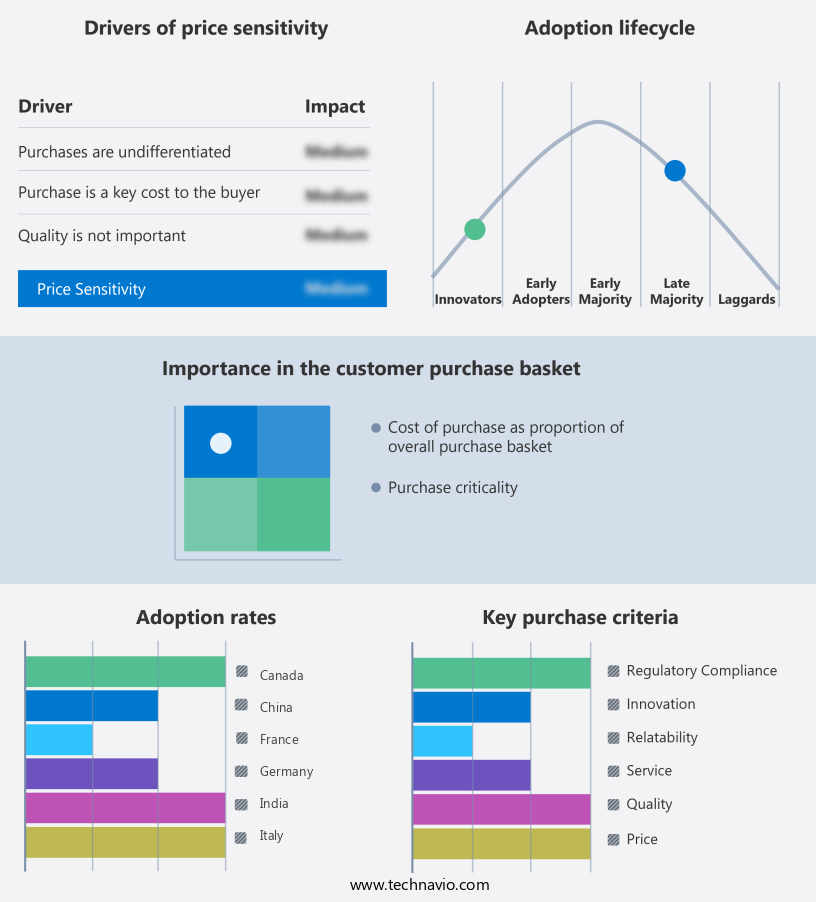
The ai in data quality market forecasting report includes the adoption lifecycle of the market, covering from the innovator's stage to the laggard's stage. It focuses on adoption rates in different regions based on penetration. Furthermore, the ai in data quality market report also includes key purchase criteria and drivers of price sensitivity to help companies evaluate and develop their market growth analysis strategies.
Customer Landscape of AI In Data Quality Industry
Competitive Landscape
Companies are implementing various strategies, such as strategic alliances, ai in data quality market forecast, partnerships, mergers and acquisitions, geographical expansion, and product/service launches, to enhance their presence in the industry.
Alteryx Inc. - The company's AI Data Clearinghouse utilizes advanced artificial intelligence to ensure data quality, providing context-rich, AI-ready data through governed workflows. This innovative solution enhances data accuracy and consistency, ultimately improving business intelligence and decision-making processes.
The industry research and growth report includes detailed analyses of the competitive landscape of the market and information about key companies, including:
- Alteryx Inc.
- Amazon Web Services Inc.
- Ataccama Corp.
- Collibra
- Databricks Inc.
- Dataiku Inc.
- Experian Plc
- Google LLC
- Informatica Inc.
- International Business Machines Corp.
- Microsoft Corp.
- Oracle Corp.
- Precisely
- QlikTech International AB
- Salesforce Inc.
- SAP SE
- SAS Institute Inc.
- Snowflake Inc.
- Teradata Corp.
- TIBCO Software Inc.
Qualitative and quantitative analysis of companies has been conducted to help clients understand the wider business environment as well as the strengths and weaknesses of key industry players. Data is qualitatively analyzed to categorize companies as pure play, category-focused, industry-focused, and diversified; it is quantitatively analyzed to categorize companies as dominant, leading, strong, tentative, and weak.
Recent Development and News in AI In Data Quality Market
- In January 2024, IBM announced the launch of its new AI-powered data quality solution, IBM InfoSphere QualityStage, designed to automate data profiling, cleansing, and enrichment processes using machine learning algorithms (IBM Press Release)
- . In March 2024, Microsoft entered into a strategic partnership with Informatica to integrate Microsoft Azure AI capabilities into Informatica's Intelligent Data Management Cloud (Microsoft News Center).
- In May 2024, Trimble, a leading construction software company, raised USD250 million in a funding round to expand its AI and machine learning offerings in data quality solutions for the construction industry (Trimble Press Release).
- In February 2025, Amazon Web Services (AWS) received regulatory approval from the European Union to operate its AWS Europe (London) region, enabling European businesses to leverage AWS's AI-driven data quality services while adhering to regional data protection regulations (AWS Press Release). These developments underscore the growing importance of AI in data quality solutions, with significant investments, strategic partnerships, and regulatory approvals driving market expansion and innovation.
Dive into Technavio's robust research methodology, blending expert interviews, extensive data synthesis, and validated models for unparalleled AI In Data Quality Market insights. See full methodology.
|
Market Scope |
|
|
Report Coverage |
Details |
|
Page number |
229 |
|
Base year |
2024 |
|
Historic period |
2019-2023 |
|
Forecast period |
2025-2029 |
|
Growth momentum & CAGR |
Accelerate at a CAGR of 22.9% |
|
Market growth 2025-2029 |
USD 1895.3 million |
|
Market structure |
Fragmented |
|
YoY growth 2024-2025(%) |
21.0 |
|
Key countries |
China, India, Japan, South Korea, UK, Germany, France, Italy, US, and Canada |
|
Competitive landscape |
Leading Companies, Market Positioning of Companies, Competitive Strategies, and Industry Risks |
Research Analyst Overview
- Amidst the data-driven business landscape, ensuring data quality has become a paramount concern for organizations. The market continues to evolve, revolutionizing traditional data management practices. Leveraging advanced algorithms, this domain encompasses various solutions such as data quality rules, monitoring, lineage tracking, consistency checks, scorecards, metadata management systems, and dashboards. Predictive data quality solutions employ machine learning models to anticipate issues before they materialize, while root cause analysis uncovers the underlying causes of data discrepancies. Data profiling techniques and validation rules are integral components, ensuring data governance frameworks are adhered to. Statistical process control and prescriptive data quality methods further enhance data accuracy, enabling data quality improvement.
- Data observability tools, data quality metrics, and data validation methods are essential for maintaining data integrity. AI-driven data quality solutions automate data cleansing processes, anomaly detection, completeness checks, and audits. Master data management and data integration tools facilitate seamless data flow, while data enrichment strategies add value to existing data sets. According to recent studies, AI-driven data quality solutions are expected to account for over 40% of the total data quality market share by 2025, underscoring their growing importance. This represents a significant increase from the current market penetration, highlighting the continuous evolution of the data quality landscape.
What are the Key Data Covered in this AI In Data Quality Market Research and Growth Report?
-
What is the expected growth of the AI In Data Quality Market between 2025 and 2029?
-
USD 1.9 billion, at a CAGR of 22.9%
-
-
What segmentation does the market report cover?
-
The report segmented by Component (Software and Services), Deployment (Cloud-based and On premises), Industry Application (BFSI, IT and telecommunications, Healthcare, Retail and e commerce, and Others), and Geography (North America, Europe, APAC, South America, and Middle East and Africa)
-
-
Which regions are analyzed in the report?
-
North America, Europe, APAC, South America, and Middle East and Africa
-
-
What are the key growth drivers and market challenges?
-
Proliferation of big data and escalating data complexity, Complexity of integration with heterogeneous and legacy IT environments
-
-
Who are the major players in the AI In Data Quality Market?
-
Key Companies Alteryx Inc., Amazon Web Services Inc., Ataccama Corp., Collibra, Databricks Inc., Dataiku Inc., Experian Plc, Google LLC, Informatica Inc., International Business Machines Corp., Microsoft Corp., Oracle Corp., Precisely, QlikTech International AB, Salesforce Inc., SAP SE, SAS Institute Inc., Snowflake Inc., Teradata Corp., and TIBCO Software Inc.
-
Market Research Insights
- In the dynamic and complex landscape of data management, ensuring data quality is a critical yet intricate task. According to industry estimates, over 30% of businesses experience significant issues with their data, leading to potential revenue loss and operational inefficiencies. To address this challenge, companies are increasingly turning to AI solutions in their data quality strategies. Data quality deployment, a key aspect of data management, has seen a significant shift towards automation. AI-driven data quality tools enable real-time monitoring and automated data quality assessment, reducing the need for manual intervention. For instance, these tools can automatically detect anomalies and inconsistencies, ensuring data accuracy and completeness.
- Furthermore, AI-powered data quality platforms can learn from historical data and adapt to changing data patterns, enhancing overall data quality. Data quality improvement is a continuous process, and AI plays a pivotal role in optimizing various stages of the data quality lifecycle. By automating data quality assessment, control, reporting, and governance, businesses can save time and resources while ensuring data accuracy and compliance. Additionally, AI-driven data quality training and consulting services can help organizations develop a robust data quality strategy and improve their overall data quality score.
We can help! Our analysts can customize this ai in data quality market research report to meet your requirements.
 RIA -
RIA - 
