
AI In Electronic Devices Market Size 2025-2029
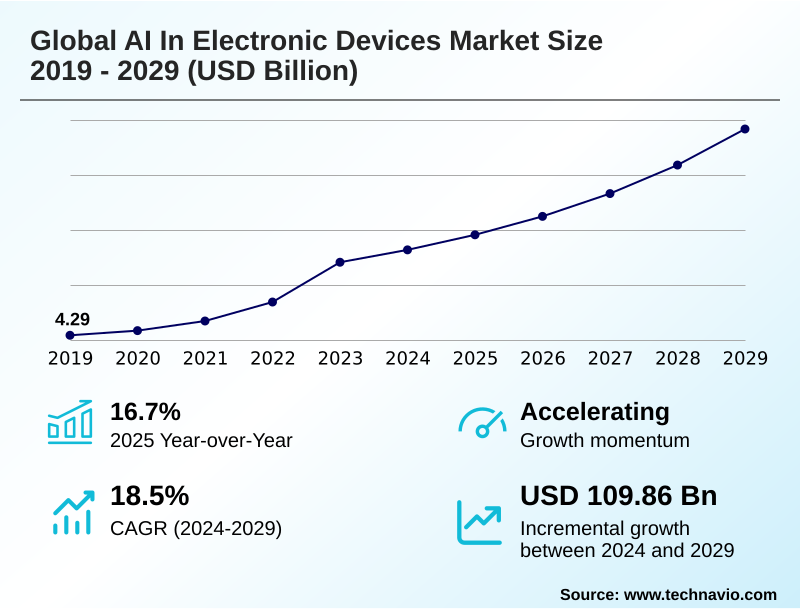
The ai in electronic devices market size is valued to increase by USD 109.86 billion, at a CAGR of 18.5% from 2024 to 2029. Advancements in specialized AI hardware and semiconductor technology will drive the ai in electronic devices market.
Major Market Trends & Insights
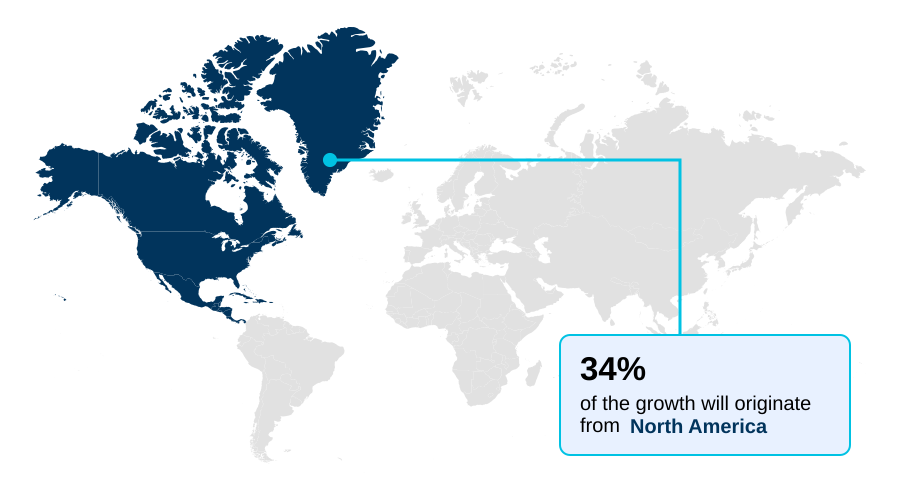
- North America dominated the market and accounted for a 34.2% growth during the forecast period.
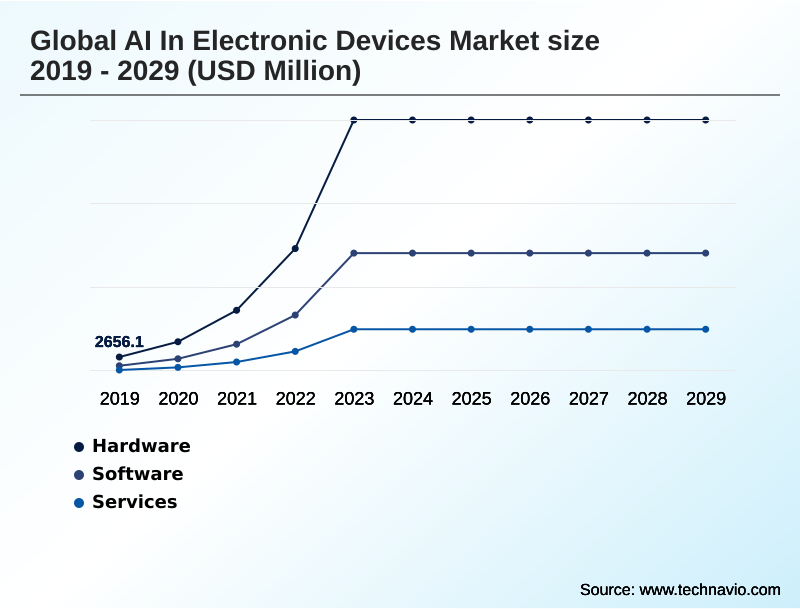
- By Component - Hardware segment was valued at USD 42.97 billion in 2023
- By Deployment - Cloud segment accounted for the largest market revenue share in 2023
Market Size & Forecast
- Market Opportunities: USD 187.53 billion
- Market Future Opportunities: USD 109.86 billion
- CAGR from 2024 to 2029 : 18.5%
Market Summary
- The AI in electronic devices market is undergoing a significant transformation, driven by the shift from cloud-dependent processing to on-device intelligence. This evolution is enabled by the integration of specialized hardware like advanced AI accelerators and sophisticated system-on-chips, which are designed to execute complex machine learning models directly on the device.
- This approach addresses critical demands for lower latency, enhanced data privacy, and offline functionality. For instance, in the automotive sector, advanced driver-assistance systems rely on on-device computer vision and sensor fusion for real-time decision-making, where any delay from cloud communication would be unacceptable.
- The capability to perform deep learning inference locally is also revolutionizing consumer electronics, powering features from computational photography to natural language processing in voice assistants. As a result, the performance of the neural engine within a device has become a key competitive differentiator, pushing manufacturers to continuously innovate in both hardware and software.
- This includes deploying transformer models optimized through techniques like model quantization and pruning to fit within the power and thermal constraints of portable devices, making edge AI a practical reality for a growing range of applications.
What will be the Size of the AI In Electronic Devices Market during the forecast period?
Get Key Insights on Market Forecast (PDF) Get Free Sample
How is the AI In Electronic Devices Market Segmented?
The ai in electronic devices industry research report provides comprehensive data (region-wise segment analysis), with forecasts and estimates in "USD million" for the period 2025-2029, as well as historical data from 2019-2023 for the following segments.
- Component
- Hardware
- Software
- Services
- Deployment
- Cloud
- On premises
- Technology
- Machine learning
- Computer vision
- NLP
- End-user
- Consumer electronics
- Automotive
- Healthcare
- Geography
- North America
- US
- Canada
- APAC
- China
- India
- Japan
- Europe
- UK
- France
- Germany
- South America
- Brazil
- Argentina
- Middle East and Africa
- Saudi Arabia
- UAE
- Rest of World (ROW)
- North America
By Component Insights
The hardware segment is estimated to witness significant growth during the forecast period.
The hardware segment is the foundational layer of the market, defined by a move toward highly specialized processors. The industry has evolved beyond general-purpose CPUs, now prioritizing the integration of custom silicon, including neural processing units and other AI accelerators.
These AI-optimized chipsets are architected for the parallel matrix multiplication essential for running complex machine learning models efficiently.
This shift to embedded AI enables devices to handle on-device AI workloads with greater speed and power efficiency, with some tensor processing units demonstrating a performance increase of nearly two times over previous generations.
This advancement in language processing units is critical for enabling sophisticated on-device AI-powered user experience and proactive content recommendations, shaping the next generation of electronics.
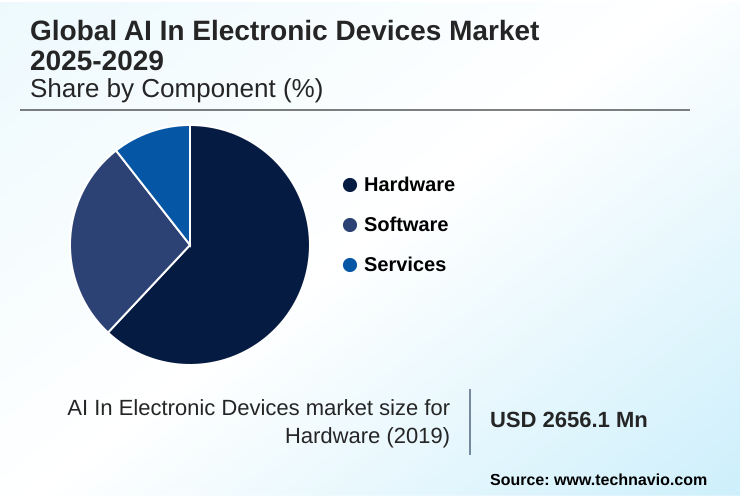
The Hardware segment was valued at USD 42.97 billion in 2023 and showed a gradual increase during the forecast period.
Regional Analysis
North America is estimated to contribute 34.2% to the growth of the global market during the forecast period.Technavio’s analysts have elaborately explained the regional trends and drivers that shape the market during the forecast period.
See How AI In Electronic Devices Market Demand is Rising in North America Get Free Sample
The geographic landscape of the market is shaped by distinct regional strengths. North America leads in foundational innovation, with its technology giants driving the development of advanced system-on-chips and setting software standards.
The region's focus on deep learning inference and generative AI is evident in devices featuring 16-core neural engines capable of 35 trillion operations per second.
In contrast, APAC serves as the global manufacturing hub and a massive consumer market, with intense competition among device makers accelerating the adoption of AI-powered system optimization.
Europe exerts significant influence through its regulatory environment, which implicitly promotes on-device processing for data privacy.
The region's strength in the automotive sector also drives demand for intelligent in-cabin infotainment and AI object recognition, creating a robust market for specialized AI-centric chipsets and AI for logistics optimization.
Market Dynamics
Our researchers analyzed the data with 2024 as the base year, along with the key drivers, trends, and challenges. A holistic analysis of drivers will help companies refine their marketing strategies to gain a competitive advantage.
- The evolution of the market is increasingly defined by specific, high-value applications that leverage on-device AI for superior performance and privacy. The development of low-power AI for wearable devices is enabling continuous, real-time on-device language translation and AI for personalized health monitoring without compromising battery life.
- In consumer electronics, AI-powered tools for photo manipulation are becoming standard, offering users sophisticated editing capabilities directly on their handsets. This is made possible by AI accelerators for edge computing and dedicated neural processing units for smartphones, which efficiently run complex algorithms.
- Concurrently, the automotive sector is a key growth area, with a focus on integrating AI into vehicle infotainment and developing robust AI for advanced driver-assistance systems. These software-defined vehicles rely on powerful AI processors for data centers to train models that are later deployed on the edge.
- The use of AI model compression techniques has been critical, allowing large language models on device to function effectively. For instance, new architectures for computer vision for robotic vacuums demonstrate object recognition accuracy that is orders of magnitude greater than previous systems, which directly impacts operational planning for manufacturers.
- The market is also seeing a rise in AI-powered biometric authentication technologies, natural language processing for voice assistants, and AI algorithms for predictive maintenance, all of which enhance device functionality and security.
- The push for AI-optimized processors for AI PCs further signals a shift toward making advanced AI a native component of everyday computing, with a strong emphasis on on-device AI for data privacy.
What are the key market drivers leading to the rise in the adoption of AI In Electronic Devices Industry?
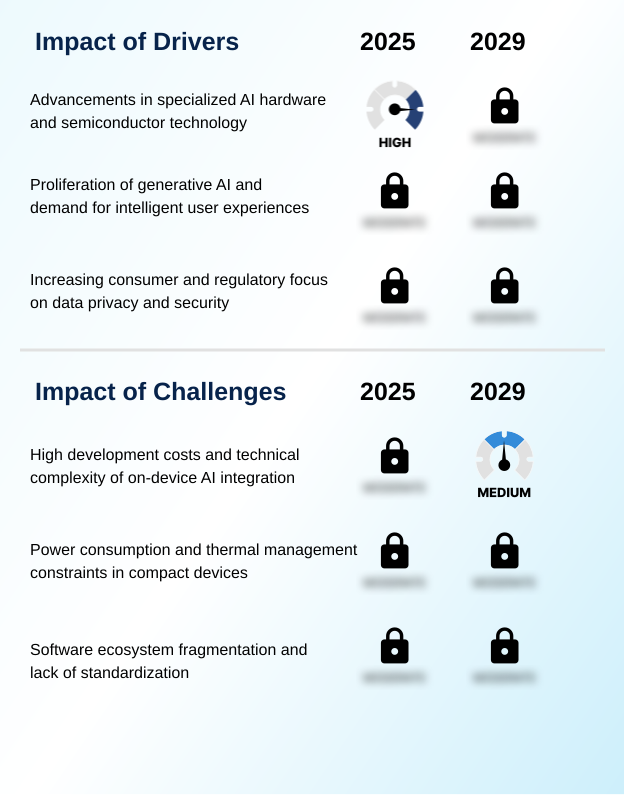
- Advancements in specialized AI hardware and semiconductor technology are a key driver fueling growth in the market.
- Market growth is propelled by relentless innovation in specialized hardware and a surge in consumer demand for intelligent features. The development of custom silicon, including advanced application-specific integrated circuits and digital signal processors, provides the computational power for complex AI.
- This hardware foundation enables on-device deep learning inference, addressing consumer desires for enhanced privacy and immediate responsiveness. The mainstream adoption of generative AI has created significant market pull, with users now expecting sophisticated conversational user interfaces and intelligent connectivity.
- This demand is a critical differentiator, compelling manufacturers to integrate AI-centric chipsets capable of running powerful AI-powered platforms. For example, some new neural engines are up to two times faster, a key enabler for the entire market.
What are the market trends shaping the AI In Electronic Devices Industry?
- The proliferation of on-device artificial intelligence represents a significant market trend. This development is fundamentally reshaping device capabilities and user interaction models.
- Key trends are reshaping the market, led by the proliferation of on-device AI and advancements in AI-optimized hardware. The focus is on executing AI workloads locally using specialized hardware like reconfigurable dataflow units and visual processing units, which enhances responsiveness and privacy. This shift is particularly evident in applications requiring real-time sensor data processing, such as in software-defined vehicles.
- The rise of generative AI has created consumer demand for devices that can handle complex on-device AI workloads. New chipsets are now capable of performing trillions of operations per second, a more than twofold increase over prior generations.
- This enables sophisticated functionalities like real-time language translation and advanced proactive health management, all powered by efficient machine learning models running directly on the device.
What challenges does the AI In Electronic Devices Industry face during its growth?
- High development costs and the technical complexity associated with on-device AI integration present a key challenge to industry growth.
- Significant challenges constrain market growth, including the technical complexity and high development costs of integrating on-device AI. Optimizing sophisticated machine learning models to run on low-power AI accelerators requires deep expertise in model quantization and pruning. Furthermore, significant fragmentation across the software ecosystem creates hurdles for developers.
- With at least five distinct hardware and software stacks from major vendors, creating universally efficient AI-powered diagnostic testing or ai-beautification algorithms is difficult and costly. This lack of standardization can stifle innovation.
- Power consumption and thermal management also remain persistent physical constraints, as running complex point-of-care devices can reduce battery life and require performance throttling to prevent overheating, impacting the AI-powered user experience.
Exclusive Technavio Analysis on Customer Landscape
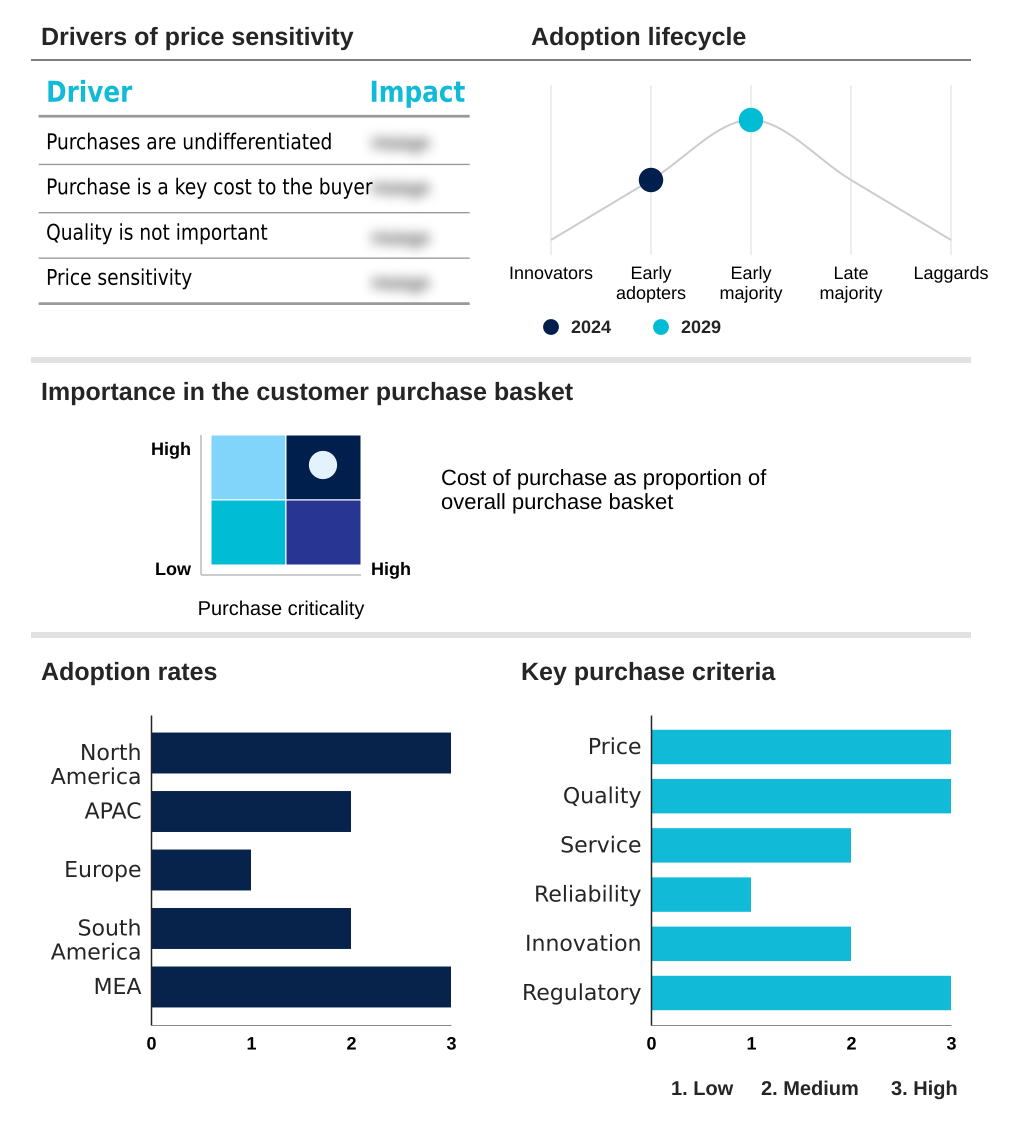
The ai in electronic devices market forecasting report includes the adoption lifecycle of the market, covering from the innovator’s stage to the laggard’s stage. It focuses on adoption rates in different regions based on penetration. Furthermore, the ai in electronic devices market report also includes key purchase criteria and drivers of price sensitivity to help companies evaluate and develop their market growth analysis strategies.
Customer Landscape of AI In Electronic Devices Industry
Competitive Landscape
Companies are implementing various strategies, such as strategic alliances, ai in electronic devices market forecast, partnerships, mergers and acquisitions, geographical expansion, and product/service launches, to enhance their presence in the industry.
Advanced Micro Devices Inc. - Offers specialized GPUs and processors for data centers and AI PCs, powering advanced artificial intelligence and high-performance computing workloads.
The industry research and growth report includes detailed analyses of the competitive landscape of the market and information about key companies, including:
- Advanced Micro Devices Inc.
- Alibaba Group Holding Ltd.
- Amazon Web Services Inc.
- Apple Inc.
- Google Cloud
- Groq Inc.
- Guangdong OPPO Mobile Telecommunications Corp. Ltd.
- Hailo Technologies Ltd.
- Huawei Technologies Co. Ltd.
- Intel Corp.
- IBM Corp.
- MediaTek Inc.
- Microsoft Corp.
- NVIDIA Corp.
- Qualcomm Inc.
- SambaNova Systems Inc.
- Samsung Electronics Co. Ltd.
- vivo Mobile Communication Co. Ltd.
- Xiaomi Inc.
Qualitative and quantitative analysis of companies has been conducted to help clients understand the wider business environment as well as the strengths and weaknesses of key industry players. Data is qualitatively analyzed to categorize companies as pure play, category-focused, industry-focused, and diversified; it is quantitatively analyzed to categorize companies as dominant, leading, strong, tentative, and weak.
Recent Development and News in Ai in electronic devices market
- In October 2024, Qualcomm announced the integration of laptop-derived technology into its new mobile processors to enhance on-device generative artificial intelligence capabilities.
- In October 2024, BlackBerry reported its QNX software was embedded in over 255 million vehicles, with the company focusing on integrating AI into its automotive platforms.
- In January 2025, QNX launched its QNX Cabin framework at the Consumer Electronics Show, enabling automakers to virtualize the development of digital cockpits in the cloud.
- In May 2025, the South Korean government approved a supplementary budget to initiate a full-scale program for developing world-class proprietary AI models.
Dive into Technavio’s robust research methodology, blending expert interviews, extensive data synthesis, and validated models for unparalleled AI In Electronic Devices Market insights. See full methodology.
| Market Scope | |
|---|---|
| Page number | 294 |
| Base year | 2024 |
| Historic period | 2019-2023 |
| Forecast period | 2025-2029 |
| Growth momentum & CAGR | Accelerate at a CAGR of 18.5% |
| Market growth 2025-2029 | USD 109864.6 million |
| Market structure | Fragmented |
| YoY growth 2024-2025(%) | 16.7% |
| Key countries | US, Canada, China, India, Japan, South Korea, UK, France, Germany, The Netherlands, Brazil, Argentina, Saudi Arabia and UAE |
| Competitive landscape | Leading Companies, Market Positioning of Companies, Competitive Strategies, and Industry Risks |
Research Analyst Overview
- The market is fundamentally reshaping user interaction with technology through the deep integration of AI-optimized chipsets and sophisticated machine learning models. The strategic pivot to on-device processing, powered by technologies like transformer models and advanced AI accelerators, is a direct response to demands for lower latency and enhanced privacy.
- This trend requires boardroom-level decisions on R&D investment in custom silicon, including neural processing units and tensor processing units, to stay competitive. The development of low-power AI accelerators has become critical, with some new designs delivering a 40% improvement in power efficiency for sustained AI workloads. This hardware enables complex applications such as computational photography and real-time natural language processing.
- The market is driven by the proliferation of edge AI and generative AI, which are transitioning from the cloud to embedded AI systems. Success hinges on mastering not just hardware like application-specific integrated circuits, but also software techniques such as model quantization, knowledge distillation, and pruning to deploy powerful models on resource-constrained devices.
- The rise of visual processing units and digital signal processors further diversifies the hardware landscape.
What are the Key Data Covered in this AI In Electronic Devices Market Research and Growth Report?
-
What is the expected growth of the AI In Electronic Devices Market between 2025 and 2029?
-
USD 109.86 billion, at a CAGR of 18.5%
-
-
What segmentation does the market report cover?
-
The report is segmented by Component (Hardware, Software, and Services), Deployment (Cloud, and On premises), Technology (Machine learning, Computer vision, and NLP), End-user (Consumer electronics, Automotive, and Healthcare) and Geography (North America, APAC, Europe, South America, Middle East and Africa)
-
-
Which regions are analyzed in the report?
-
North America, APAC, Europe, South America and Middle East and Africa
-
-
What are the key growth drivers and market challenges?
-
Advancements in specialized AI hardware and semiconductor technology, High development costs and technical complexity of on-device AI integration
-
-
Who are the major players in the AI In Electronic Devices Market?
-
Advanced Micro Devices Inc., Alibaba Group Holding Ltd., Amazon Web Services Inc., Apple Inc., Google Cloud, Groq Inc., Guangdong OPPO Mobile Telecommunications Corp. Ltd., Hailo Technologies Ltd., Huawei Technologies Co. Ltd., Intel Corp., IBM Corp., MediaTek Inc., Microsoft Corp., NVIDIA Corp., Qualcomm Inc., SambaNova Systems Inc., Samsung Electronics Co. Ltd., vivo Mobile Communication Co. Ltd. and Xiaomi Inc.
-
Market Research Insights
- The market's momentum is fueled by the tangible benefits of on-device AI workloads, which offer a more responsive and private user experience. The integration of advanced health monitoring capabilities in wearables has led to devices that can now proactively identify health patterns with over 95% accuracy in certain conditions.
- Similarly, the use of AI-assisted content creation tools on personal computers, powered by specialized silicon, has been shown to reduce task completion times by up to 30%. This efficiency is achieved through intelligent noise suppression and real-time sensor data processing.
- The demand for sophisticated AI-powered camera features and AI-driven assistance continues to drive hardware innovation, with manufacturers focusing on digital cockpit virtualization and automated control systems that deliver immediate, context-aware functionality without relying on constant cloud connectivity.
We can help! Our analysts can customize this ai in electronic devices market research report to meet your requirements.
 RIA -
RIA - 
