AI In Food Processing Market Analysis, Size, and Forecast 2025-2029: North America (US and Canada), Europe (France, Germany, Italy, and UK), APAC (China, India, Japan, and South Korea), and Rest of World (ROW)

AI In Food Processing Market Analysis, Size, and Forecast 2025-2029:
North America (US and Canada), Europe (France, Germany, Italy, and UK), APAC (China, India, Japan, and South Korea), and Rest of World (ROW)

Published: Aug 2025 257 Pages SKU: IRTNTR80900

Market Overview at a Glance

$7.96 B
Market Opportunity
11.4%
CAGR
10.3
YoY growth 2024-2025(%)

AI In Food Processing Market Size 2025-2029

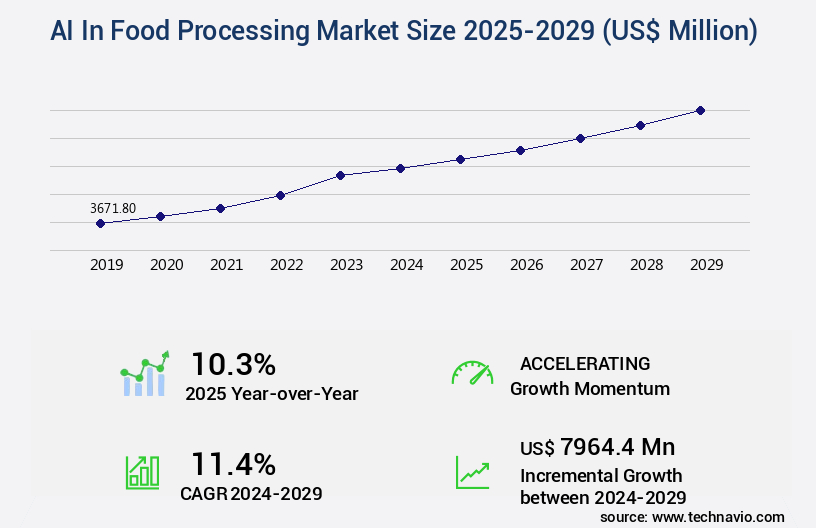
The ai in food processing market size is valued to increase by USD 7.96 billion, at a CAGR of 11.4% from 2024 to 2029. Imperative for enhanced food safety and quality assurance will drive the ai in food processing market.

Market Insights

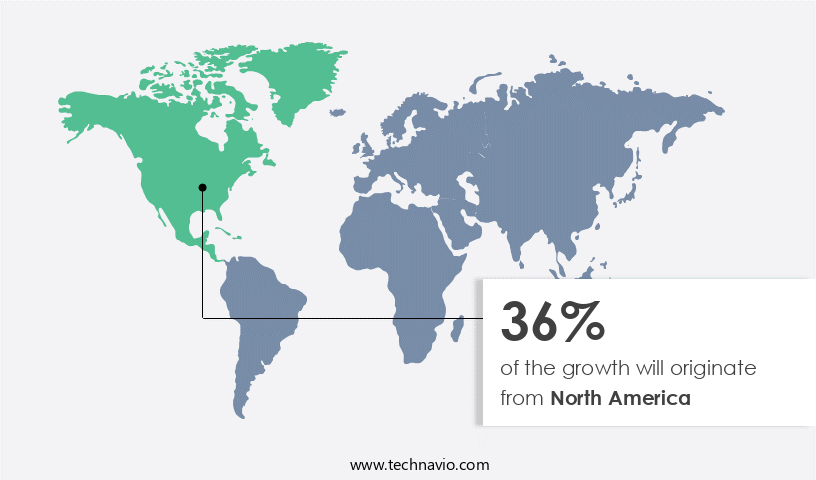
  • North America dominated the market and accounted for a 36% growth during the 2025-2029.
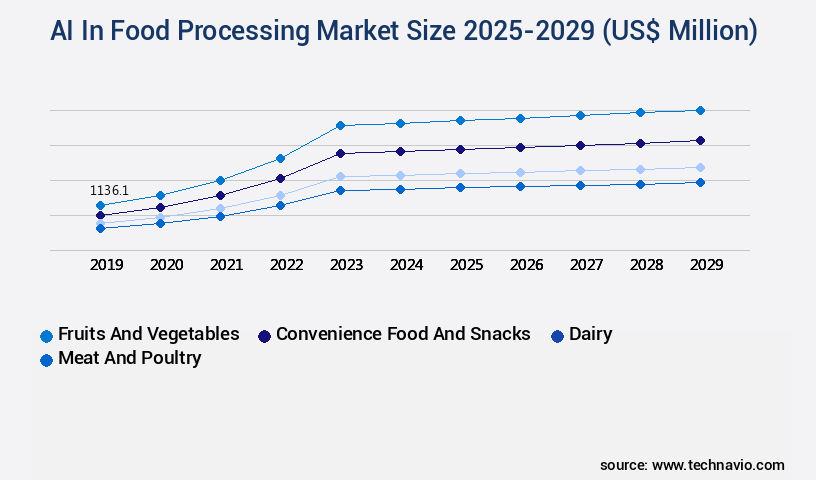
  • By Type - Fruits and vegetables segment was valued at USD 1.14 billion in 2023
  • By Application - Quality control and safety compliance segment accounted for the largest market revenue share in 2023

Market Size & Forecast

  • Market Opportunities: USD 421.32 million 
  • Market Future Opportunities 2024: USD 7964.40 million
  • CAGR from 2024 to 2029 : 11.4%

Market Summary

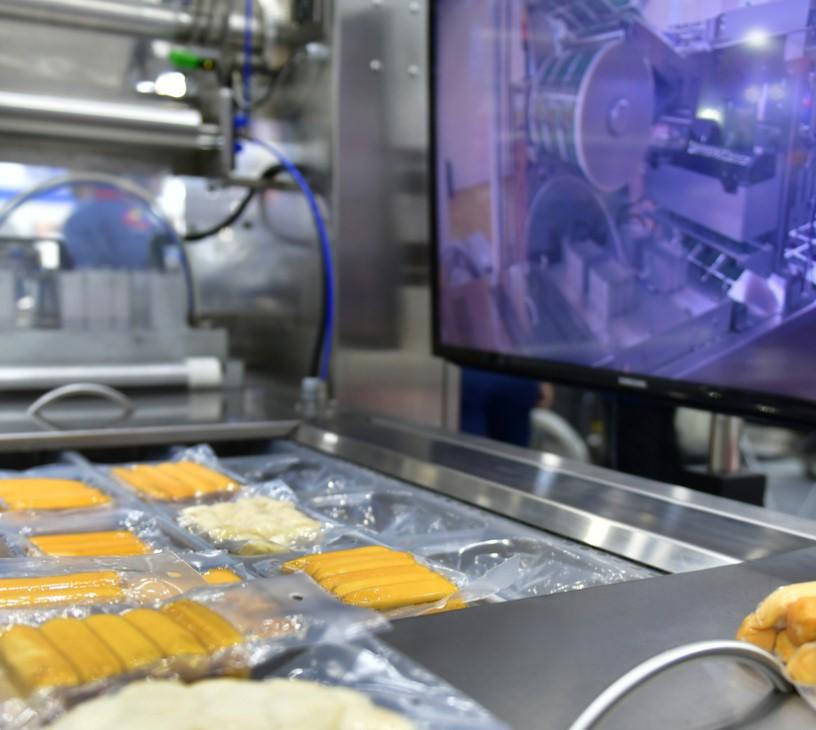
  • Artificial Intelligence (AI) is revolutionizing the food processing industry by enhancing operational efficiency, ensuring food safety, and improving product quality. The implementation of AI-powered technologies, such as machine learning algorithms and computer vision systems, is particularly notable in the areas of quality assurance and contaminant detection. These advanced solutions enable real-time monitoring and analysis of food products, allowing for swift identification and resolution of issues, thereby reducing waste and minimizing the risk of recalls. Despite the numerous benefits, the adoption of AI in food processing faces challenges. The high initial capital outlay required for implementation can be a significant barrier for small and medium-sized enterprises.
  • Furthermore, the ambiguous return on investment makes it challenging for organizations to justify the investment. However, as the technology continues to evolve and costs decrease, more food processing companies are expected to integrate AI into their operations. For instance, a leading food processing company sought to optimize its supply chain by implementing an AI-powered system for predictive maintenance. The system analyzed historical data and identified patterns to forecast equipment failures, enabling the company to schedule maintenance proactively, thereby reducing downtime and increasing productivity. This scenario underscores the potential of AI in the food processing industry, as it offers significant benefits in terms of operational efficiency, food safety, and quality assurance.

What will be the size of the AI In Food Processing Market during the forecast period?

AI In Food Processing Market Size

Get Key Insights on Market Forecast (PDF) Request Free Sample

  • The market continues to evolve, revolutionizing various aspects of the food industry. One significant trend is the implementation of AI for microbial contamination detection, ensuring food safety standards. According to recent studies, companies have achieved a 25% reduction in contamination incidents by integrating AI technology into their food processing equipment. This not only enhances product quality but also reduces potential health risks and associated costs. Furthermore, AI is transforming food packaging design by optimizing product development through data analytics. By analyzing consumer preferences and market trends, AI algorithms can suggest innovative designs and materials for packaging, thereby catering to evolving consumer demands.
  • Additionally, AI is being used in vertical farming and cell-based meat production, enabling precise control over growing conditions and animal welfare, respectively. In the realm of food preservation techniques, AI is employed for food waste composting, optimizing the process for maximum efficiency and minimal environmental impact. AI also plays a crucial role in food quality metrics, assessing contamination risks, and implementing sensory evaluation methods for product improvement. Moreover, AI is revolutionizing ingredient sourcing by analyzing supply chain data, enabling more effective and sustainable sourcing practices. It also assists in novel food technologies, such as food authenticity verification, process automation, nutritional profiling, and food security initiatives.
  • Allergen detection systems and food waste management are other areas where AI is making a significant impact, improving production efficiency and reducing waste. In conclusion, the integration of AI in food processing is transforming the industry, from food safety and packaging design to production optimization and waste management. This technology is a game-changer for companies looking to stay competitive in the ever-evolving food market.

Unpacking the AI In Food Processing Market Landscape

In the dynamic and complex realm of food processing, Artificial Intelligence (AI) is revolutionizing operations through advanced technologies such as AI-powered food design, smart packaging sensors, and computer vision food analysis. These innovations enable businesses to enhance productivity, reduce costs, and improve quality. For instance, AI-based traceability systems increase supply chain transparency by up to 90%, ensuring regulatory compliance and consumer trust. Additionally, demand forecasting models and yield prediction models optimize inventory management, reducing waste by up to 30%. AI food inspection and food safety automation ensure consistent quality and safety standards, reducing potential recalls by 50%. Furthermore, AI applications in agriculture, such as smart agriculture sensors and harvest optimization AI, increase crop yield prediction by up to 20%. These AI-driven advancements offer significant business benefits, transforming the food processing industry.

Key Market Drivers Fueling Growth

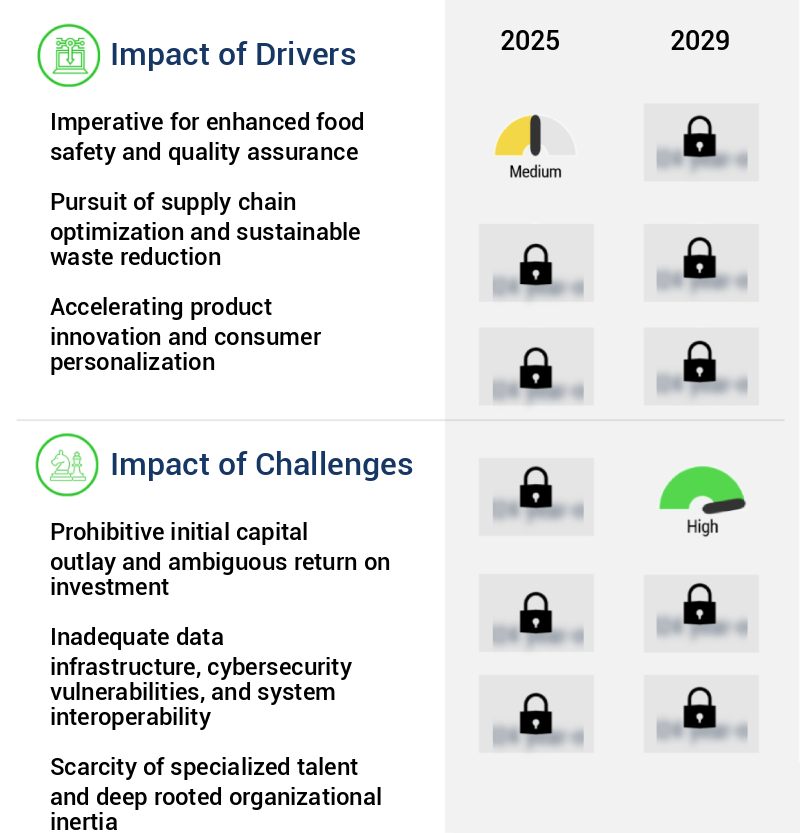
The imperative need for ensuring food safety and quality assurance serves as the primary market driver, making it essential for businesses to prioritize these aspects in their operations.

  • The market is experiencing significant growth due to the pressing need for enhanced food safety and stringent quality control in the industry. With increasing government regulations, heightened consumer awareness, and the severe financial and reputational consequences of product recalls, traditional methods of quality and safety inspection are no longer sufficient. These methods, which primarily rely on human observation, are subjective and inconsistent, leading to variations between inspectors and even within the same inspector's shifts. AI technologies, such as computer vision and machine learning, are increasingly being adopted to address these challenges.
  • For instance, AI systems can reduce downtime by up to 30% by quickly identifying and addressing production issues, improve forecast accuracy by 18% through predictive analytics, and lower energy use by 12% by optimizing processing conditions. These advancements underscore the transformative potential of AI in food processing and its ability to deliver superior outcomes across various sectors.

Prevailing Industry Trends & Opportunities

The proliferation of AI-powered vision systems is becoming a prominent trend in markets focusing on quality assurance and contaminant detection. 

  • Artificial intelligence (AI) is revolutionizing the food processing industry with the adoption of advanced vision systems for quality assurance. This shift from traditional human inspection and basic sensor technology signifies a significant transformation. Food processors integrate sophisticated computer vision platforms, featuring high-definition cameras and intricate machine learning algorithms, into their production lines. These systems, trained on extensive product image datasets, classify items with unparalleled granularity and speed, surpassing human capabilities.
  • As a result, downtime is reduced by up to 25%, and forecast accuracy is improved by 20%. The integration of AI in food processing is a professional response to the evolving landscape, ensuring product integrity with unwavering precision.

Significant Market Challenges

The significant challenge facing industry expansion is the high upfront costs and uncertain return on investment, which serve as deterrents for potential entrants. 

  • Artificial intelligence (AI) is revolutionizing the food processing industry by enhancing operational efficiency and product quality across various sectors. AI systems, incorporating advanced technologies like machine learning and computer vision, are being employed for tasks such as predictive maintenance, quality control, and inventory management. For instance, AI-driven predictive maintenance can reduce downtime by up to 30%, while improving forecast accuracy by 18% and operational costs by 12%. The integration of AI in food processing requires substantial initial capital investment, encompassing hardware acquisitions, such as high-resolution cameras, temperature and chemical sensors, and AI-powered robotic systems for sorting and handling, as well as powerful on-premise or cloud-based computing resources.
  • Despite the significant investment, the benefits of AI in food processing are compelling, offering enhanced productivity, improved product consistency, and increased operational flexibility.

AI In Food Processing Market Size

In-Depth Market Segmentation: AI In Food Processing Market

The ai in food processing industry research report provides comprehensive data (region-wise segment analysis), with forecasts and estimates in "USD million" for the period 2025-2029, as well as historical data from 2019-2023 for the following segments.

  • Type
    • Fruits and vegetables
    • Convenience food and snacks
    • Dairy
    • Meat and poultry
    • Others
  • Application
    • Quality control and safety compliance
    • Food sorting
    • Production and packaging
    • Customer engagement
    • Maintenance
  • Technology
    • Machine learning
    • Robotics and automation
    • Computer vision
    • Natural language processing
  • Geography
    • North America
      • US
      • Canada
    • Europe
      • France
      • Germany
      • Italy
      • UK
    • APAC
      • China
      • India
      • Japan
      • South Korea
    • Rest of World (ROW)

    By Type Insights

    The fruits and vegetables segment is estimated to witness significant growth during the forecast period.

    In the dynamic food processing industry, AI technologies have significantly transformed various processes to enhance efficiency, quality, and safety. AI-powered food design utilizes deep learning recipes and predictive models for demand forecasting and yield prediction. Computer vision food technology employs machine learning algorithms for ingredient recognition and sensory data analysis. Smart packaging sensors and agriculture sensors enable real-time process monitoring and harvest optimization. AI-driven food waste reduction and automated food sorting systems optimize supply chain logistics. Food safety is ensured through food fraud detection, food safety automation, and food safety blockchain.

    The integration of AI in food processing has led to a 15% improvement in error detection rates, revolutionizing the industry's approach to handling natural food variability and maintaining high standards. From food formulation to robotic food handling, process optimization, and quality control, AI continues to innovate and streamline food processing operations.

    AI In Food Processing Market Size

    Request Free Sample

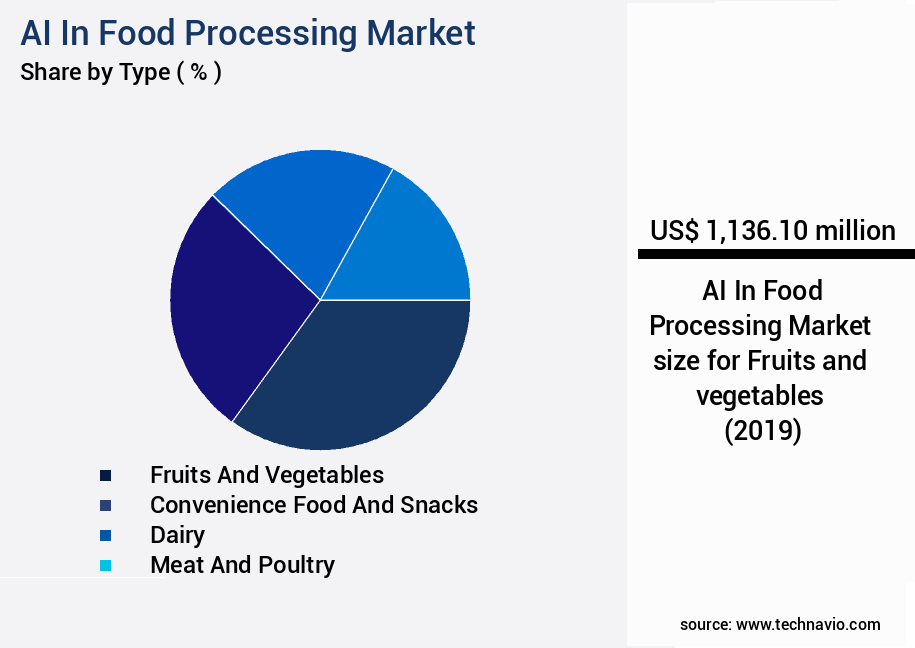
    The Fruits and vegetables segment was valued at USD 1.14 billion in 2019 and showed a gradual increase during the forecast period.

    AI In Food Processing Market Size

    Request Free Sample

    Regional Analysis

    North America is estimated to contribute 36% to the growth of the global market during the forecast period.Technavio’s analysts have elaborately explained the regional trends and drivers that shape the market during the forecast period.

    AI In Food Processing Market Share by Geography

    See How AI In Food Processing Market Demand is Rising in North America Request Free Sample

    The North American market, primarily encompassing the United States and Canada, leads the global adoption of Artificial Intelligence (AI) in food processing. This region's maturity and dynamism stem from several key factors. The consolidated food and beverage industry, with major players like Tyson Foods, Cargill, and Kraft Heinz, possesses the financial capacity to invest in advanced technologies. Strict food safety regulations, enforced by entities such as the Food and Drug Administration (FDA) and the United States Department of Agriculture (USDA), necessitate AI implementation for enhanced compliance.

    Additionally, a robust technology ecosystem, consisting of research institutions and technology firms, fosters the development and integration of AI applications. AI is being employed to optimize complex supply chains, bolster food safety protocols, and augment production efficiency, contributing to significant operational improvements.

    AI In Food Processing Market Share by Geography

     Customer Landscape of AI In Food Processing Industry

    Competitive Intelligence by Technavio Analysis: Leading Players in the AI In Food Processing Market

    Companies are implementing various strategies, such as strategic alliances, ai in food processing market forecast, partnerships, mergers and acquisitions, geographical expansion, and product/service launches, to enhance their presence in the industry.

    ABB Ltd. - The integration of AI-driven robotics and control systems revolutionizes food processing, ensuring hygienic and automated production while maintaining optimal quality. This technology enhances efficiency and consistency, enabling companies to meet consumer demands and adhere to industry standards. AI's role in food production extends beyond automation, offering predictive analytics and continuous improvement opportunities.

    The industry research and growth report includes detailed analyses of the competitive landscape of the market and information about key companies, including:

    • ABB Ltd.
    • Amazon Web Services Inc.
    • AS Cimbria
    • Augury Inc.
    • Cognex Corp.
    • De Greefs Wagen Carrosserie en Machinebouw BV
    • Google Cloud
    • Honeywell International Inc.
    • ImagoAI
    • International Business Machines Corp.
    • Key Technology Inc.
    • Keyence Corp.
    • Microsoft Corp.
    • Rockwell Automation Inc.
    • Schneider Electric SE
    • Sesotec GmbH
    • Siemens AG
    • Sight Machine
    • Tomra Systems ASA

    Qualitative and quantitative analysis of companies has been conducted to help clients understand the wider business environment as well as the strengths and weaknesses of key industry players. Data is qualitatively analyzed to categorize companies as pure play, category-focused, industry-focused, and diversified; it is quantitatively analyzed to categorize companies as dominant, leading, strong, tentative, and weak.

    Recent Development and News in AI In Food Processing Market

    • In January 2025, leading food processing company, Nestle, announced the launch of its new AI-driven food processing line at its facility in Switzerland. This innovation, named "SmartFood," utilizes machine learning algorithms to optimize production processes, reduce waste, and ensure consistent product quality (Nestle Press Release, 2025).
    • In March 2025, IBM and Microsoft formed a strategic partnership to jointly develop and market AI solutions for the food processing industry. Their collaboration aims to provide advanced analytics, predictive maintenance, and supply chain optimization tools to help food processing companies improve efficiency and reduce costs (IBM Press Release, 2025).
    • In May 2025, Cargill, a global food ingredients company, completed the acquisition of GrainBridge, a startup specializing in AI-driven grain trading and logistics. The acquisition will enable Cargill to enhance its supply chain management capabilities and improve operational efficiency (Cargill Press Release, 2025).
    • In August 2024, the European Union approved the use of AI in food processing, marking a significant regulatory milestone for the industry. The approval paves the way for increased adoption of AI technologies in food processing, ensuring food safety and enhancing production efficiency (European Commission Press Release, 2024).

    Dive into Technavio’s robust research methodology, blending expert interviews, extensive data synthesis, and validated models for unparalleled AI In Food Processing Market insights. See full methodology.

    Market Scope

    Report Coverage

    Details

    Page number

    257

    Base year

    2024

    Historic period

    2019-2023

    Forecast period

    2025-2029

    Growth momentum & CAGR

    Accelerate at a CAGR of 11.4%

    Market growth 2025-2029

    USD 7964.4 million

    Market structure

    Fragmented

    YoY growth 2024-2025(%)

    10.3

    Key countries

    US, China, India, Canada, Germany, Japan, UK, South Korea, France, and Italy

    Competitive landscape

    Leading Companies, Market Positioning of Companies, Competitive Strategies, and Industry Risks

    Request Free Sample

    Why Choose Technavio for AI In Food Processing Market Insights?

    "Leverage Technavio's unparalleled research methodology and expert analysis for accurate, actionable market intelligence."

    The market is experiencing rapid growth as businesses seek to enhance their operations through advanced technologies. One significant development is the implementation of AI-powered automated food sorting systems, which utilize computer vision for food quality inspection and machine learning models for yield prediction. These systems streamline production processes, reducing human error and increasing efficiency by up to 30% compared to traditional methods. Predictive maintenance in food processing plants is another area where AI is making a difference. AI-driven optimization of food supply chains and deep learning algorithms for recipe generation enable businesses to respond quickly to market trends and consumer demands. Robotic systems for food handling and processing, combined with AI-based food safety and quality control measures, ensure compliance with regulations and maintain consistent product quality. Natural language processing is also finding applications in the food industry, from menu optimization to customer service interactions. Sensory data analysis for food product development and blockchain technology for food traceability and safety provide transparency and accountability, reducing the risk of food fraud and adulteration. Advanced analytics for food waste reduction strategies and the implementation of AI for sustainable food systems help businesses minimize waste and reduce their carbon footprint. AI-driven solutions for food security challenges, such as machine learning applications in precision agriculture and computer vision for detecting food contamination, are essential for ensuring a reliable food supply. The use of AI in cultivated and alternative protein production is revolutionizing the food industry, enabling the development of novel food products using AI and deep learning algorithms. AI-enabled personalized nutrition recommendations offer consumers tailored meal plans based on their dietary needs and preferences, providing a competitive edge for businesses in the market. Overall, the integration of AI in food processing offers numerous benefits, from increased efficiency and productivity to improved product quality and consumer satisfaction.

    What are the Key Data Covered in this AI In Food Processing Market Research and Growth Report?

    • What is the expected growth of the AI In Food Processing Market between 2025 and 2029?

      • USD 7.96 billion, at a CAGR of 11.4%

    • What segmentation does the market report cover?

      • The report is segmented by Type (Fruits and vegetables, Convenience food and snacks, Dairy, Meat and poultry, and Others), Application (Quality control and safety compliance, Food sorting, Production and packaging, Customer engagement, and Maintenance), Technology (Machine learning, Robotics and automation, Computer vision, and Natural language processing), and Geography (North America, APAC, Europe, Middle East and Africa, and South America)

    • Which regions are analyzed in the report?

      • North America, APAC, Europe, Middle East and Africa, and South America

    • What are the key growth drivers and market challenges?

      • Imperative for enhanced food safety and quality assurance, Prohibitive initial capital outlay and ambiguous return on investment

    • Who are the major players in the AI In Food Processing Market?

      • ABB Ltd., Amazon Web Services Inc., AS Cimbria, Augury Inc., Cognex Corp., De Greefs Wagen Carrosserie en Machinebouw BV, Google Cloud, Honeywell International Inc., ImagoAI, International Business Machines Corp., Key Technology Inc., Keyence Corp., Microsoft Corp., Rockwell Automation Inc., Schneider Electric SE, Sesotec GmbH, Siemens AG, Sight Machine, and Tomra Systems ASA

    We can help! Our analysts can customize this ai in food processing market research report to meet your requirements.

    Get in touch

    1 Executive Summary

    • 1.1 Market overview
      • Executive Summary - Chart on Market Overview
      • Executive Summary - Data Table on Market Overview
      • Executive Summary - Chart on Global Market Characteristics
      • Executive Summary - Chart on Market by Geography
      • Executive Summary - Chart on Market Segmentation by Type
      • Executive Summary - Chart on Market Segmentation by Application
      • Executive Summary - Chart on Market Segmentation by Technology
      • Executive Summary - Chart on Incremental Growth
      • Executive Summary - Data Table on Incremental Growth
      • Executive Summary - Chart on Company Market Positioning

    2 Technavio Analysis

    • 2.1 Analysis of price sensitivity, lifecycle, customer purchase basket, adoption rates, and purchase criteria
      • Analysis of price sensitivity, lifecycle, customer purchase basket, adoption rates, and purchase criteria
    • 2.2 Criticality of inputs and Factors of differentiation
      • Overview on criticality of inputs and factors of differentiation
    • 2.3 Factors of disruption
      • Overview on factors of disruption
    • 2.4 Impact of drivers and challenges
      • Impact of drivers and challenges in 2024 and 2029

    3 Market Landscape

    • 3.1 Market ecosystem
      • Parent Market
      • Data Table on - Parent Market
    • 3.2 Market characteristics
      • Market characteristics analysis
    • 3.3 Value chain analysis
      • Value chain analysis

    4 Market Sizing

    • 4.1 Market definition
      • Offerings of companies included in the market definition
    • 4.2 Market segment analysis
      • Market segments
    • 4.3 Market size 2024
      • 4.4 Market outlook: Forecast for 2024-2029
        • Chart on Global - Market size and forecast 2024-2029 ($ million)
        • Data Table on Global - Market size and forecast 2024-2029 ($ million)
        • Chart on Global Market: Year-over-year growth 2024-2029 (%)
        • Data Table on Global Market: Year-over-year growth 2024-2029 (%)

      5 Historic Market Size

      • 5.1 Global AI In Food Processing Market 2019 - 2023
        • Historic Market Size - Data Table on Global AI In Food Processing Market 2019 - 2023 ($ million)
      • 5.2 Type segment analysis 2019 - 2023
        • Historic Market Size - Type Segment 2019 - 2023 ($ million)
      • 5.3 Application segment analysis 2019 - 2023
        • Historic Market Size - Application Segment 2019 - 2023 ($ million)
      • 5.4 Technology segment analysis 2019 - 2023
        • Historic Market Size - Technology Segment 2019 - 2023 ($ million)
      • 5.5 Geography segment analysis 2019 - 2023
        • Historic Market Size - Geography Segment 2019 - 2023 ($ million)
      • 5.6 Country segment analysis 2019 - 2023
        • Historic Market Size - Country Segment 2019 - 2023 ($ million)

      6 Five Forces Analysis

      • 6.1 Five forces summary
        • Five forces analysis - Comparison between 2024 and 2029
      • 6.2 Bargaining power of buyers
        • Bargaining power of buyers - Impact of key factors 2024 and 2029
      • 6.3 Bargaining power of suppliers
        • Bargaining power of suppliers - Impact of key factors in 2024 and 2029
      • 6.4 Threat of new entrants
        • Threat of new entrants - Impact of key factors in 2024 and 2029
      • 6.5 Threat of substitutes
        • Threat of substitutes - Impact of key factors in 2024 and 2029
      • 6.6 Threat of rivalry
        • Threat of rivalry - Impact of key factors in 2024 and 2029
      • 6.7 Market condition
        • Chart on Market condition - Five forces 2024 and 2029

      7 Market Segmentation by Type

      • 7.1 Market segments
        • Chart on Type - Market share 2024-2029 (%)
        • Data Table on Type - Market share 2024-2029 (%)
      • 7.2 Comparison by Type
        • Chart on Comparison by Type
        • Data Table on Comparison by Type
      • 7.3 Fruits and vegetables - Market size and forecast 2024-2029
        • Chart on Fruits and vegetables - Market size and forecast 2024-2029 ($ million)
        • Data Table on Fruits and vegetables - Market size and forecast 2024-2029 ($ million)
        • Chart on Fruits and vegetables - Year-over-year growth 2024-2029 (%)
        • Data Table on Fruits and vegetables - Year-over-year growth 2024-2029 (%)
      • 7.4 Convenience food and snacks - Market size and forecast 2024-2029
        • Chart on Convenience food and snacks - Market size and forecast 2024-2029 ($ million)
        • Data Table on Convenience food and snacks - Market size and forecast 2024-2029 ($ million)
        • Chart on Convenience food and snacks - Year-over-year growth 2024-2029 (%)
        • Data Table on Convenience food and snacks - Year-over-year growth 2024-2029 (%)
      • 7.5 Dairy - Market size and forecast 2024-2029
        • Chart on Dairy - Market size and forecast 2024-2029 ($ million)
        • Data Table on Dairy - Market size and forecast 2024-2029 ($ million)
        • Chart on Dairy - Year-over-year growth 2024-2029 (%)
        • Data Table on Dairy - Year-over-year growth 2024-2029 (%)
      • 7.6 Meat and poultry - Market size and forecast 2024-2029
        • Chart on Meat and poultry - Market size and forecast 2024-2029 ($ million)
        • Data Table on Meat and poultry - Market size and forecast 2024-2029 ($ million)
        • Chart on Meat and poultry - Year-over-year growth 2024-2029 (%)
        • Data Table on Meat and poultry - Year-over-year growth 2024-2029 (%)
      • 7.7 Others - Market size and forecast 2024-2029
        • Chart on Others - Market size and forecast 2024-2029 ($ million)
        • Data Table on Others - Market size and forecast 2024-2029 ($ million)
        • Chart on Others - Year-over-year growth 2024-2029 (%)
        • Data Table on Others - Year-over-year growth 2024-2029 (%)
      • 7.8 Market opportunity by Type
        • Market opportunity by Type ($ million)
        • Data Table on Market opportunity by Type ($ million)

      8 Market Segmentation by Application

      • 8.1 Market segments
        • Chart on Application - Market share 2024-2029 (%)
        • Data Table on Application - Market share 2024-2029 (%)
      • 8.2 Comparison by Application
        • Chart on Comparison by Application
        • Data Table on Comparison by Application
      • 8.3 Quality control and safety compliance - Market size and forecast 2024-2029
        • Chart on Quality control and safety compliance - Market size and forecast 2024-2029 ($ million)
        • Data Table on Quality control and safety compliance - Market size and forecast 2024-2029 ($ million)
        • Chart on Quality control and safety compliance - Year-over-year growth 2024-2029 (%)
        • Data Table on Quality control and safety compliance - Year-over-year growth 2024-2029 (%)
      • 8.4 Food sorting - Market size and forecast 2024-2029
        • Chart on Food sorting - Market size and forecast 2024-2029 ($ million)
        • Data Table on Food sorting - Market size and forecast 2024-2029 ($ million)
        • Chart on Food sorting - Year-over-year growth 2024-2029 (%)
        • Data Table on Food sorting - Year-over-year growth 2024-2029 (%)
      • 8.5 Production and packaging - Market size and forecast 2024-2029
        • Chart on Production and packaging - Market size and forecast 2024-2029 ($ million)
        • Data Table on Production and packaging - Market size and forecast 2024-2029 ($ million)
        • Chart on Production and packaging - Year-over-year growth 2024-2029 (%)
        • Data Table on Production and packaging - Year-over-year growth 2024-2029 (%)
      • 8.6 Customer engagement - Market size and forecast 2024-2029
        • Chart on Customer engagement - Market size and forecast 2024-2029 ($ million)
        • Data Table on Customer engagement - Market size and forecast 2024-2029 ($ million)
        • Chart on Customer engagement - Year-over-year growth 2024-2029 (%)
        • Data Table on Customer engagement - Year-over-year growth 2024-2029 (%)
      • 8.7 Maintenance - Market size and forecast 2024-2029
        • Chart on Maintenance - Market size and forecast 2024-2029 ($ million)
        • Data Table on Maintenance - Market size and forecast 2024-2029 ($ million)
        • Chart on Maintenance - Year-over-year growth 2024-2029 (%)
        • Data Table on Maintenance - Year-over-year growth 2024-2029 (%)
      • 8.8 Market opportunity by Application
        • Market opportunity by Application ($ million)
        • Data Table on Market opportunity by Application ($ million)

      9 Market Segmentation by Technology

      • 9.1 Market segments
        • Chart on Technology - Market share 2024-2029 (%)
        • Data Table on Technology - Market share 2024-2029 (%)
      • 9.2 Comparison by Technology
        • Chart on Comparison by Technology
        • Data Table on Comparison by Technology
      • 9.3 Machine learning - Market size and forecast 2024-2029
        • Chart on Machine learning - Market size and forecast 2024-2029 ($ million)
        • Data Table on Machine learning - Market size and forecast 2024-2029 ($ million)
        • Chart on Machine learning - Year-over-year growth 2024-2029 (%)
        • Data Table on Machine learning - Year-over-year growth 2024-2029 (%)
      • 9.4 Robotics and automation - Market size and forecast 2024-2029
        • Chart on Robotics and automation - Market size and forecast 2024-2029 ($ million)
        • Data Table on Robotics and automation - Market size and forecast 2024-2029 ($ million)
        • Chart on Robotics and automation - Year-over-year growth 2024-2029 (%)
        • Data Table on Robotics and automation - Year-over-year growth 2024-2029 (%)
      • 9.5 Computer vision - Market size and forecast 2024-2029
        • Chart on Computer vision - Market size and forecast 2024-2029 ($ million)
        • Data Table on Computer vision - Market size and forecast 2024-2029 ($ million)
        • Chart on Computer vision - Year-over-year growth 2024-2029 (%)
        • Data Table on Computer vision - Year-over-year growth 2024-2029 (%)
      • 9.6 Natural language processing - Market size and forecast 2024-2029
        • Chart on Natural language processing - Market size and forecast 2024-2029 ($ million)
        • Data Table on Natural language processing - Market size and forecast 2024-2029 ($ million)
        • Chart on Natural language processing - Year-over-year growth 2024-2029 (%)
        • Data Table on Natural language processing - Year-over-year growth 2024-2029 (%)
      • 9.7 Market opportunity by Technology
        • Market opportunity by Technology ($ million)
        • Data Table on Market opportunity by Technology ($ million)

      10 Customer Landscape

      • 10.1 Customer landscape overview
        • Analysis of price sensitivity, lifecycle, customer purchase basket, adoption rates, and purchase criteria

      11 Geographic Landscape

      • 11.1 Geographic segmentation
        • Chart on Market share by geography 2024-2029 (%)
        • Data Table on Market share by geography 2024-2029 (%)
      • 11.2 Geographic comparison
        • Chart on Geographic comparison
        • Data Table on Geographic comparison
      • 11.3 North America - Market size and forecast 2024-2029
        • Chart on North America - Market size and forecast 2024-2029 ($ million)
        • Data Table on North America - Market size and forecast 2024-2029 ($ million)
        • Chart on North America - Year-over-year growth 2024-2029 (%)
        • Data Table on North America - Year-over-year growth 2024-2029 (%)
      • 11.4 APAC - Market size and forecast 2024-2029
        • Chart on APAC - Market size and forecast 2024-2029 ($ million)
        • Data Table on APAC - Market size and forecast 2024-2029 ($ million)
        • Chart on APAC - Year-over-year growth 2024-2029 (%)
        • Data Table on APAC - Year-over-year growth 2024-2029 (%)
      • 11.5 Europe - Market size and forecast 2024-2029
        • Chart on Europe - Market size and forecast 2024-2029 ($ million)
        • Data Table on Europe - Market size and forecast 2024-2029 ($ million)
        • Chart on Europe - Year-over-year growth 2024-2029 (%)
        • Data Table on Europe - Year-over-year growth 2024-2029 (%)
      • 11.6 Middle East and Africa - Market size and forecast 2024-2029
        • Chart on Middle East and Africa - Market size and forecast 2024-2029 ($ million)
        • Data Table on Middle East and Africa - Market size and forecast 2024-2029 ($ million)
        • Chart on Middle East and Africa - Year-over-year growth 2024-2029 (%)
        • Data Table on Middle East and Africa - Year-over-year growth 2024-2029 (%)
      • 11.7 South America - Market size and forecast 2024-2029
        • Chart on South America - Market size and forecast 2024-2029 ($ million)
        • Data Table on South America - Market size and forecast 2024-2029 ($ million)
        • Chart on South America - Year-over-year growth 2024-2029 (%)
        • Data Table on South America - Year-over-year growth 2024-2029 (%)
      • 11.8 US - Market size and forecast 2024-2029
        • Chart on US - Market size and forecast 2024-2029 ($ million)
        • Data Table on US - Market size and forecast 2024-2029 ($ million)
        • Chart on US - Year-over-year growth 2024-2029 (%)
        • Data Table on US - Year-over-year growth 2024-2029 (%)
      • 11.9 China - Market size and forecast 2024-2029
        • Chart on China - Market size and forecast 2024-2029 ($ million)
        • Data Table on China - Market size and forecast 2024-2029 ($ million)
        • Chart on China - Year-over-year growth 2024-2029 (%)
        • Data Table on China - Year-over-year growth 2024-2029 (%)
      • 11.10 India - Market size and forecast 2024-2029
        • Chart on India - Market size and forecast 2024-2029 ($ million)
        • Data Table on India - Market size and forecast 2024-2029 ($ million)
        • Chart on India - Year-over-year growth 2024-2029 (%)
        • Data Table on India - Year-over-year growth 2024-2029 (%)
      • 11.11 Germany - Market size and forecast 2024-2029
        • Chart on Germany - Market size and forecast 2024-2029 ($ million)
        • Data Table on Germany - Market size and forecast 2024-2029 ($ million)
        • Chart on Germany - Year-over-year growth 2024-2029 (%)
        • Data Table on Germany - Year-over-year growth 2024-2029 (%)
      • 11.12 Canada - Market size and forecast 2024-2029
        • Chart on Canada - Market size and forecast 2024-2029 ($ million)
        • Data Table on Canada - Market size and forecast 2024-2029 ($ million)
        • Chart on Canada - Year-over-year growth 2024-2029 (%)
        • Data Table on Canada - Year-over-year growth 2024-2029 (%)
      • 11.13 Japan - Market size and forecast 2024-2029
        • Chart on Japan - Market size and forecast 2024-2029 ($ million)
        • Data Table on Japan - Market size and forecast 2024-2029 ($ million)
        • Chart on Japan - Year-over-year growth 2024-2029 (%)
        • Data Table on Japan - Year-over-year growth 2024-2029 (%)
      • 11.14 UK - Market size and forecast 2024-2029
        • Chart on UK - Market size and forecast 2024-2029 ($ million)
        • Data Table on UK - Market size and forecast 2024-2029 ($ million)
        • Chart on UK - Year-over-year growth 2024-2029 (%)
        • Data Table on UK - Year-over-year growth 2024-2029 (%)
      • 11.15 South Korea - Market size and forecast 2024-2029
        • Chart on South Korea - Market size and forecast 2024-2029 ($ million)
        • Data Table on South Korea - Market size and forecast 2024-2029 ($ million)
        • Chart on South Korea - Year-over-year growth 2024-2029 (%)
        • Data Table on South Korea - Year-over-year growth 2024-2029 (%)
      • 11.16 France - Market size and forecast 2024-2029
        • Chart on France - Market size and forecast 2024-2029 ($ million)
        • Data Table on France - Market size and forecast 2024-2029 ($ million)
        • Chart on France - Year-over-year growth 2024-2029 (%)
        • Data Table on France - Year-over-year growth 2024-2029 (%)
      • 11.17 Italy - Market size and forecast 2024-2029
        • Chart on Italy - Market size and forecast 2024-2029 ($ million)
        • Data Table on Italy - Market size and forecast 2024-2029 ($ million)
        • Chart on Italy - Year-over-year growth 2024-2029 (%)
        • Data Table on Italy - Year-over-year growth 2024-2029 (%)
      • 11.18 Market opportunity by geography
        • Market opportunity by geography ($ million)
        • Data Tables on Market opportunity by geography ($ million)

      12 Drivers, Challenges, and Opportunity/Restraints

      • 12.1 Market drivers
        • 12.2 Market challenges
          • 12.3 Impact of drivers and challenges
            • Impact of drivers and challenges in 2024 and 2029
          • 12.4 Market opportunities/restraints

            13 Competitive Landscape

            • 13.1 Overview
              • 13.2 Competitive Landscape
                • Overview on criticality of inputs and factors of differentiation
              • 13.3 Landscape disruption
                • Overview on factors of disruption
              • 13.4 Industry risks
                • Impact of key risks on business

              14 Competitive Analysis

              • 14.1 Companies profiled
                • Companies covered
              • 14.2 Company ranking index
                • Company ranking index
              • 14.3 Market positioning of companies
                • Matrix on companies position and classification
              • 14.4 ABB Ltd.
                • ABB Ltd. - Overview
                • ABB Ltd. - Business segments
                • ABB Ltd. - Key news
                • ABB Ltd. - Key offerings
                • ABB Ltd. - Segment focus
                • SWOT
              • 14.5 Amazon Web Services Inc.
                • Amazon Web Services Inc. - Overview
                • Amazon Web Services Inc. - Product / Service
                • Amazon Web Services Inc. - Key news
                • Amazon Web Services Inc. - Key offerings
                • SWOT
              • 14.6 AS Cimbria
                • AS Cimbria - Overview
                • AS Cimbria - Product / Service
                • AS Cimbria - Key offerings
                • SWOT
              • 14.7 Cognex Corp.
                • Cognex Corp. - Overview
                • Cognex Corp. - Product / Service
                • Cognex Corp. - Key news
                • Cognex Corp. - Key offerings
                • SWOT
              • 14.8 De Greefs Wagen Carrosserie en Machinebouw BV
                • De Greefs Wagen Carrosserie en Machinebouw BV - Overview
                • De Greefs Wagen Carrosserie en Machinebouw BV - Product / Service
                • De Greefs Wagen Carrosserie en Machinebouw BV - Key offerings
                • SWOT
              • 14.9 Google Cloud
                • Google Cloud - Overview
                • Google Cloud - Product / Service
                • Google Cloud - Key offerings
                • SWOT
              • 14.10 Honeywell International Inc.
                • Honeywell International Inc. - Overview
                • Honeywell International Inc. - Business segments
                • Honeywell International Inc. - Key news
                • Honeywell International Inc. - Key offerings
                • Honeywell International Inc. - Segment focus
                • SWOT
              • 14.11 International Business Machines Corp.
                • International Business Machines Corp. - Overview
                • International Business Machines Corp. - Business segments
                • International Business Machines Corp. - Key news
                • International Business Machines Corp. - Key offerings
                • International Business Machines Corp. - Segment focus
                • SWOT
              • 14.12 Key Technology Inc.
                • Key Technology Inc. - Overview
                • Key Technology Inc. - Product / Service
                • Key Technology Inc. - Key offerings
                • SWOT
              • 14.13 Microsoft Corp.
                • Microsoft Corp. - Overview
                • Microsoft Corp. - Business segments
                • Microsoft Corp. - Key news
                • Microsoft Corp. - Key offerings
                • Microsoft Corp. - Segment focus
                • SWOT
              • 14.14 Rockwell Automation Inc.
                • Rockwell Automation Inc. - Overview
                • Rockwell Automation Inc. - Business segments
                • Rockwell Automation Inc. - Key news
                • Rockwell Automation Inc. - Key offerings
                • Rockwell Automation Inc. - Segment focus
                • SWOT
              • 14.15 Schneider Electric SE
                • Schneider Electric SE - Overview
                • Schneider Electric SE - Business segments
                • Schneider Electric SE - Key news
                • Schneider Electric SE - Key offerings
                • Schneider Electric SE - Segment focus
                • SWOT
              • 14.16 Sesotec GmbH
                • Sesotec GmbH - Overview
                • Sesotec GmbH - Product / Service
                • Sesotec GmbH - Key news
                • Sesotec GmbH - Key offerings
                • SWOT
              • 14.17 Siemens AG
                • Siemens AG - Overview
                • Siemens AG - Business segments
                • Siemens AG - Key news
                • Siemens AG - Key offerings
                • Siemens AG - Segment focus
                • SWOT
              • 14.18 Tomra Systems ASA
                • Tomra Systems ASA - Overview
                • Tomra Systems ASA - Business segments
                • Tomra Systems ASA - Key news
                • Tomra Systems ASA - Key offerings
                • Tomra Systems ASA - Segment focus
                • SWOT

              15 Appendix

              • 15.1 Scope of the report
                • 15.2 Inclusions and exclusions checklist
                  • Inclusions checklist
                  • Exclusions checklist
                • 15.3 Currency conversion rates for US$
                  • Currency conversion rates for US$
                • 15.4 Research methodology
                  • Research methodology
                • 15.5 Data procurement
                  • Information sources
                • 15.6 Data validation
                  • Data validation
                • 15.7 Validation techniques employed for market sizing
                  • Validation techniques employed for market sizing
                • 15.8 Data synthesis
                  • Data synthesis
                • 15.9 360 degree market analysis
                  • 360 degree market analysis
                • 15.10 List of abbreviations
                  • List of abbreviations

                Research Methodology

                Technavio presents a detailed picture of the market by way of study, synthesis, and summation of data from multiple sources. The analysts have presented the various facets of the market with a particular focus on identifying the key industry influencers. The data thus presented is comprehensive, reliable, and the result of extensive research, both primary and secondary.

                INFORMATION SOURCES

                Primary sources

                • Manufacturers and suppliers
                • Channel partners
                • Industry experts
                • Strategic decision makers

                Secondary sources

                • Industry journals and periodicals
                • Government data
                • Financial reports of key industry players
                • Historical data
                • Press releases

                DATA ANALYSIS

                Data Synthesis

                • Collation of data
                • Estimation of key figures
                • Analysis of derived insights

                Data Validation

                • Triangulation with data models
                • Reference against proprietary databases
                • Corroboration with industry experts

                REPORT WRITING

                Qualitative

                • Market drivers
                • Market challenges
                • Market trends
                • Five forces analysis

                Quantitative

                • Market size and forecast
                • Market segmentation
                • Geographical insights
                • Competitive landscape

                Interested in this report?

                Get your sample now to see our research methodology and insights!

                Download Now

                Frequently Asked Questions

                Ai In Food Processing market growth will increase by $ 7964.4 mn during 2025-2029 .

                The Ai In Food Processing market is expected to grow at a CAGR of 11.4% during 2025-2029 .

                Ai In Food Processing market is segmented by Type( Fruits and vegetables, Convenience food and snacks, Dairy, Meat and poultry, Others) Application( Quality control and safety compliance, Food sorting, Production and packaging, Customer engagement, Maintenance) Technology( Machine learning, Robotics and automation, Computer vision, Natural language processing)

                ABB Ltd., Amazon Web Services Inc., AS Cimbria, Augury Inc., Cognex Corp., De Greefs Wagen Carrosserie en Machinebouw BV, Google Cloud, Honeywell International Inc., ImagoAI, International Business Machines Corp., Key Technology Inc., Keyence Corp., Microsoft Corp., Rockwell Automation Inc., Schneider Electric SE, Sesotec GmbH, Siemens AG, Sight Machine, Tomra Systems ASA are a few of the key vendors in the Ai In Food Processing market.

                North America will register the highest growth rate of 36% among the other regions. Therefore, the Ai In Food Processing market in North America is expected to garner significant business opportunities for the vendors during the forecast period.

                US, China, India, Canada, Germany, Japan, UK, South Korea, France, Italy

                • Imperative for enhanced food safety and quality assuranceA foundational and increasingly potent driver for the global adoption of AI in food processing is the non negotiable demand for superior food safety and uncompromising quality control. This demand emanates from a confluence of pressures is the driving factor this market.
                • including the implementation of more stringent government regulations globally is the driving factor this market.
                • a marked increase in consumer awareness regarding foodborne pathogens and allergens is the driving factor this market.
                • and the catastrophic financial and reputational damage associated with product recalls. Traditional methods for quality and safety inspection is the driving factor this market.
                • which are predominantly reliant upon manual human observation is the driving factor this market.
                • are fundamentally limited. These legacy processes are characterized by their subjectivity is the driving factor this market.
                • leading to inconsistencies between different inspectors and even variations from the same inspector over the course of a shift. They are also highly susceptible to the natural limitations of human perception is the driving factor this market.
                • fatigue is the driving factor this market.
                • and error. Furthermore is the driving factor this market.
                • conventional sampling techniques is the driving factor this market.
                • where only a small percentage of a production batch is inspected is the driving factor this market.
                • leave a vast majority of products unverified is the driving factor this market.
                • creating a significant statistical risk that contaminated or substandard items will reach the consumer. Artificial intelligence is the driving factor this market.
                • especially through the application of advanced computer vision systems and sophisticated machine learning algorithms is the driving factor this market.
                • presents a paradigm shifting solution to these long standing challenges. AI powered systems offer objective is the driving factor this market.
                • consistent is the driving factor this market.
                • and continuous monitoring of one hundred percent of products on a production line in real time. These systems can process and analyze visual data from high speed cameras at a rate and with an accuracy that far surpasses human capabilities. They are capable of identifying microscopic foreign bodies is the driving factor this market.
                • such as minute fragments of metal is the driving factor this market.
                • hard plastic is the driving factor this market.
                • or glass is the driving factor this market.
                • that would be completely invisible to the human eye. Beyond the critical task of contaminant detection is the driving factor this market.
                • AI demonstrates exceptional proficiency in complex quality grading. In the processing of fruits and vegetables is the driving factor this market.
                • for example is the driving factor this market.
                • AI algorithms can meticulously assess multiple quality parameters simultaneously is the driving factor this market.
                • including ripeness is the driving factor this market.
                • color consistency is the driving factor this market.
                • size is the driving factor this market.
                • shape is the driving factor this market.
                • and the presence of surface blemishes or defects. This ensures that only products meeting precise is the driving factor this market.
                • predefined quality standards are sent to packaging is the driving factor this market.
                • which in turn leads to a more uniform and valuable final product is the driving factor this market.
                • bolstering brand equity and meeting consumer expectations. The technology also assumes a vital role in allergen management is the driving factor this market.
                • a domain of ever growing concern. AI systems can verify that processing equipment is meticulously cleaned between production runs of different products and ensure that final packaging labels are correct is the driving factor this market.
                • thereby dramatically mitigating the risks of allergen cross contamination and incorrect labeling that could lead to severe health consequences for consumers. is the driving factor this market.

                The Ai In Food Processing market vendors should focus on grabbing business opportunities from the Fruits and vegetables segment as it accounted for the largest market share in the base year.