AI In Geospatial Technology Market Analysis, Size, and Forecast 2025-2029: North America (US and Canada), APAC (China, India, and Japan), Europe (Germany, UK, and France), Middle East and Africa (Saudi Arabia and UAE), South America (Brazil and Argentina), and Rest of World (ROW)

AI In Geospatial Technology Market Analysis, Size, and Forecast 2025-2029:
North America (US and Canada), APAC (China, India, and Japan), Europe (Germany, UK, and France), Middle East and Africa (Saudi Arabia and UAE), South America (Brazil and Argentina), and Rest of World (ROW)

Published: Dec 2025 270 Pages SKU: IRTNTR80986

Market Overview at a Glance

$87.23 B
Market Opportunity
25.3%
CAGR 2024 - 2029
33.5%
North America Growth
$19.29 B
Cloud-based segment 2023

AI In Geospatial Technology Market Size 2025-2029

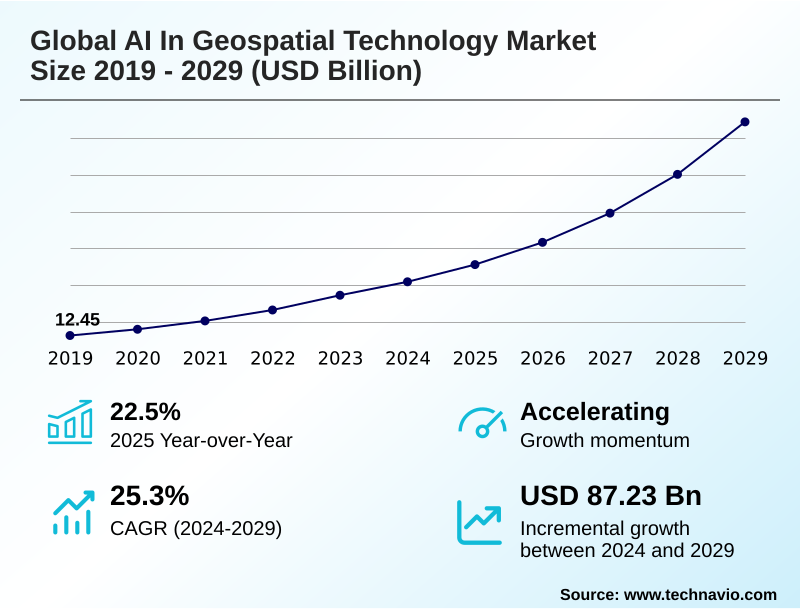
The ai in geospatial technology market size is valued to increase by USD 87.23 billion, at a CAGR of 25.3% from 2024 to 2029. Exponential proliferation of geospatial data sources will drive the ai in geospatial technology market.

Major Market Trends & Insights

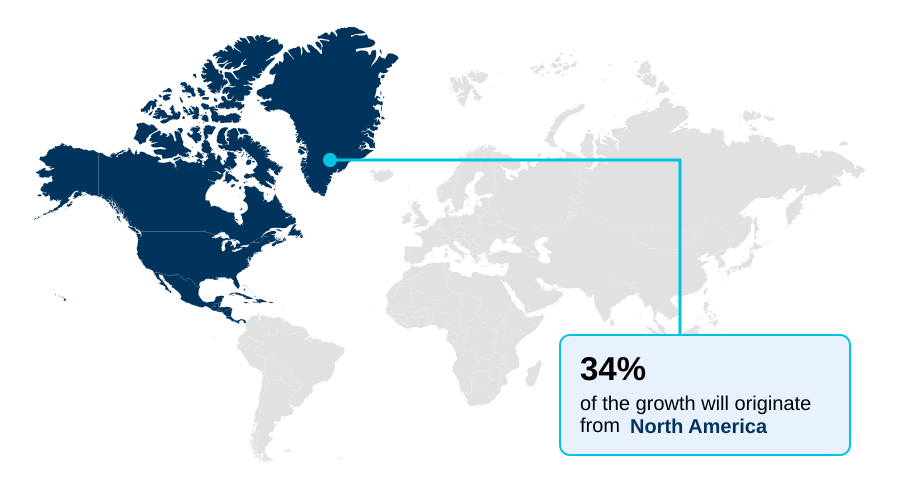
  • North America dominated the market and accounted for a 33.5% growth during the forecast period.
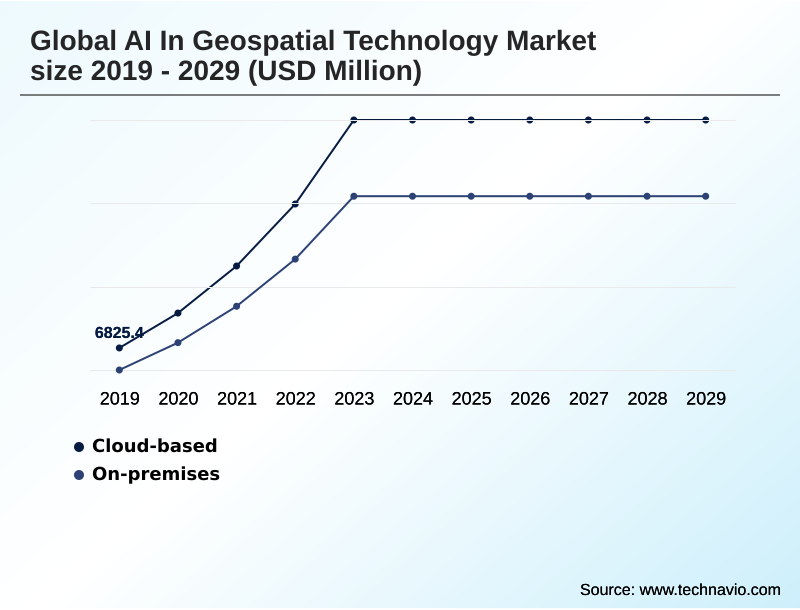
  • By Deployment - Cloud-based segment was valued at USD 19.29 billion in 2023
  • By End-user - Government and defense segment accounted for the largest market revenue share in 2023

Market Size & Forecast

  • Market Opportunities: USD 116.53 billion
  • Market Future Opportunities: USD 87.23 billion
  • CAGR from 2024 to 2029 : 25.3%

Market Summary

  • The AI In Geospatial Technology Market is defined by the integration of artificial intelligence with spatial data to automate and scale analysis. This convergence is driven by the deluge of data from satellites and sensors, which necessitates advanced processing capabilities beyond manual interpretation.
  • Key trends include the rise of geospatial foundation models and AI-powered digital twins, which allow for complex simulations and predictive insights. For instance, a logistics firm can leverage AI to analyze real-time traffic and weather data, optimizing fleet-wide routing to enhance supply chain efficiency and reduce operational costs.
  • However, the market's potential is tempered by challenges such as the need for vast quantities of high-quality, labeled training data and a persistent shortage of professionals with the hybrid expertise required to develop and deploy these sophisticated systems. Addressing these issues is critical for unlocking the full value of GeoAI across industries.

What will be the Size of the AI In Geospatial Technology Market during the forecast period?

Get Key Insights on Market Forecast (PDF) Request Free Sample

How is the AI In Geospatial Technology Market Segmented?

The ai in geospatial technology industry research report provides comprehensive data (region-wise segment analysis), with forecasts and estimates in "USD million" for the period 2025-2029, as well as historical data from 2019-2023 for the following segments.

  • Deployment
    • Cloud-based
    • On-premises
  • End-user
    • Government and defense
    • Transportation and logistics
    • Natural resources
    • Utilities
    • Others
  • Technology
    • Machine learning
    • Computer vision
    • Deep learning
    • Natural language processing
  • Geography
    • North America
      • US
      • Canada
    • APAC
      • China
      • India
      • Japan
    • Europe
      • Germany
      • UK
      • France
    • Middle East and Africa
      • Saudi Arabia
      • UAE
    • South America
      • Brazil
      • Argentina
    • Rest of World (ROW)

By Deployment Insights

The cloud-based segment is estimated to witness significant growth during the forecast period.

The market is heavily segmented by deployment, with the cloud-based model dominating due to its scalability and cost-efficiency. This approach provides access to powerful cloud computing infrastructure and high-performance computing resources, essential for running complex deep learning architectures.

Vendors are increasingly offering platform-as-a-service (PaaS) solutions that embed pre-trained models, allowing organizations to leverage advanced analytics without significant upfront investment in AI accelerators. The rise of low-code/no-code GeoAI platforms is further democratizing access.

This shift is enabling firms to improve analytical workflows through efficient MLOps for geospatial pipelines, which integrate diverse inputs via sensor data fusion and often utilize a flexible hybrid cloud deployment strategy to balance security and scalability, leading to a 40% faster model deployment cycle.

Request Free Sample

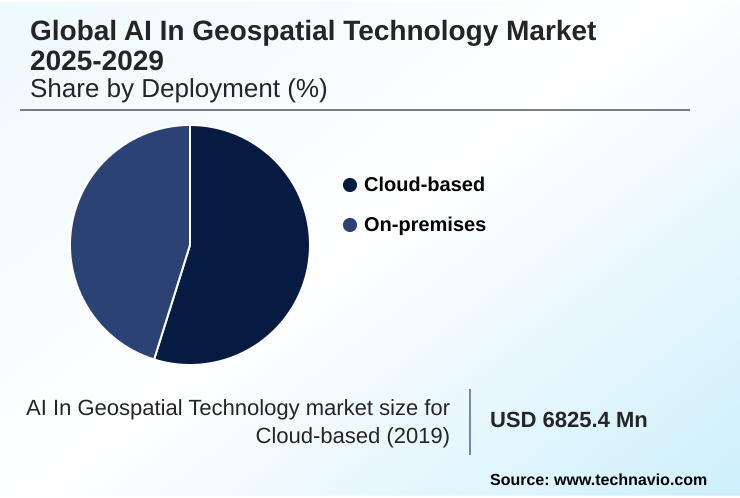
The Cloud-based segment was valued at USD 19.29 billion in 2023 and showed a gradual increase during the forecast period.

Request Free Sample

Regional Analysis

North America is estimated to contribute 33.5% to the growth of the global market during the forecast period.Technavio’s analysts have elaborately explained the regional trends and drivers that shape the market during the forecast period.

See How AI In Geospatial Technology Market Demand is Rising in North America Request Free Sample

The geographic landscape is led by North America, which accounts for over 33% of incremental growth due to strong government and commercial investment.

This region is a hub for developing technologies like automated feature extraction from synthetic aperture radar (SAR) and LiDAR data analysis.

In contrast, APAC is the fastest-growing region, with a CAGR of 25.8%, driven by smart city initiatives and agricultural technology. In Europe, the focus is on environmental monitoring, using advanced raster data analysis and semantic segmentation.

Applications vary regionally, from property risk assessment in mature markets to agricultural monitoring in emerging ones. The adoption of edge computing for GeoAI is a growing trend globally, enabling localized processing and point cloud classification for real-time applications.

Market Dynamics

Our researchers analyzed the data with 2024 as the base year, along with the key drivers, trends, and challenges. A holistic analysis of drivers will help companies refine their marketing strategies to gain a competitive advantage.

  • The practical application of AI in geospatial technology is expanding, driven by specific, high-value use cases. The use of AI for satellite imagery analysis has become fundamental for large-scale environmental monitoring and commercial intelligence. In urban environments, generative AI in urban planning allows for the simulation of development scenarios with unprecedented detail.
  • The core technology often involves deep learning for feature extraction from complex imagery, while machine learning for predictive mapping helps forecast trends like land use change. For asset identification, computer vision for object detection is critical, and natural language processing for geocoding transforms unstructured text into mappable data points.
  • Specific applications include AI-driven change detection in forestry to combat illegal logging and geospatial AI for supply chain optimization, which has been shown to improve delivery time predictability by double-digit percentages compared to legacy systems. Other key use cases are automated 3D model generation from LiDAR and real-time traffic flow prediction with AI.
  • The concept of an AI-powered digital twin for infrastructure enables predictive maintenance for utility networks. Advanced analytics of hyperspectral data analysis with AI unlocks new insights, while AI models for property risk assessment are reshaping the insurance industry. Furthermore, using AI for precision agriculture insights is boosting yields. During crises, GeoAI for disaster damage assessment accelerates response times.
  • All these applications rely on cloud platforms for scalable GeoAI processing. Firms are also focused on mitigating algorithmic bias in GeoAI and addressing ethical considerations in geospatial surveillance, while managing the substantial training data requirements for GeoAI models.

What are the key market drivers leading to the rise in the adoption of AI In Geospatial Technology Industry?

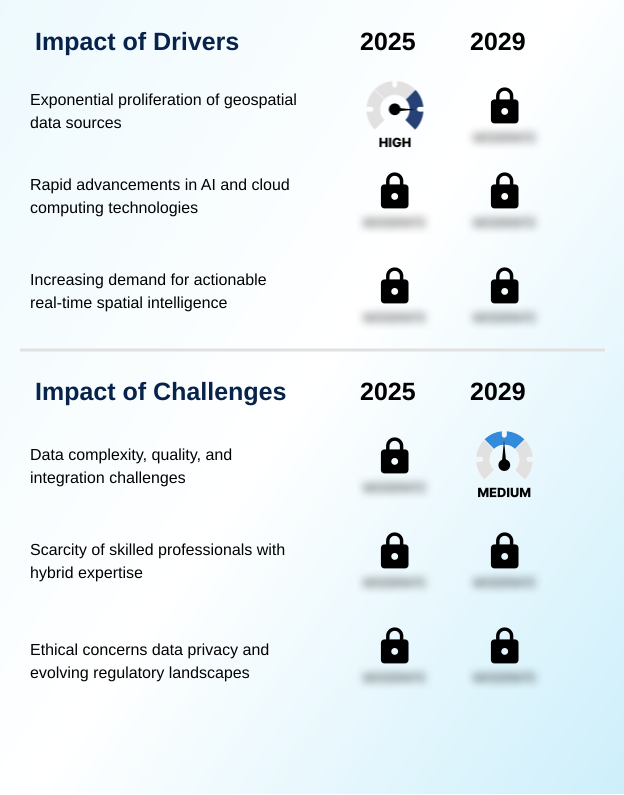
  • The exponential proliferation of geospatial data from a multitude of sources is a primary driver fueling market demand for advanced AI-powered analytical solutions.

  • Market growth is driven by an escalating demand for actionable real-time intelligence that informs strategic, data-driven decision-making. End-users require sophisticated predictive intelligence and real-time situational awareness, which are delivered by advanced machine learning models.
  • These models process vast inputs, including hyperspectral satellite data, to power applications like precision farming optimization, where analysis improves crop yield forecasts by up to 25%. In logistics, enhanced supply chain visibility cuts shipping delays by 15%.
  • Even unstructured data is being harnessed through natural language processing (NLP) to generate insights.
  • The need to transform raw data into valuable intelligence is also critical in the utilities sector, where AI-driven vegetation management analytics automates risk assessment for critical infrastructure.

What are the market trends shaping the AI In Geospatial Technology Industry?

  • The emergence of geospatial foundation models and the application of generative AI represent a paradigm-shifting market trend. This evolution is redefining how users interact with and derive insights from complex spatial data.

  • A key trend reshaping the market is the rise of geospatial foundation models, large-scale systems that understand complex spatiotemporal patterns. This has enabled the development of conversational GIS and other applications of generative AI for geospatial analysis, where large language models allow users to query data naturally.
  • These technologies are foundational to creating AI-powered digital twins, which provide predictive and prescriptive insights for use cases like proactive infrastructure monitoring, improving risk detection by over 30%. The output of these systems, often in the form of detailed 3D vector map generation, is refined through human-in-the-loop validation to ensure accuracy.
  • This trend is moving the industry beyond simple data visualization to dynamic, predictive modeling environments, increasing analytical capabilities for urban planners by 50%.

What challenges does the AI In Geospatial Technology Industry face during its growth?

  • Significant challenges related to data complexity, inconsistent quality, and the difficulties of integration are constraining the industry's growth trajectory.

  • Despite advancements, significant challenges persist, particularly around data quality and ethics. The efficacy of sophisticated neural network architectures used for tasks like automated target recognition and anomaly detection depends heavily on extensive, high-quality training data. The process of ground truth data creation is a major bottleneck, increasing project costs by up to 40%.
  • Furthermore, as computer vision algorithms and change detection algorithms become more powerful, concerns over algorithmic bias mitigation are growing. Organizations must now navigate a complex ethical landscape, adhering to responsible AI principles and strict data sovereignty compliance rules.
  • The forthcoming EU AI Act implications will add another layer of regulatory complexity, with non-compliance risks driving up operational oversight costs by an estimated 20% for high-risk applications.

Exclusive Technavio Analysis on Customer Landscape

The ai in geospatial technology market forecasting report includes the adoption lifecycle of the market, covering from the innovator’s stage to the laggard’s stage. It focuses on adoption rates in different regions based on penetration. Furthermore, the ai in geospatial technology market report also includes key purchase criteria and drivers of price sensitivity to help companies evaluate and develop their market growth analysis strategies.

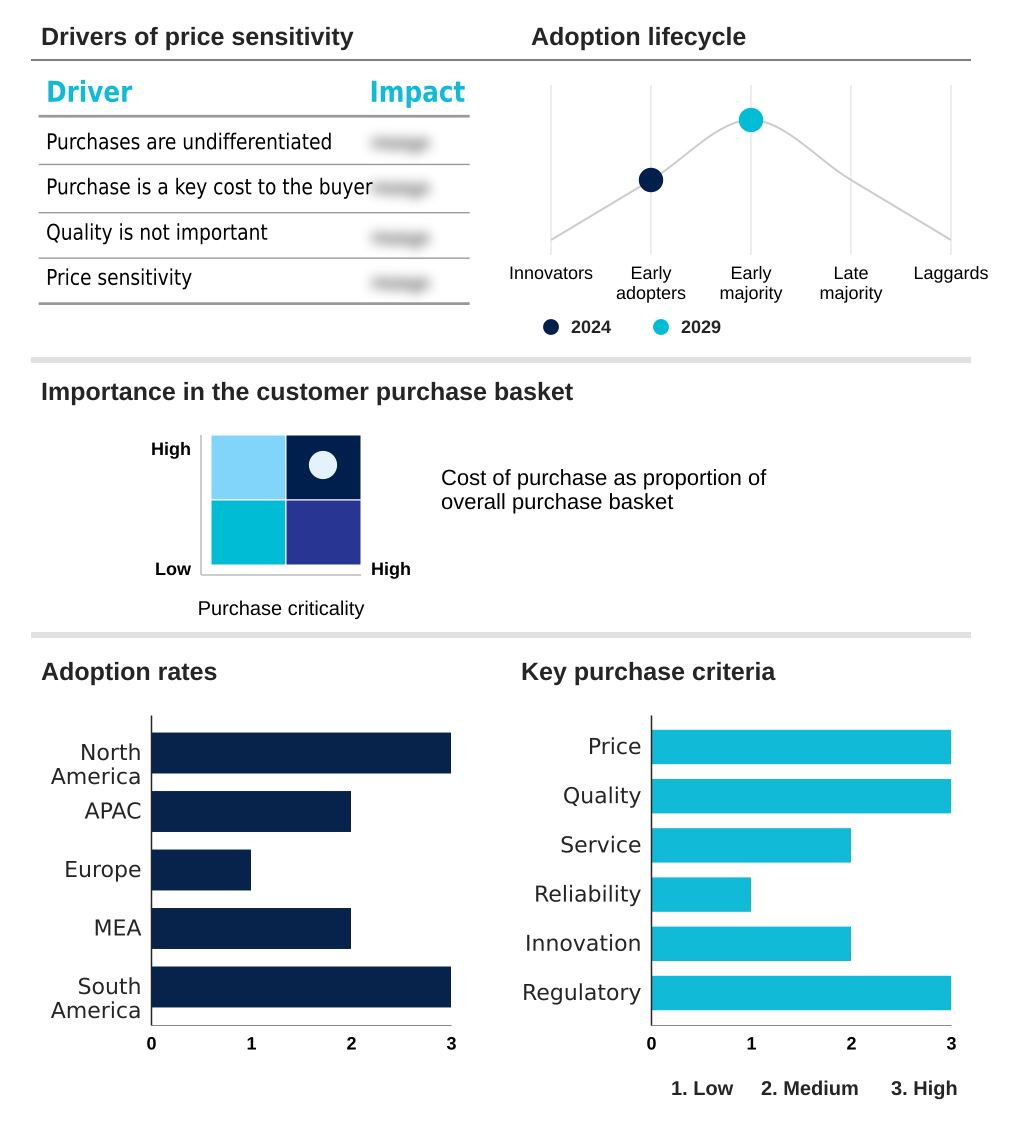
Customer Landscape of AI In Geospatial Technology Industry

Competitive Landscape

Companies are implementing various strategies, such as strategic alliances, ai in geospatial technology market forecast, partnerships, mergers and acquisitions, geographical expansion, and product/service launches, to enhance their presence in the industry.

Airbus SE - Vendors deliver AI-powered geospatial analytics platforms, converting raw satellite and sensor data into predictive intelligence essential for strategic enterprise decisions.

The industry research and growth report includes detailed analyses of the competitive landscape of the market and information about key companies, including:

  • Airbus SE
  • Blackshark.ai GmbH
  • CAPE Analytics
  • CartoDB Inc.
  • DroneDeploy Inc.
  • EarthDaily Analytics
  • Ecopia Tech Corp.
  • Esri Global Inc.
  • Google LLC
  • Hexagon AB
  • ICEYE Oy
  • Mapbox Inc.
  • Maxar Technologies Inc.
  • Microsoft Corp.
  • Orbital Insight Inc.
  • Pixxel Space Technologies Inc.
  • Planet Labs PBC
  • Satellogic SA

Qualitative and quantitative analysis of companies has been conducted to help clients understand the wider business environment as well as the strengths and weaknesses of key industry players. Data is qualitatively analyzed to categorize companies as pure play, category-focused, industry-focused, and diversified; it is quantitatively analyzed to categorize companies as dominant, leading, strong, tentative, and weak.

Recent Development and News in Ai in geospatial technology market

  • In August 2024, CartoDB Inc. launched its AI Agents in private preview, a feature designed to enable users to interact with complex spatial data using natural language queries.
  • In September 2024, CAPE Analytics partnered with Vexcel to expand its high-resolution aerial imagery coverage, enhancing its AI-driven property intelligence for the insurance sector.
  • In November 2024, Amazon Web Services and the Taylor Geospatial Institute announced the Generative AI for Geospatial Challenge, providing cloud credits to foster novel application development.
  • In January 2025, Mapbox Inc. introduced MapGPT, an AI-powered conversational assistant integrated into its Navigation SDK, to create more intuitive in-vehicle mapping experiences.

Dive into Technavio’s robust research methodology, blending expert interviews, extensive data synthesis, and validated models for unparalleled AI In Geospatial Technology Market insights. See full methodology.

Market Scope
Page number 270
Base year 2024
Historic period 2019-2023
Forecast period 2025-2029
Growth momentum & CAGR Accelerate at a CAGR of 25.3%
Market growth 2025-2029 USD 87225.3 million
Market structure Fragmented
YoY growth 2024-2025(%) 22.5%
Key countries US, Canada, China, India, Japan, South Korea, Australia, Germany, UK, France, Saudi Arabia, UAE, Brazil and Argentina
Competitive landscape Leading Companies, Market Positioning of Companies, Competitive Strategies, and Industry Risks

Request Free Sample

Research Analyst Overview

  • The AI In Geospatial Technology market is advancing beyond traditional GIS, driven by the operationalization of sophisticated machine learning models and neural network architectures. The development of geospatial foundation models, coupled with accessible cloud computing infrastructure, is creating new commercial opportunities.
  • Boardroom decisions are increasingly influenced by the potential of predictive intelligence and real-time situational awareness to de-risk operations and identify new revenue streams. The adoption of computer vision algorithms for automated feature extraction from LiDAR data analysis and hyperspectral satellite data is now standard practice, with firms reporting a reduction in manual data processing times by over 60%.
  • This shift enables a focus on high-value tasks like anomaly detection and change detection algorithms. However, leveraging technologies like conversational GIS and AI-powered digital twins requires significant investment in high-performance computing, AI accelerators, and the development of pre-trained models.
  • Successfully navigating this landscape depends on a firm's ability to integrate everything from large language models and natural language processing (NLP) to synthetic aperture radar (SAR) and automated target recognition into a cohesive strategy.

What are the Key Data Covered in this AI In Geospatial Technology Market Research and Growth Report?

  • What is the expected growth of the AI In Geospatial Technology Market between 2025 and 2029?

    • USD 87.23 billion, at a CAGR of 25.3%

  • What segmentation does the market report cover?

    • The report is segmented by Deployment (Cloud-based, On-premises), End-user (Government and defense, Transportation and logistics, Natural resources, Utilities, Others), Technology (Machine learning, Computer vision, Deep learning, Natural language processing) and Geography (North America, APAC, Europe, Middle East and Africa, South America)

  • Which regions are analyzed in the report?

    • North America, APAC, Europe, Middle East and Africa and South America

  • What are the key growth drivers and market challenges?

    • Exponential proliferation of geospatial data sources, Data complexity, quality, and integration challenges

  • Who are the major players in the AI In Geospatial Technology Market?

    • Airbus SE, Blackshark.ai GmbH, CAPE Analytics, CartoDB Inc., DroneDeploy Inc., EarthDaily Analytics, Ecopia Tech Corp., Esri Global Inc., Google LLC, Hexagon AB, ICEYE Oy, Mapbox Inc., Maxar Technologies Inc., Microsoft Corp., Orbital Insight Inc., Pixxel Space Technologies Inc., Planet Labs PBC and Satellogic SA

Market Research Insights

  • The market is being reshaped by the demand for actionable real-time intelligence, moving beyond static mapping to deliver predictive and prescriptive insights. This shift enables enhanced data-driven decision-making, with organizations achieving up to a 30% improvement in operational planning accuracy. The adoption of platform-as-a-service (PaaS) models and low-code/no-code GeoAI solutions is democratizing access, allowing non-specialists to perform complex analyses.
  • These platforms are facilitating proactive infrastructure monitoring, which has been shown to reduce critical asset failures by 25%. As a result, companies are leveraging these tools to gain a competitive edge through superior supply chain visibility and optimized resource management.

We can help! Our analysts can customize this ai in geospatial technology market research report to meet your requirements.

Get in touch

1. Executive Summary

1.1 Market overview

Executive Summary - Chart on Market Overview
Executive Summary - Data Table on Market Overview
Executive Summary - Chart on Global Market Characteristics
Executive Summary - Chart on Market by Geography
Executive Summary - Chart on Market Segmentation by Deployment
Executive Summary - Chart on Market Segmentation by End-user
Executive Summary - Chart on Market Segmentation by Technology
Executive Summary - Chart on Incremental Growth
Executive Summary - Data Table on Incremental Growth
Executive Summary - Chart on Company Market Positioning

2. Technavio Analysis

2.1 Analysis of price sensitivity, lifecycle, customer purchase basket, adoption rates, and purchase criteria

2.2 Criticality of inputs and Factors of differentiation

Chart on Overview on criticality of inputs and factors of differentiation

2.3 Factors of disruption

Chart on Overview on factors of disruption

2.4 Impact of drivers and challenges

Chart on Impact of drivers and challenges in 2024 and 2029

3. Market Landscape

3.1 Market ecosystem

Chart on Parent Market
Data Table on - Parent Market

3.2 Market characteristics

Chart on Market characteristics analysis

3.3 Value chain analysis

Chart on Value chain analysis

4. Market Sizing

4.1 Market definition

Data Table on Offerings of companies included in the market definition

4.2 Market segment analysis

Market segments

4.3 Market size 2024

4.4 Market outlook: Forecast for 2024-2029

Chart on Global - Market size and forecast 2024-2029 ($ million)
Data Table on Global - Market size and forecast 2024-2029 ($ million)
Chart on Global Market: Year-over-year growth 2024-2029 (%)
Data Table on Global Market: Year-over-year growth 2024-2029 (%)

5. Historic Market Size

5.1 Global AI In Geospatial Technology Market 2019 - 2023

Historic Market Size - Data Table on Global AI In Geospatial Technology Market 2019 - 2023 ($ million)

5.2 Deployment segment analysis 2019 - 2023

Historic Market Size - Deployment Segment 2019 - 2023 ($ million)

5.3 End-user segment analysis 2019 - 2023

Historic Market Size - End-user Segment 2019 - 2023 ($ million)

5.4 Technology segment analysis 2019 - 2023

Historic Market Size - Technology Segment 2019 - 2023 ($ million)

5.5 Geography segment analysis 2019 - 2023

Historic Market Size - Geography Segment 2019 - 2023 ($ million)

5.6 Country segment analysis 2019 - 2023

Historic Market Size - Country Segment 2019 - 2023 ($ million)

6. Five Forces Analysis

6.1 Five forces summary

Five forces analysis - Comparison between 2024 and 2029

6.2 Bargaining power of buyers

Bargaining power of buyers - Impact of key factors 2024 and 2029

6.3 Bargaining power of suppliers

Bargaining power of suppliers - Impact of key factors in 2024 and 2029

6.4 Threat of new entrants

Threat of new entrants - Impact of key factors in 2024 and 2029

6.5 Threat of substitutes

Threat of substitutes - Impact of key factors in 2024 and 2029

6.6 Threat of rivalry

Threat of rivalry - Impact of key factors in 2024 and 2029

6.7 Market condition

Chart on Market condition - Five forces 2024 and 2029

7. Market Segmentation by Deployment

7.1 Market segments

Chart on Deployment - Market share 2024-2029 (%)
Data Table on Deployment - Market share 2024-2029 (%)

7.2 Comparison by Deployment

Chart on Comparison by Deployment
Data Table on Comparison by Deployment

7.3 Cloud-based - Market size and forecast 2024-2029

Chart on Cloud-based - Market size and forecast 2024-2029 ($ million)
Data Table on Cloud-based - Market size and forecast 2024-2029 ($ million)
Chart on Cloud-based - Year-over-year growth 2024-2029 (%)
Data Table on Cloud-based - Year-over-year growth 2024-2029 (%)

7.4 On-premises - Market size and forecast 2024-2029

Chart on On-premises - Market size and forecast 2024-2029 ($ million)
Data Table on On-premises - Market size and forecast 2024-2029 ($ million)
Chart on On-premises - Year-over-year growth 2024-2029 (%)
Data Table on On-premises - Year-over-year growth 2024-2029 (%)

7.5 Market opportunity by Deployment

Market opportunity by Deployment ($ million)
Data Table on Market opportunity by Deployment ($ million)

8. Market Segmentation by End-user

8.1 Market segments

Chart on End-user - Market share 2024-2029 (%)
Data Table on End-user - Market share 2024-2029 (%)

8.2 Comparison by End-user

Chart on Comparison by End-user
Data Table on Comparison by End-user

8.3 Government and defense - Market size and forecast 2024-2029

Chart on Government and defense - Market size and forecast 2024-2029 ($ million)
Data Table on Government and defense - Market size and forecast 2024-2029 ($ million)
Chart on Government and defense - Year-over-year growth 2024-2029 (%)
Data Table on Government and defense - Year-over-year growth 2024-2029 (%)

8.4 Transportation and logistics - Market size and forecast 2024-2029

Chart on Transportation and logistics - Market size and forecast 2024-2029 ($ million)
Data Table on Transportation and logistics - Market size and forecast 2024-2029 ($ million)
Chart on Transportation and logistics - Year-over-year growth 2024-2029 (%)
Data Table on Transportation and logistics - Year-over-year growth 2024-2029 (%)

8.5 Natural resources - Market size and forecast 2024-2029

Chart on Natural resources - Market size and forecast 2024-2029 ($ million)
Data Table on Natural resources - Market size and forecast 2024-2029 ($ million)
Chart on Natural resources - Year-over-year growth 2024-2029 (%)
Data Table on Natural resources - Year-over-year growth 2024-2029 (%)

8.6 Utilities - Market size and forecast 2024-2029

Chart on Utilities - Market size and forecast 2024-2029 ($ million)
Data Table on Utilities - Market size and forecast 2024-2029 ($ million)
Chart on Utilities - Year-over-year growth 2024-2029 (%)
Data Table on Utilities - Year-over-year growth 2024-2029 (%)

8.7 Others - Market size and forecast 2024-2029

Chart on Others - Market size and forecast 2024-2029 ($ million)
Data Table on Others - Market size and forecast 2024-2029 ($ million)
Chart on Others - Year-over-year growth 2024-2029 (%)
Data Table on Others - Year-over-year growth 2024-2029 (%)

8.8 Market opportunity by End-user

Market opportunity by End-user ($ million)
Data Table on Market opportunity by End-user ($ million)

9. Market Segmentation by Technology

9.1 Market segments

Chart on Technology - Market share 2024-2029 (%)
Data Table on Technology - Market share 2024-2029 (%)

9.2 Comparison by Technology

Chart on Comparison by Technology
Data Table on Comparison by Technology

9.3 Machine learning - Market size and forecast 2024-2029

Chart on Machine learning - Market size and forecast 2024-2029 ($ million)
Data Table on Machine learning - Market size and forecast 2024-2029 ($ million)
Chart on Machine learning - Year-over-year growth 2024-2029 (%)
Data Table on Machine learning - Year-over-year growth 2024-2029 (%)

9.4 Computer vision - Market size and forecast 2024-2029

Chart on Computer vision - Market size and forecast 2024-2029 ($ million)
Data Table on Computer vision - Market size and forecast 2024-2029 ($ million)
Chart on Computer vision - Year-over-year growth 2024-2029 (%)
Data Table on Computer vision - Year-over-year growth 2024-2029 (%)

9.5 Deep learning - Market size and forecast 2024-2029

Chart on Deep learning - Market size and forecast 2024-2029 ($ million)
Data Table on Deep learning - Market size and forecast 2024-2029 ($ million)
Chart on Deep learning - Year-over-year growth 2024-2029 (%)
Data Table on Deep learning - Year-over-year growth 2024-2029 (%)

9.6 Natural language processing - Market size and forecast 2024-2029

Chart on Natural language processing - Market size and forecast 2024-2029 ($ million)
Data Table on Natural language processing - Market size and forecast 2024-2029 ($ million)
Chart on Natural language processing - Year-over-year growth 2024-2029 (%)
Data Table on Natural language processing - Year-over-year growth 2024-2029 (%)

9.7 Market opportunity by Technology

Market opportunity by Technology ($ million)
Data Table on Market opportunity by Technology ($ million)

10. Customer Landscape

10.1 Customer landscape overview

Analysis of price sensitivity, lifecycle, customer purchase basket, adoption rates, and purchase criteria

11. Geographic Landscape

11.1 Geographic segmentation

Chart on Market share by geography 2024-2029 (%)
Data Table on Market share by geography 2024-2029 (%)

11.2 Geographic comparison

Chart on Geographic comparison
Data Table on Geographic comparison

11.3 North America - Market size and forecast 2024-2029

Chart on North America - Market size and forecast 2024-2029 ($ million)
Data Table on North America - Market size and forecast 2024-2029 ($ million)
Chart on North America - Year-over-year growth 2024-2029 (%)
Data Table on North America - Year-over-year growth 2024-2029 (%)
Chart on Regional Comparison - North America
Data Table on Regional Comparison - North America

11.3.1 US - Market size and forecast 2024-2029

Chart on US - Market size and forecast 2024-2029 ($ million)
Data Table on US - Market size and forecast 2024-2029 ($ million)
Chart on US - Year-over-year growth 2024-2029 (%)
Data Table on US - Year-over-year growth 2024-2029 (%)

11.3.2 Canada - Market size and forecast 2024-2029

Chart on Canada - Market size and forecast 2024-2029 ($ million)
Data Table on Canada - Market size and forecast 2024-2029 ($ million)
Chart on Canada - Year-over-year growth 2024-2029 (%)
Data Table on Canada - Year-over-year growth 2024-2029 (%)

11.4 APAC - Market size and forecast 2024-2029

Chart on APAC - Market size and forecast 2024-2029 ($ million)
Data Table on APAC - Market size and forecast 2024-2029 ($ million)
Chart on APAC - Year-over-year growth 2024-2029 (%)
Data Table on APAC - Year-over-year growth 2024-2029 (%)
Chart on Regional Comparison - APAC
Data Table on Regional Comparison - APAC

11.4.1 China - Market size and forecast 2024-2029

Chart on China - Market size and forecast 2024-2029 ($ million)
Data Table on China - Market size and forecast 2024-2029 ($ million)
Chart on China - Year-over-year growth 2024-2029 (%)
Data Table on China - Year-over-year growth 2024-2029 (%)

11.4.2 India - Market size and forecast 2024-2029

Chart on India - Market size and forecast 2024-2029 ($ million)
Data Table on India - Market size and forecast 2024-2029 ($ million)
Chart on India - Year-over-year growth 2024-2029 (%)
Data Table on India - Year-over-year growth 2024-2029 (%)

11.4.3 Japan - Market size and forecast 2024-2029

Chart on Japan - Market size and forecast 2024-2029 ($ million)
Data Table on Japan - Market size and forecast 2024-2029 ($ million)
Chart on Japan - Year-over-year growth 2024-2029 (%)
Data Table on Japan - Year-over-year growth 2024-2029 (%)

11.4.4 South Korea - Market size and forecast 2024-2029

Chart on South Korea - Market size and forecast 2024-2029 ($ million)
Data Table on South Korea - Market size and forecast 2024-2029 ($ million)
Chart on South Korea - Year-over-year growth 2024-2029 (%)
Data Table on South Korea - Year-over-year growth 2024-2029 (%)

11.4.5 Australia - Market size and forecast 2024-2029

Chart on Australia - Market size and forecast 2024-2029 ($ million)
Data Table on Australia - Market size and forecast 2024-2029 ($ million)
Chart on Australia - Year-over-year growth 2024-2029 (%)
Data Table on Australia - Year-over-year growth 2024-2029 (%)

11.5 Europe - Market size and forecast 2024-2029

Chart on Europe - Market size and forecast 2024-2029 ($ million)
Data Table on Europe - Market size and forecast 2024-2029 ($ million)
Chart on Europe - Year-over-year growth 2024-2029 (%)
Data Table on Europe - Year-over-year growth 2024-2029 (%)
Chart on Regional Comparison - Europe
Data Table on Regional Comparison - Europe

11.5.1 Germany - Market size and forecast 2024-2029

Chart on Germany - Market size and forecast 2024-2029 ($ million)
Data Table on Germany - Market size and forecast 2024-2029 ($ million)
Chart on Germany - Year-over-year growth 2024-2029 (%)
Data Table on Germany - Year-over-year growth 2024-2029 (%)

11.5.2 UK - Market size and forecast 2024-2029

Chart on UK - Market size and forecast 2024-2029 ($ million)
Data Table on UK - Market size and forecast 2024-2029 ($ million)
Chart on UK - Year-over-year growth 2024-2029 (%)
Data Table on UK - Year-over-year growth 2024-2029 (%)

11.5.3 France - Market size and forecast 2024-2029

Chart on France - Market size and forecast 2024-2029 ($ million)
Data Table on France - Market size and forecast 2024-2029 ($ million)
Chart on France - Year-over-year growth 2024-2029 (%)
Data Table on France - Year-over-year growth 2024-2029 (%)

11.6 Middle East and Africa - Market size and forecast 2024-2029

Chart on Middle East and Africa - Market size and forecast 2024-2029 ($ million)
Data Table on Middle East and Africa - Market size and forecast 2024-2029 ($ million)
Chart on Middle East and Africa - Year-over-year growth 2024-2029 (%)
Data Table on Middle East and Africa - Year-over-year growth 2024-2029 (%)
Chart on Regional Comparison - Middle East and Africa
Data Table on Regional Comparison - Middle East and Africa

11.6.1 Saudi Arabia - Market size and forecast 2024-2029

Chart on Saudi Arabia - Market size and forecast 2024-2029 ($ million)
Data Table on Saudi Arabia - Market size and forecast 2024-2029 ($ million)
Chart on Saudi Arabia - Year-over-year growth 2024-2029 (%)
Data Table on Saudi Arabia - Year-over-year growth 2024-2029 (%)

11.6.2 UAE - Market size and forecast 2024-2029

Chart on UAE - Market size and forecast 2024-2029 ($ million)
Data Table on UAE - Market size and forecast 2024-2029 ($ million)
Chart on UAE - Year-over-year growth 2024-2029 (%)
Data Table on UAE - Year-over-year growth 2024-2029 (%)

11.7 South America - Market size and forecast 2024-2029

Chart on South America - Market size and forecast 2024-2029 ($ million)
Data Table on South America - Market size and forecast 2024-2029 ($ million)
Chart on South America - Year-over-year growth 2024-2029 (%)
Data Table on South America - Year-over-year growth 2024-2029 (%)
Chart on Regional Comparison - South America
Data Table on Regional Comparison - South America

11.7.1 Brazil - Market size and forecast 2024-2029

Chart on Brazil - Market size and forecast 2024-2029 ($ million)
Data Table on Brazil - Market size and forecast 2024-2029 ($ million)
Chart on Brazil - Year-over-year growth 2024-2029 (%)
Data Table on Brazil - Year-over-year growth 2024-2029 (%)

11.7.2 Argentina - Market size and forecast 2024-2029

Chart on Argentina - Market size and forecast 2024-2029 ($ million)
Data Table on Argentina - Market size and forecast 2024-2029 ($ million)
Chart on Argentina - Year-over-year growth 2024-2029 (%)
Data Table on Argentina - Year-over-year growth 2024-2029 (%)

11.8 Market opportunity by geography

Market opportunity by geography ($ million)
Data Tables on Market opportunity by geography ($ million)

12. Drivers, Challenges, and Opportunity

12.1 Market drivers

Exponential proliferation of geospatial data sources
Rapid advancements in AI and cloud computing technologies
Increasing demand for actionable real-time spatial intelligence

12.2 Market challenges

Data complexity, quality, and integration challenges
Scarcity of skilled professionals with hybrid expertise
Ethical concerns data privacy and evolving regulatory landscapes

12.3 Impact of drivers and challenges

Impact of drivers and challenges in 2024 and 2029

12.4 Market opportunities

Rise of geospatial foundation models and generative AI
Emergence of AI-powered digital twins for simulation and planning
Democratization of geoai through cloud platforms and no-code solutions

13. Competitive Landscape

13.1 Overview

13.2

Overview on criticality of inputs and factors of differentiation

13.3 Landscape disruption

Overview on factors of disruption

13.4 Industry risks

Impact of key risks on business

14. Competitive Analysis

14.1 Companies profiled

Companies covered

14.2 Company ranking index

14.3 Market positioning of companies

Matrix on companies position and classification

14.4 Airbus SE

Airbus SE - Overview
Airbus SE - Business segments
Airbus SE - Key news
Airbus SE - Key offerings
Airbus SE - Segment focus
SWOT

14.5 CAPE Analytics

CAPE Analytics - Overview
CAPE Analytics - Product / Service
CAPE Analytics - Key offerings
SWOT

14.6 CartoDB Inc.

CartoDB Inc. - Overview
CartoDB Inc. - Product / Service
CartoDB Inc. - Key offerings
SWOT

14.7 DroneDeploy Inc.

DroneDeploy Inc. - Overview
DroneDeploy Inc. - Product / Service
DroneDeploy Inc. - Key offerings
SWOT

14.8 EarthDaily Analytics

EarthDaily Analytics - Overview
EarthDaily Analytics - Product / Service
EarthDaily Analytics - Key offerings
SWOT

14.9 Esri Global Inc.

Esri Global Inc. - Overview
Esri Global Inc. - Product / Service
Esri Global Inc. - Key offerings
SWOT

14.10 Google LLC

Google LLC - Overview
Google LLC - Product / Service
Google LLC - Key offerings
SWOT

14.11 Hexagon AB

Hexagon AB - Overview
Hexagon AB - Business segments
Hexagon AB - Key news
Hexagon AB - Key offerings
Hexagon AB - Segment focus
SWOT

14.12 ICEYE Oy

ICEYE Oy - Overview
ICEYE Oy - Product / Service
ICEYE Oy - Key offerings
SWOT

14.13 Mapbox Inc.

Mapbox Inc. - Overview
Mapbox Inc. - Product / Service
Mapbox Inc. - Key offerings
SWOT

14.14 Maxar Technologies Inc.

Maxar Technologies Inc. - Overview
Maxar Technologies Inc. - Product / Service
Maxar Technologies Inc. - Key news
Maxar Technologies Inc. - Key offerings
SWOT

14.15 Microsoft Corp.

Microsoft Corp. - Overview
Microsoft Corp. - Business segments
Microsoft Corp. - Key news
Microsoft Corp. - Key offerings
Microsoft Corp. - Segment focus
SWOT

14.16 Orbital Insight Inc.

Orbital Insight Inc. - Overview
Orbital Insight Inc. - Product / Service
Orbital Insight Inc. - Key offerings
SWOT

14.17 Planet Labs PBC

Planet Labs PBC - Overview
Planet Labs PBC - Product / Service
Planet Labs PBC - Key offerings
SWOT

14.18 Satellogic SA

Satellogic SA - Overview
Satellogic SA - Product / Service
Satellogic SA - Key offerings
SWOT

15. Appendix

15.1 Scope of the report

Market definition
Objectives
Notes and caveats

15.2 Inclusions and exclusions checklist

Inclusions checklist
Exclusions checklist

15.3 Currency conversion rates for US$

15.4 Research methodology

15.5 Data procurement

Information sources

15.6 Data validation

15.7 Validation techniques employed for market sizing

15.8 Data synthesis

15.9 360 degree market analysis

15.10 List of abbreviations

Research Methodology

Technavio presents a detailed picture of the market by way of study, synthesis, and summation of data from multiple sources. The analysts have presented the various facets of the market with a particular focus on identifying the key industry influencers. The data thus presented is comprehensive, reliable, and the result of extensive research, both primary and secondary.

INFORMATION SOURCES

Primary sources

  • Manufacturers and suppliers
  • Channel partners
  • Industry experts
  • Strategic decision makers

Secondary sources

  • Industry journals and periodicals
  • Government data
  • Financial reports of key industry players
  • Historical data
  • Press releases

DATA ANALYSIS

Data Synthesis

  • Collation of data
  • Estimation of key figures
  • Analysis of derived insights

Data Validation

  • Triangulation with data models
  • Reference against proprietary databases
  • Corroboration with industry experts

REPORT WRITING

Qualitative

  • Market drivers
  • Market challenges
  • Market trends
  • Five forces analysis

Quantitative

  • Market size and forecast
  • Market segmentation
  • Geographical insights
  • Competitive landscape

Interested in this report?

Get your sample now to see our research methodology and insights!

Download Now

Frequently Asked Questions

AI In Geospatial Technology market growth will increase by USD 87225.3 million during 2025-2029.

The AI In Geospatial Technology market is expected to grow at a CAGR of 25.3% during 2025-2029.

AI In Geospatial Technology market is segmented by Deployment (Cloud-based, On-premises) End-user (Government and defense, Transportation and logistics, Natural resources, Utilities, Others) Technology (Machine learning, Computer vision, Deep learning, Natural language processing)

Airbus SE, Blackshark.ai GmbH, CAPE Analytics, CartoDB Inc., DroneDeploy Inc., EarthDaily Analytics, Ecopia Tech Corp., Esri Global Inc., Google LLC, Hexagon AB, ICEYE Oy, Mapbox Inc., Maxar Technologies Inc., Microsoft Corp., Orbital Insight Inc., Pixxel Space Technologies Inc., Planet Labs PBC, Satellogic SA are a few of the key vendors in the AI In Geospatial Technology market.

North America will register the highest growth rate of 33.5% among the other regions. Therefore, the AI In Geospatial Technology market in North America is expected to garner significant business opportunities for the vendors during the forecast period.

US, Canada, China, India, Japan, South Korea, Australia, Germany, UK, France, Saudi Arabia, UAE, Brazil, Argentina

  • Exponential proliferation of geospatial data sources is the driving factor this market.

The AI In Geospatial Technology market vendors should focus on grabbing business opportunities from the Deployment segment as it accounted for the largest market share in the base year.