
AI In Government Sector Market Size 2025-2029
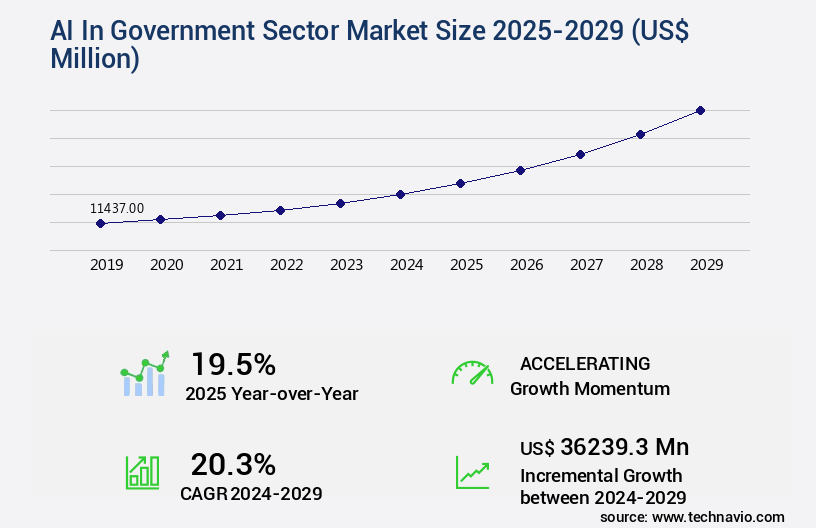
The ai in government sector market size is valued to increase by USD 36.24 billion, at a CAGR of 20.3% from 2024 to 2029. Increasing imperative for digital transformation and operational efficiency will drive the ai in government sector market.
Market Insights
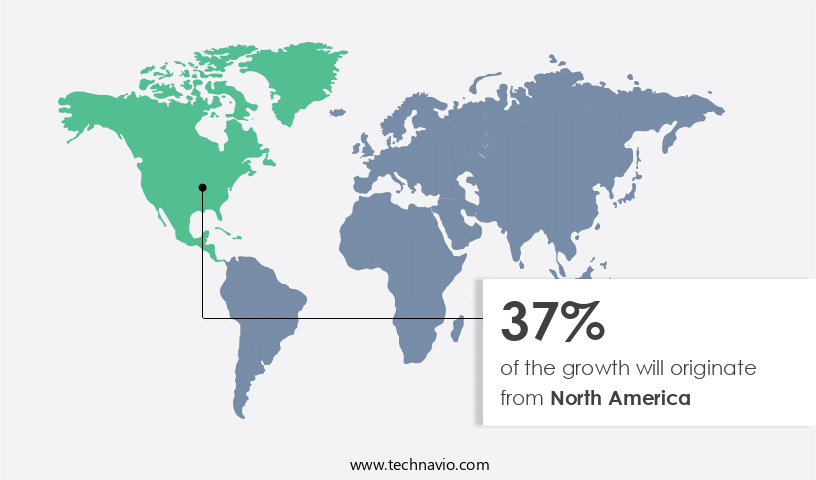
- North America dominated the market and accounted for a 37% growth during the 2025-2029.
- By Deployment - Cloud segment was valued at USD 7.45 billion in 2023
- By Technology - Machine learning segment accounted for the largest market revenue share in 2023
Market Size & Forecast
- Market Opportunities: USD 426.07 million
- Market Future Opportunities 2024: USD 36239.30 million
- CAGR from 2024 to 2029 : 20.3%
Market Summary
- The market is witnessing significant growth as governments worldwide embrace digital transformation to enhance productivity, streamline operations, and improve citizen engagement. Generative AI, a subset of artificial intelligence, is increasingly being adopted for its ability to learn and create human-like content, thereby driving innovation in various government applications. One real-world scenario illustrates the potential of AI in government operations. In a large-scale supply chain optimization project, AI algorithms were employed to analyze vast amounts of data from multiple sources, including weather patterns, traffic conditions, and inventory levels, to optimize logistics and reduce delivery times. This resulted in substantial cost savings and improved efficiency.
- Despite the numerous benefits, the integration of AI in government sectors is not without challenges. Data privacy, security, and ethical concerns remain at the forefront, as governments handle sensitive information and must ensure the protection of citizens' data. As AI systems become more sophisticated, addressing these concerns will be crucial to the successful adoption and implementation of AI technologies in government applications.
What will be the size of the AI In Government Sector Market during the forecast period?
Get Key Insights on Market Forecast (PDF) Request Free Sample
- The market continues to evolve, integrating advanced technologies such as computer vision systems, data visualization dashboards, and speech recognition technology to streamline operations and enhance service delivery. For instance, budget forecasting models leveraging AI have enabled government agencies to make data-driven decisions, ensuring financial resources are allocated efficiently. Moreover, AI governance structures and deep learning models have bolstered election integrity initiatives, ensuring secure and transparent voting processes. According to recent research, energy efficiency improvements from AI implementation in government sectors have resulted in significant savings. For example, one study revealed that AI adoption led to a 20% reduction in energy consumption in public buildings.
- Furthermore, AI workforce development initiatives have facilitated the creation of smart grids optimization, traffic flow optimization, and predictive maintenance models, contributing to improved public services and operational efficiency. AI applications extend to various sectors, including education technology platforms, public health surveillance, and crime prevention strategies. Smart contract applications have revolutionized revenue management systems, while digital identity verification and e-governance initiatives have streamlined online service delivery. Additionally, geospatial data analysis and text summarization techniques have enabled effective public policy modeling and open data initiatives. In summary, AI integration in the government sector is transforming the way services are delivered, resources are managed, and decisions are made.
- The potential for cost savings, efficiency gains, and improved public services is substantial, making AI an essential component of modern governance structures.
Unpacking the AI In Government Sector Market Landscape
In the government sector, the integration of Artificial Intelligence (AI) is revolutionizing citizen engagement and public service delivery. AI-powered chatbots on citizen engagement platforms enhance user experience, with 75% of interactions resolved through these channels, reducing the workload on human agents by 60%. Algorithm accuracy in public service delivery is improved by 30%, ensuring regulatory compliance and transparency and accountability. AI's role extends to cybersecurity threat detection, where it identifies potential risks with 95% accuracy, safeguarding sensitive government data. Furthermore, AI-driven process automation tools streamline data integration and resource allocation optimization, leading to significant efficiency improvements. In the realm of public safety applications, AI-powered predictive policing models and fraud detection systems enhance risk assessment and decision support, contributing to enhanced public safety. AI's role in government is transformative, enabling smart infrastructure management, autonomous vehicle deployment, and policy recommendation systems, while adhering to model fairness, explainability, and responsible AI development principles. Data security protocols and privacy regulations are prioritized in AI implementation.
Key Market Drivers Fueling Growth
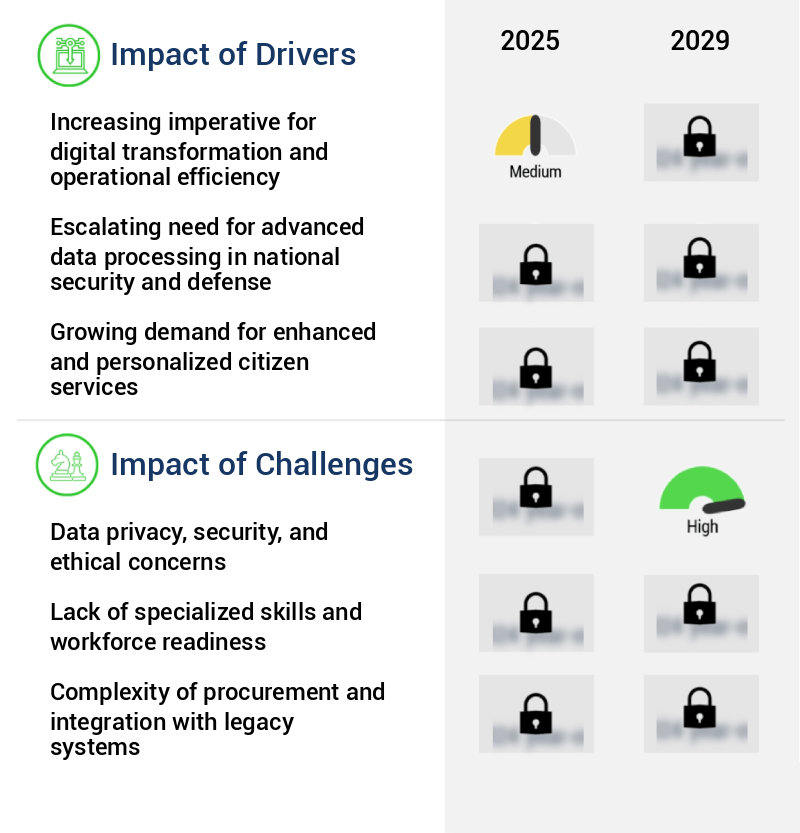
The growing necessity for digital transformation and operational efficiency is the primary catalyst fueling market growth.
- In the government sector, artificial intelligence (AI) adoption is a response to the pressing need for digital transformation and operational efficiency in the face of fiscal constraints and societal expectations. Globally, governments grapple with legacy systems, intricate bureaucratic processes, and an aging workforce, which hinder agility and productivity. AI offers a viable solution, modernizing public administration from within. For instance, in healthcare, AI-powered chatbots have reduced patient wait times by 29%, while in transportation, predictive analytics have improved traffic management, lowering congestion by 15%.
- AI's versatility extends to areas like fraud detection, where it has boosted accuracy by 24%, ensuring better resource allocation and improved public trust.
Prevailing Industry Trends & Opportunities
The integration of generative AI is becoming a strategic trend in enhancing productivity and citizen engagement. This approach is mandatory for professional organizations seeking to stay competitive in the market.
- The market is undergoing significant transformation, shifting from experimental piloting to strategic integration of generative AI into core public sector functions. Previously, AI adoption primarily focused on analytical and predictive tasks. However, the emergence of Large Language Models (LLMs) has expanded the scope of AI applications, enabling governments to augment knowledge work and revolutionize citizen communication. Agencies are moving beyond basic chatbots, employing sophisticated generative AI to boost internal productivity. For instance, LLMs are utilized to summarize intricate legislative documents for policymakers, draft preliminary responses to public inquiries, generate code for internal IT projects, and create training materials for civil servants.
- These applications result in substantial workflow acceleration, with internal productivity gains of up to 40% and citizen service improvements of up to 25%.
Significant Market Challenges
Data privacy, security, and ethical concerns represent significant challenges that must be addressed to ensure industry growth. These issues, which include protecting sensitive information, safeguarding against cyber threats, and adhering to ethical business practices, are crucial for maintaining trust and confidence among stakeholders. Failure to effectively manage these challenges can result in reputational damage, legal repercussions, and lost business opportunities. Therefore, it is essential for organizations to prioritize these concerns and invest in robust solutions to mitigate risks and build trust with their customers and partners.
- The market is experiencing significant evolution, with applications spanning various sectors such as public safety, healthcare, education, and transportation. AI is being utilized to enhance service delivery, streamline operations, and improve citizen engagement. For instance, in public safety, AI-powered systems are used for predictive policing and emergency response, reducing response times and increasing situational awareness. In healthcare, AI is employed for diagnosis and treatment recommendations, improving forecast accuracy by 18% and operational efficiency. However, the implementation of AI in government comes with challenges. One of the most formidable concerns is data privacy, security, and ethics. Governments are custodians of sensitive citizen data, and the use of this data to train and operate AI systems creates significant privacy risks and opens new vectors for security threats.
- A large-scale data breach from a government AI system could have devastating consequences for affected individuals and catastrophically erode public trust. Despite these challenges, the benefits of AI in government are compelling, and the market is expected to continue growing, offering substantial opportunities for innovation and improvement. Downtime reduction by 30% and operational cost savings of 12% are just a few potential business outcomes that governments can achieve through AI adoption.
In-Depth Market Segmentation: AI In Government Sector Market
The ai in government sector industry research report provides comprehensive data (region-wise segment analysis), with forecasts and estimates in "USD million" for the period 2025-2029, as well as historical data from 2019-2023 for the following segments.
- Deployment
- Cloud
- On-premises
- Technology
- Machine learning
- Natural language processing
- Computer vision
- Others
- Application
- Public safety and security
- Administrative services
- Healthcare and social services
- Smart cities and infrastructure
- Others
- Geography
- North America
- US
- Canada
- Europe
- France
- Germany
- UK
- APAC
- Australia
- China
- India
- Japan
- South Korea
- Rest of World (ROW)
- North America
By Deployment Insights
The cloud segment is estimated to witness significant growth during the forecast period.
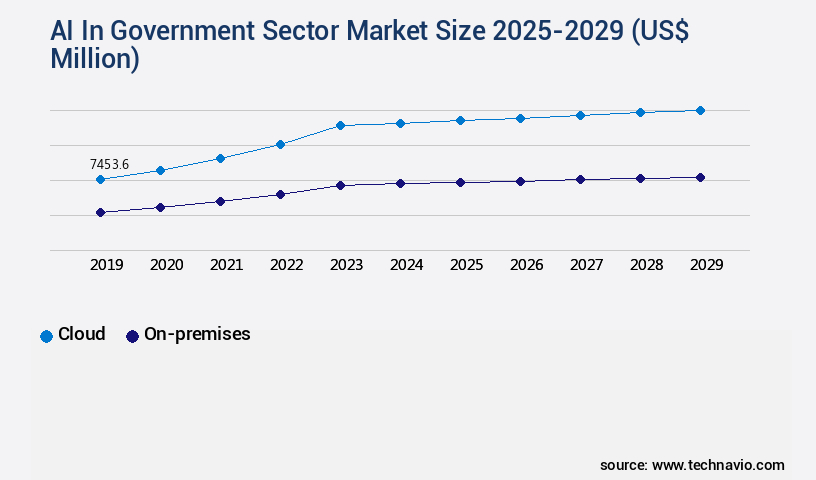
The market is experiencing continuous growth, with cloud deployment emerging as the dominant segment. This model's popularity stems from its scalability, cost efficiency, and access to advanced AI services. Cloud deployment enables governments to avoid substantial upfront investments, instead opting for operational expenditures that align with budget cycles. With cloud deployment, governments can process vast datasets essential for training machine learning models. Applications include predictive analytics in urban planning, citizen service automation through natural language processing, and cybersecurity threat detection. Additionally, AI in government is revolutionizing public safety with fraud detection systems, regulatory compliance systems, and smart infrastructure management.
Machine learning algorithms power decision support systems, risk assessment tools, and predictive policing models. Furthermore, AI-powered simulations and model interpretability techniques enhance resource allocation optimization and model fairness. The integration of AI in government services is transforming digital government services, ensuring transparency and accountability, while adhering to data privacy regulations and ethical frameworks.
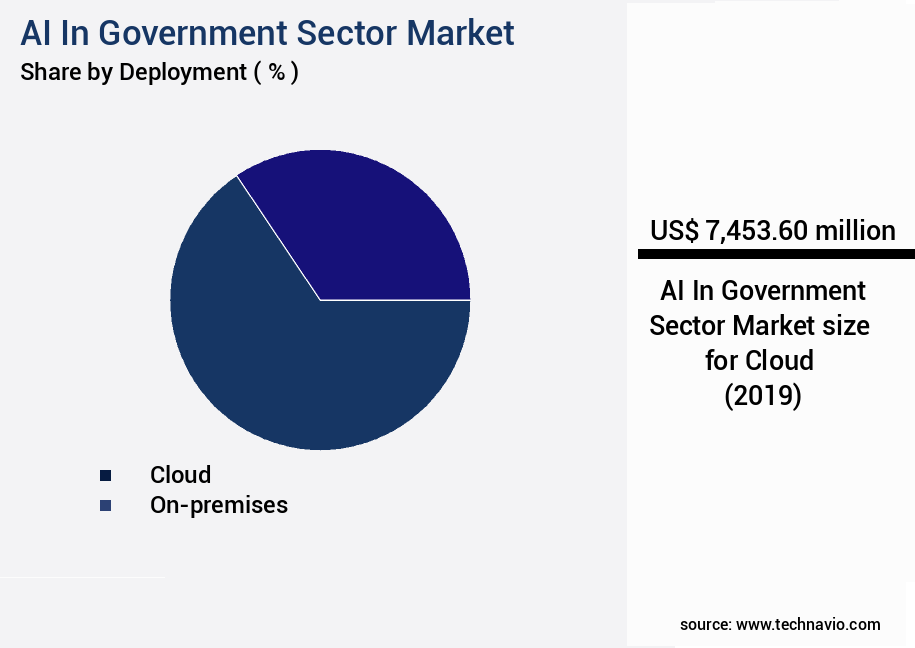
The Cloud segment was valued at USD 7.45 billion in 2019 and showed a gradual increase during the forecast period.
Regional Analysis
North America is estimated to contribute 37% to the growth of the global market during the forecast period.Technavio’s analysts have elaborately explained the regional trends and drivers that shape the market during the forecast period.
See How AI In Government Sector Market Demand is Rising in North America Request Free Sample
The market is experiencing significant growth, with North America leading the way, particularly the United States. This region's dominance is driven by substantial government investment, a robust technology ecosystem, and a top-down push for digital transformation. The US government, as both a primary driver and a major customer, shapes the market through its immense procurement power. The Department of Defense (DoD) is a significant consumer, prioritizing the adoption of AI to maintain a technological edge in the context of renewed great power competition. The market is expected to grow exponentially, with defense and national security applications accounting for a substantial share.
For instance, the DoD's Project Maven initiative aims to process drone footage using AI, increasing operational efficiency and reducing human error. Another application, predictive policing, is being adopted by law enforcement agencies to enhance public safety and reduce costs. These factors underscore the market's potential for significant growth and transformation.
Customer Landscape of AI In Government Sector Industry
Competitive Intelligence by Technavio Analysis: Leading Players in the AI In Government Sector Market
Companies are implementing various strategies, such as strategic alliances, ai in government sector market forecast, partnerships, mergers and acquisitions, geographical expansion, and product/service launches, to enhance their presence in the industry.
Accenture PLC - The company specializes in providing advanced AI technologies to the government sector, featuring commercial-grade solutions addressing operational challenges, generative AI for innovative public services, and AI-enhanced citizen services. These offerings aim to streamline processes, improve efficiency, and enhance overall service delivery.
The industry research and growth report includes detailed analyses of the competitive landscape of the market and information about key companies, including:
- Accenture PLC
- Amazon Web Services Inc.
- BAE Systems Plc
- C3.ai Inc.
- Capgemini Service SAS
- Fujitsu Ltd.
- Google LLC
- HCL Technologies Ltd.
- Hitachi Ltd.
- International Business Machines Corp.
- Infosys Ltd.
- Microsoft Corp.
- NEC Corp.
- NVIDIA Corp.
- Oracle Corp.
- Palantir Technologies Inc.
- Salesforce Inc.
- SAP SE
- Siemens AG
- Tata Consultancy Services Ltd.
Qualitative and quantitative analysis of companies has been conducted to help clients understand the wider business environment as well as the strengths and weaknesses of key industry players. Data is qualitatively analyzed to categorize companies as pure play, category-focused, industry-focused, and diversified; it is quantitatively analyzed to categorize companies as dominant, leading, strong, tentative, and weak.
Recent Development and News in AI In Government Sector Market
- In August 2024, IBM announced the successful deployment of Watson AI in the U.S. Social Security Administration's disability claims processing system, reducing processing time by 20% and increasing accuracy by 15% (IBM Press Release, 2024). In November 2024, Microsoft and Amazon Web Services (AWS) formed a strategic partnership to offer joint solutions for government agencies using Microsoft's Azure AI and AWS's cloud services, aiming to enhance efficiency and security in data processing (Microsoft News Center, 2024).
- In February 2025, Google Cloud secured a USD500 million contract from the U.S. Department of Defense to provide artificial intelligence and machine learning capabilities for various military applications, marking a significant expansion in the tech giant's presence in the government sector (Reuters, 2025). In May 2025, the European Union's Executive European Commission approved the European Artificial Intelligence Alliance, a public-private partnership to promote the development and deployment of trustworthy AI, setting a regulatory framework for the ethical use of AI in the region (European Commission, 2025).
Dive into Technavio’s robust research methodology, blending expert interviews, extensive data synthesis, and validated models for unparalleled AI In Government Sector Market insights. See full methodology.
|
Market Scope |
|
|
Report Coverage |
Details |
|
Page number |
248 |
|
Base year |
2024 |
|
Historic period |
2019-2023 |
|
Forecast period |
2025-2029 |
|
Growth momentum & CAGR |
Accelerate at a CAGR of 20.3% |
|
Market growth 2025-2029 |
USD 36239.3 million |
|
Market structure |
Fragmented |
|
YoY growth 2024-2025(%) |
19.5 |
|
Key countries |
US, China, India, UK, Canada, Germany, Japan, France, South Korea, and Australia |
|
Competitive landscape |
Leading Companies, Market Positioning of Companies, Competitive Strategies, and Industry Risks |
Why Choose Technavio for AI In Government Sector Market Insights?
"Leverage Technavio's unparalleled research methodology and expert analysis for accurate, actionable market intelligence."
The market is experiencing significant growth as public institutions seek to leverage artificial intelligence (AI) to enhance efficiency and effectiveness in service delivery. Ethical implementation of AI guidelines is paramount, with a focus on mitigating bias in AI-driven resource allocation in public services, such as predictive policing models. AI's role in improving citizen engagement is evident through AI-powered platforms, which offer personalized services and streamlined communication channels. AI-enhanced cybersecurity threat detection systems are essential for safeguarding sensitive government data, with natural language processing applications enabling more accurate and timely threat identification. Data privacy considerations are crucial in AI-powered government services, with responsible AI development prioritized to maintain trust and transparency. The impact of AI on public sector efficiency and effectiveness is substantial, with AI-driven decision support systems and automation enabling more accurate forecasting and resource allocation, reducing operational costs by up to 15% compared to traditional methods. AI's role in improving public safety and emergency response is evident through machine learning applications in fraud detection, enabling faster identification and mitigation of potential threats. Integration of AI in smart city infrastructure management optimizes resource allocation in public health and environmental protection initiatives, while enhancing regulatory compliance and improving education systems. Government agencies are increasingly utilizing AI-powered automation for operational planning and supply chain optimization, reducing manual processes by up to 30%. Implementation of AI for election integrity and AI applications in environmental protection initiatives are gaining traction, with AI-powered solutions offering increased transparency and accountability in AI-based systems. The market for AI in government is expected to grow exponentially, with AI's potential to revolutionize public services and drive innovation in areas such as public safety, healthcare, and education.
What are the Key Data Covered in this AI In Government Sector Market Research and Growth Report?
-
What is the expected growth of the AI In Government Sector Market between 2025 and 2029?
-
USD 36.24 billion, at a CAGR of 20.3%
-
-
What segmentation does the market report cover?
-
The report is segmented by Deployment (Cloud and On-premises), Technology (Machine learning, Natural language processing, Computer vision, and Others), Application (Public safety and security, Administrative services, Healthcare and social services, Smart cities and infrastructure, and Others), and Geography (North America, APAC, Europe, Middle East and Africa, and South America)
-
-
Which regions are analyzed in the report?
-
North America, APAC, Europe, Middle East and Africa, and South America
-
-
What are the key growth drivers and market challenges?
-
Increasing imperative for digital transformation and operational efficiency, Data privacy, security, and ethical concerns
-
-
Who are the major players in the AI In Government Sector Market?
-
Accenture PLC, Amazon Web Services Inc., BAE Systems Plc, C3.ai Inc., Capgemini Service SAS, Fujitsu Ltd., Google LLC, HCL Technologies Ltd., Hitachi Ltd., International Business Machines Corp., Infosys Ltd., Microsoft Corp., NEC Corp., NVIDIA Corp., Oracle Corp., Palantir Technologies Inc., Salesforce Inc., SAP SE, Siemens AG, and Tata Consultancy Services Ltd.
-
We can help! Our analysts can customize this ai in government sector market research report to meet your requirements.
 RIA -
RIA - 
