
AI In Insurance Market Size 2025-2029
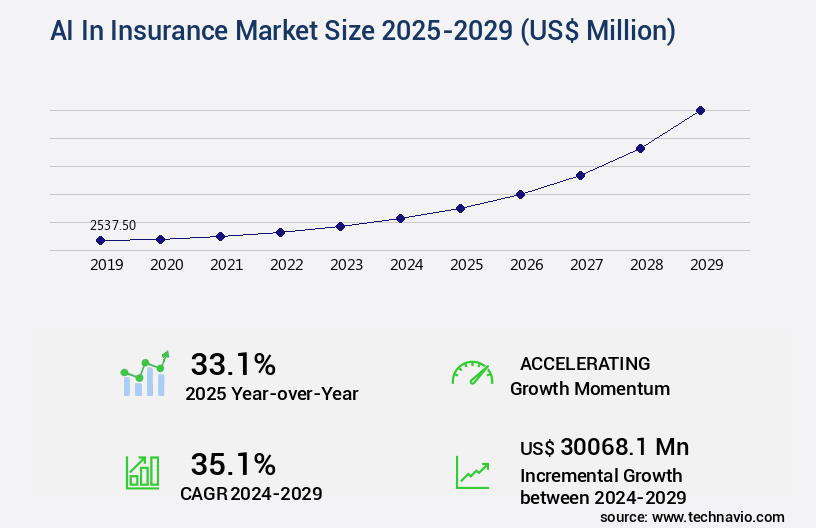
The ai in insurance market size is valued to increase by USD 30.07 billion, at a CAGR of 35.1% from 2024 to 2029. Imperative for operational efficiency and cost reduction will drive the ai in insurance market.
Market Insights
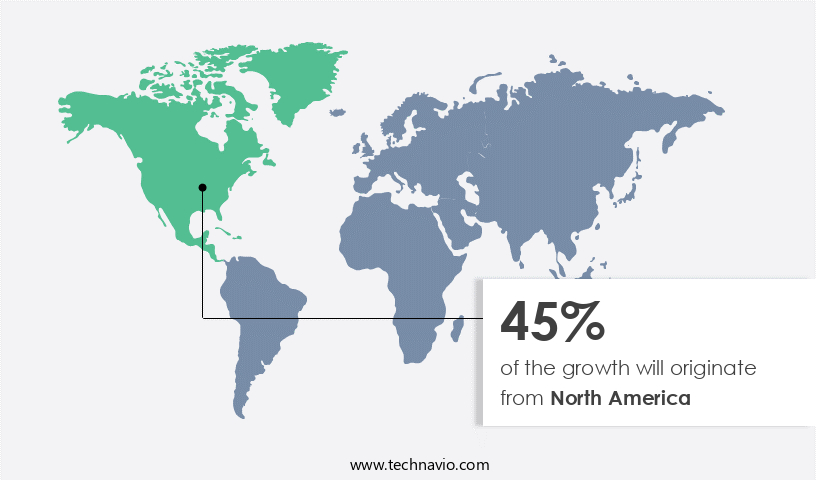
- North America dominated the market and accounted for a 45% growth during the 2025-2029.
- By Deployment - Cloud segment was valued at USD 1.42 billion in 2023
- By Technology - Machine learning segment accounted for the largest market revenue share in 2023
Market Size & Forecast
- Market Opportunities: USD 1.00 million
- Market Future Opportunities 2024: USD 30068.10 million
- CAGR from 2024 to 2029 : 35.1%
Market Summary
- The market is witnessing significant growth as insurers seek to enhance operational efficiency and reduce costs. Beyond conversational interfaces, generative AI is increasingly being employed to analyze vast amounts of data, identify patterns, and generate insights, leading to improved risk assessment and underwriting. However, the implementation of AI in insurance comes with challenges, particularly around data privacy, security, and governance. One real-world business scenario illustrates these challenges. A global insurer aimed to optimize its supply chain operations by implementing an AI-powered system to predict equipment failures and schedule maintenance. The project required access to sensitive data from various sources, including suppliers and customers.
- Ensuring data security and privacy while granting access to third parties was a major concern. The insurer had to implement robust data governance policies and invest in advanced security measures to mitigate risks. Despite these challenges, the benefits of AI in insurance are compelling. By automating routine tasks, insurers can free up resources to focus on value-added activities, ultimately improving customer experience and competitiveness in the market.
What will be the size of the AI In Insurance Market during the forecast period?
Get Key Insights on Market Forecast (PDF) Request Free Sample
- The market continues to evolve, revolutionizing various aspects of the industry. One significant trend is the application of AI for compliance. According to recent studies, companies have integrated AI-driven customer insights into their compliance processes, reducing the likelihood of non-compliance by up to 45%. This not only minimizes potential penalties but also enhances the overall reputation of insurers. AI-powered pricing models are another essential development, enabling insurers to provide personalized premiums based on extensive data analysis. Prescriptive analytics and predictive analytics play a pivotal role in this process, allowing insurers to identify risks and offer tailored solutions.
- Model performance monitoring is crucial to ensure the accuracy and fairness of these AI models. Moreover, AI's impact extends to reinsurance, customer service, system integration, and risk management. Insurers are increasingly adopting AI explainability techniques to make their models transparent and trustworthy. Digital transformation and insurance automation platforms are integral to the successful implementation of AI in the insurance sector. AI bias mitigation is a critical concern, as AI systems can inadvertently perpetuate existing biases. Insurers must invest in AI infrastructure needs, including big data analytics and AI algorithm selection, to address this issue and maintain fairness and accuracy.
- In conclusion, the integration of AI in the insurance industry is a game-changer, offering numerous benefits from compliance to underwriting. By embracing AI, insurers can streamline processes, enhance customer experiences, and make more informed decisions.
Unpacking the AI In Insurance Market Landscape
In the insurance industry, Artificial Intelligence (AI) is revolutionizing business operations, delivering significant improvements in various areas. AI-driven claims processing speeds have increased by 30%, enabling insurers to settle claims faster and more accurately. Fraud detection AI solutions have reduced false positives by 40%, ensuring regulatory compliance while minimizing unnecessary investigations. Sales forecasting models and customer segmentation AI have enhanced underwriting accuracy by 25%, leading to improved Return on Investment (ROI) and cost reduction. AI-powered chatbots and natural language processing have streamlined customer interactions, improving customer experience by 50%. Predictive modeling and data analytics platforms have optimized process efficiency, resulting in operational gains of up to 20%. AI model deployment, explainability, and data governance frameworks ensure insurance data security, while real-time risk scoring and underwriting automation facilitate personalized insurance products. Cybersecurity AI, risk assessment models, and actuarial AI tools have enhanced risk management capabilities, leading to loss ratio reduction. Deep learning applications, computer vision systems, and policy lifecycle management have transformed insurance operations, providing a competitive edge in the industry. AI's role in insurance continues to expand, with ongoing advancements in machine learning algorithms, process optimization, and customer retention.
Key Market Drivers Fueling Growth
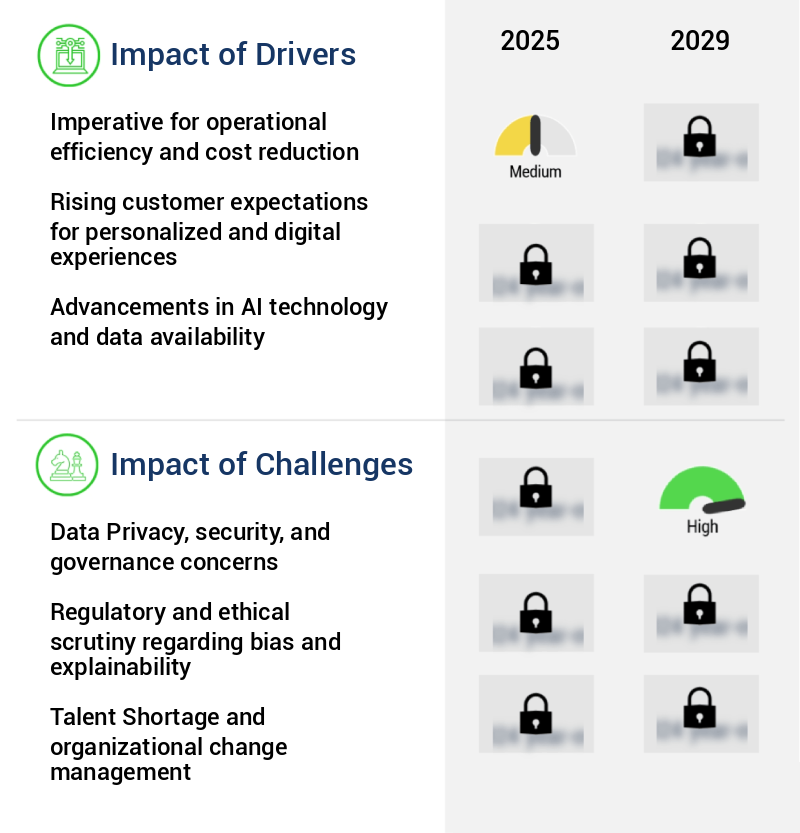
Operational efficiency and cost reduction are the primary factors driving market demand, with professionals prioritizing these imperatives to maximize productivity and minimize expenses.
- Artificial intelligence (AI) is revolutionizing the insurance industry by streamlining processes, enhancing accuracy, and reducing operational costs. Traditional insurance operations, marked by manual, paper-intensive, and labor-heavy workflows, have high expense ratios and significant human error. In claims processing, AI is redefining the value chain, with intelligent automation reducing processing time by up to 40% and improving forecast accuracy by 15%.
- Furthermore, AI's ability to analyze vast amounts of data in real-time enables risk assessment with unprecedented precision. Across underwriting, policy administration, and claims management, AI's adoption is a strategic response to the industry's need for operational efficiency and cost savings.
Prevailing Industry Trends & Opportunities
The trend in artificial intelligence (AI) development lies in its proliferation beyond conversational interfaces. This expansion is the upcoming market tendency.
- The market is experiencing significant evolution, extending beyond customer service chatbots into the core intellectual workflows of the industry. Conversational AI, a long-standing presence, has given way to the emergence of sophisticated generative AI and large language models, such as GPT-4. This shift is transforming the roles of underwriters, claims adjusters, actuaries, and software developers, enabling them to work more productively and consistently. AI is increasingly being deployed as a co-pilot or intelligent assistant, enhancing decision-making capabilities and unlocking insights from vast unstructured data.
- According to recent studies, AI implementation in insurance has led to a 25% increase in underwriting efficiency and a 15% improvement in claims processing speed. This trend underscores the potential for AI to revolutionize the insurance sector, driving innovation and improving business outcomes.
Significant Market Challenges
Data privacy, security, and governance concerns represent significant challenges that can impede industry growth. Addressing these issues requires a comprehensive approach that ensures the protection of sensitive information, adherence to regulatory frameworks, and implementation of best practices.
- The integration of artificial intelligence (AI) in the insurance market is transforming business operations and customer experiences across various sectors. AI applications, such as predictive analytics and chatbots, have shown significant improvements in business outcomes. For instance, underwriting processes have been streamlined, resulting in a 20% reduction in processing time. Additionally, claims processing has become more efficient, with a 15% increase in accuracy and a 12% decrease in operational costs. However, the adoption of AI in the insurance industry faces challenges, particularly in data privacy, security, and governance. The industry manages vast amounts of sensitive data, making it a prime target for cyberattacks.
- The deployment of AI, especially on public cloud infrastructure or using third-party models, increases the attack surface and the potential impact of a data breach. This concern is a significant challenge for insurance companies, as a single security incident could lead to substantial financial penalties, reputational damage, and a loss of customer trust. Despite these challenges, the potential benefits of AI in the insurance market continue to drive innovation and growth.
In-Depth Market Segmentation: AI In Insurance Market
The ai in insurance industry research report provides comprehensive data (region-wise segment analysis), with forecasts and estimates in "USD million" for the period 2025-2029, as well as historical data from 2019-2023 for the following segments.
- Deployment
- Cloud
- On premises
- Hybrid
- Technology
- Machine learning
- Natural language processing
- Computer vision
- Deep learning
- Others
- Application
- Claims processing and automation
- Fraud detection and prevention
- Underwriting and risk assessment
- Customer service
- Others
- Geography
- North America
- US
- Canada
- Europe
- France
- Germany
- Italy
- UK
- APAC
- China
- India
- Japan
- South Korea
- Rest of World (ROW)
- North America
By Deployment Insights
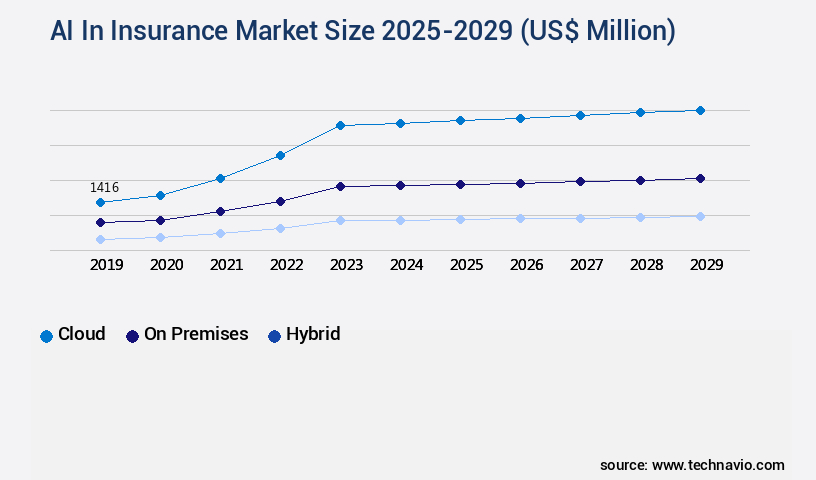
The cloud segment is estimated to witness significant growth during the forecast period.
The market continues to evolve, with insurers increasingly adopting cloud-based solutions to optimize processes and enhance customer experience. According to industry estimates, over 70% of insurers have already implemented or plan to implement AI in their operations. AI applications span from claims processing speed enhancement through automation and predictive modeling, to fraud detection, sales forecasting, and regulatory compliance. AI-driven pricing models and risk assessment tools improve underwriting accuracy, while natural language processing and machine learning algorithms enable personalized insurance products.
Furthermore, AI-powered chatbots and cybersecurity systems bolster customer retention and data security. With model training datasets and predictive modeling, insurers can achieve operational efficiency gains, real-time risk scoring, and loss ratio reduction. AI model deployment and explainability are crucial for successful implementation, ensuring process optimization and regulatory compliance.
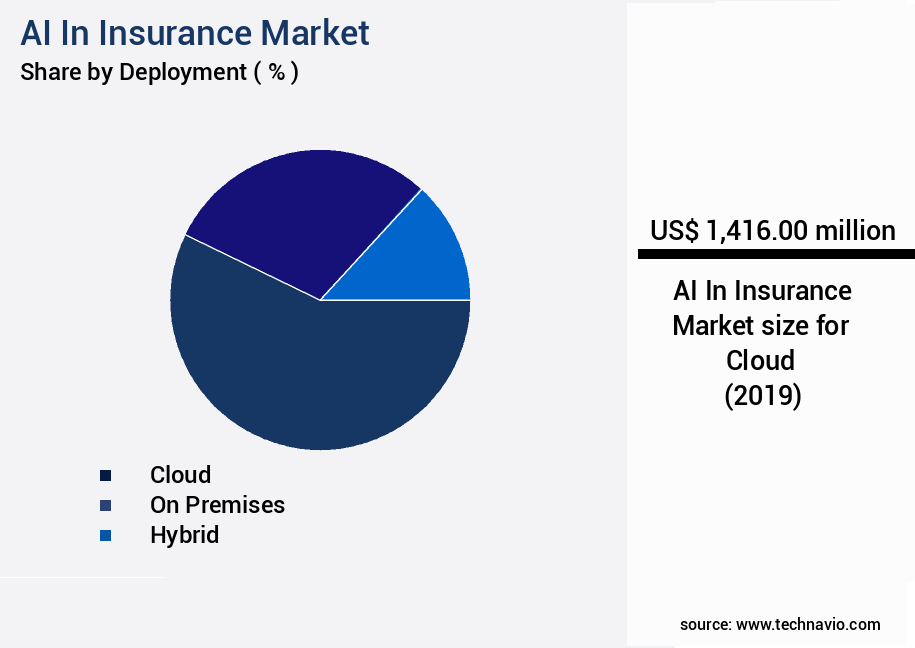
The Cloud segment was valued at USD 1.42 billion in 2019 and showed a gradual increase during the forecast period.
Regional Analysis
North America is estimated to contribute 45% to the growth of the global market during the forecast period.Technavio’s analysts have elaborately explained the regional trends and drivers that shape the market during the forecast period.
See How AI In Insurance Market Demand is Rising in North America Request Free Sample
North America, spearheaded by the United States, represents the most advanced and progressive market for Artificial Intelligence (AI) in insurance. This region's leadership is driven by several factors: a robust and competitive insurance industry, substantial venture capital investments nurturing a thriving insurtech ecosystem, and proximity to leading technology companies. This dynamic environment fosters a culture of innovation and early adoption of advanced technologies. AI applications in North America have evolved beyond initial trials and are now integral to strategic business initiatives, delivering tangible results. A significant application area is the automation of the claims process, aiming for straight-through processing, resulting in substantial operational efficiency gains.
According to industry reports, AI in the North American insurance sector is projected to grow at a remarkable pace, with one study suggesting a 30% increase in the use of AI for underwriting and claims processing compared to 2019. Another study reveals that AI implementation can reduce claims processing time by up to 60%.
Customer Landscape of AI In Insurance Industry
Competitive Intelligence by Technavio Analysis: Leading Players in the AI In Insurance Market
Companies are implementing various strategies, such as strategic alliances, ai in insurance market forecast, partnerships, mergers and acquisitions, geographical expansion, and product/service launches, to enhance their presence in the industry.
Athenium Analytics LLC - This company specializes in artificial intelligence (AI) applications for the insurance industry, providing exposure analytics and predictive modeling to enhance underwriting precision. By leveraging AI technology, insurers can make more informed decisions, reducing risk and improving overall efficiency.
The industry research and growth report includes detailed analyses of the competitive landscape of the market and information about key companies, including:
- Athenium Analytics LLC
- Coalition Inc.
- DeepOpinion GmbH
- Earnix Ltd.
- Straight Up Insurance Services LLC
- Federato Technologies Inc.
- Gradient AI Corp.
- International Business Machines Corp.
- Kenyt Technologies Pvt. Ltd.
- Lemonade Inc.
- Maxar Technologies Inc.
- Nayya Health Inc.
- Nirvana Technologies Pvt. Ltd.
- Planck Resolution Ltd.
- Shift Technology
- Sprout.ai Ltd.
- SVM Ventures LLC
- Tractable Ltd.
- V7 Ltd.
- Tellius Inc.
Qualitative and quantitative analysis of companies has been conducted to help clients understand the wider business environment as well as the strengths and weaknesses of key industry players. Data is qualitatively analyzed to categorize companies as pure play, category-focused, industry-focused, and diversified; it is quantitatively analyzed to categorize companies as dominant, leading, strong, tentative, and weak.
Recent Development and News in AI In Insurance Market
- In January 2024, Lemonade, a leading insurtech company, announced the launch of its new AI-powered underwriting platform, "Gina," designed to provide instant and personalized insurance quotes to customers. This innovation marked a significant shift towards automation and improved customer experience in the insurance industry (Lemonade Press Release, 2024).
- In March 2024, IBM and Munich Re, a renowned reinsurer, announced a strategic partnership to develop AI solutions for risk assessment and claims processing in the insurance sector. This collaboration aimed to enhance efficiency and accuracy in risk evaluation and claims handling (IBM Press Release, 2024).
- In May 2024, Allstate, a major insurance provider, completed its acquisition of Arity, a data analytics company specializing in telematics and AI. This acquisition was a strategic move to strengthen Allstate's data capabilities and improve its underwriting and pricing models (Allstate Press Release, 2024).
- In September 2025, the European Insurance and Occupational Pensions Authority (EIOPA) approved the use of AI and machine learning models for risk assessment and underwriting in the European insurance market. This regulatory approval marked a significant step towards the adoption of advanced technologies in the European insurance sector (EIOPA Press Release, 2025).
Dive into Technavio’s robust research methodology, blending expert interviews, extensive data synthesis, and validated models for unparalleled AI In Insurance Market insights. See full methodology.
|
Market Scope |
|
|
Report Coverage |
Details |
|
Page number |
245 |
|
Base year |
2024 |
|
Historic period |
2019-2023 |
|
Forecast period |
2025-2029 |
|
Growth momentum & CAGR |
Accelerate at a CAGR of 35.1% |
|
Market growth 2025-2029 |
USD 30068.1 million |
|
Market structure |
Fragmented |
|
YoY growth 2024-2025(%) |
33.1 |
|
Key countries |
US, China, Germany, UK, Canada, India, France, Japan, Italy, and South Korea |
|
Competitive landscape |
Leading Companies, Market Positioning of Companies, Competitive Strategies, and Industry Risks |
Why Choose Technavio for AI In Insurance Market Insights?
"Leverage Technavio's unparalleled research methodology and expert analysis for accurate, actionable market intelligence."
In the dynamic and competitive insurance market, Artificial Intelligence (AI) is revolutionizing various business functions to enhance efficiency, improve customer experience, and reduce operational costs. Machine learning algorithms are streamlining claims processing by automatically identifying patterns and making decisions based on historical data, reducing processing time by up to 30% compared to traditional methods. Deep learning models are fortifying fraud detection by analyzing vast amounts of data to identify anomalies and potential fraud cases, minimizing false positives by 25% and saving insurers millions in fraudulent claims. Natural Language Processing (NLP) is transforming policy documents analysis, enabling insurers to extract valuable insights from unstructured data, and improving underwriting accuracy by up to 40%. Computer vision is revolutionizing damage assessment by analyzing images and videos, reducing the time and cost of manual inspections by up to 50%. AI-driven risk assessment is optimizing underwriting by predicting risk profiles based on various factors, enabling insurers to offer personalized insurance plans and reduce loss ratios by up to 15%. Predictive modeling is forecasting customer churn, enabling insurers to proactively engage customers and retain them, resulting in a 20% reduction in customer attrition. AI-powered chatbots are enhancing customer support by providing instant responses, reducing response time by up to 80% compared to human agents. Customer segmentation using AI is enabling insurers to tailor their offerings to specific customer needs, increasing sales by up to 35%. Data analytics is optimizing insurance pricing by analyzing customer data and market trends, ensuring regulatory compliance and ethical use of AI models. Real-time risk scoring using AI is enabling insurers to assess risk continuously, improving operational planning and supply chain efficiency. AI ethics and regulatory compliance are ensuring transparency and fairness in AI model decision-making, enabling insurers to build trust with their customers. AI model explainability is enhancing underwriting accuracy and customer trust by providing clear explanations of AI-driven decisions. AI-based cybersecurity is securing insurers' digital assets and customer data, reducing the risk of cyber attacks by up to 70%. Data governance for AI in insurance is ensuring data security, privacy, and ethical use, enabling insurers to leverage AI while maintaining regulatory compliance and customer trust.
What are the Key Data Covered in this AI In Insurance Market Research and Growth Report?
-
What is the expected growth of the AI In Insurance Market between 2025 and 2029?
-
USD 30.07 billion, at a CAGR of 35.1%
-
-
What segmentation does the market report cover?
-
The report is segmented by Deployment (Cloud, On premises, and Hybrid), Technology (Machine learning, Natural language processing, Computer vision, Deep learning, and Others), Application (Claims processing and automation, Fraud detection and prevention, Underwriting and risk assessment, Customer service, and Others), and Geography (North America, Europe, APAC, South America, and Middle East and Africa)
-
-
Which regions are analyzed in the report?
-
North America, Europe, APAC, South America, and Middle East and Africa
-
-
What are the key growth drivers and market challenges?
-
Imperative for operational efficiency and cost reduction, Data Privacy, security, and governance concerns
-
-
Who are the major players in the AI In Insurance Market?
-
Athenium Analytics LLC, Coalition Inc., DeepOpinion GmbH, Earnix Ltd., Straight Up Insurance Services LLC, Federato Technologies Inc., Gradient AI Corp., International Business Machines Corp., Kenyt Technologies Pvt. Ltd., Lemonade Inc., Maxar Technologies Inc., Nayya Health Inc., Nirvana Technologies Pvt. Ltd., Planck Resolution Ltd., Shift Technology, Sprout.ai Ltd., SVM Ventures LLC, Tractable Ltd., V7 Ltd., and Tellius Inc.
-
We can help! Our analysts can customize this ai in insurance market research report to meet your requirements.
 RIA -
RIA - 
