AI In Logistics And Supply Chain Market Size 2025-2029
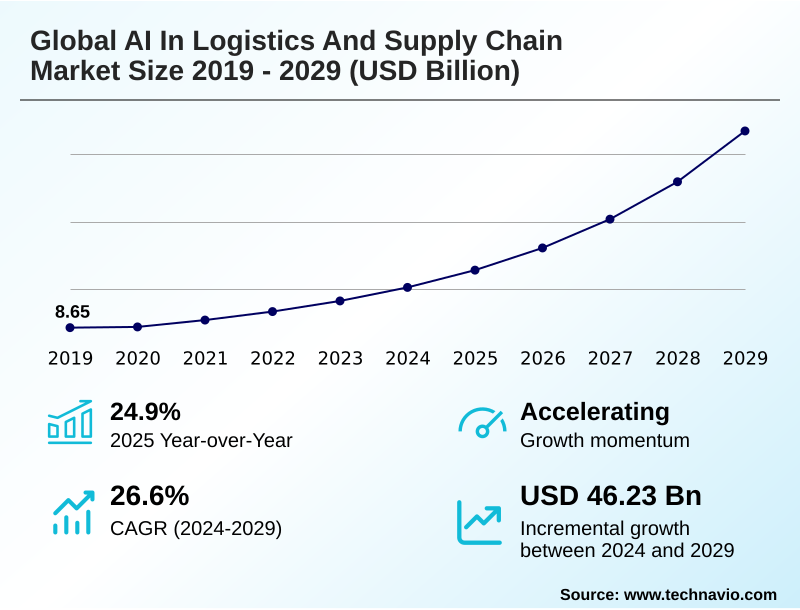
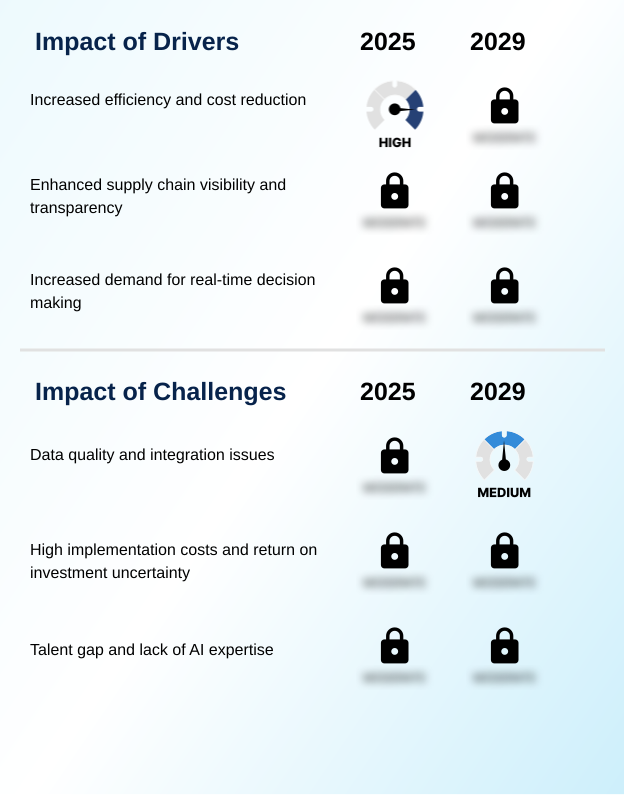
The ai in logistics and supply chain market size is valued to increase by USD 46.23 billion, at a CAGR of 26.6% from 2024 to 2029. Increased efficiency and cost reduction will drive the ai in logistics and supply chain market.
Major Market Trends & Insights
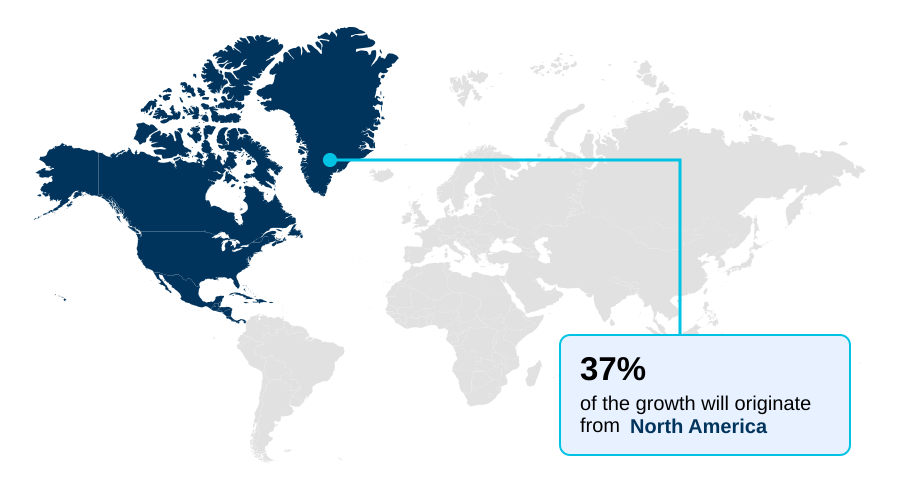
- North America dominated the market and accounted for a 36.7% growth during the forecast period.
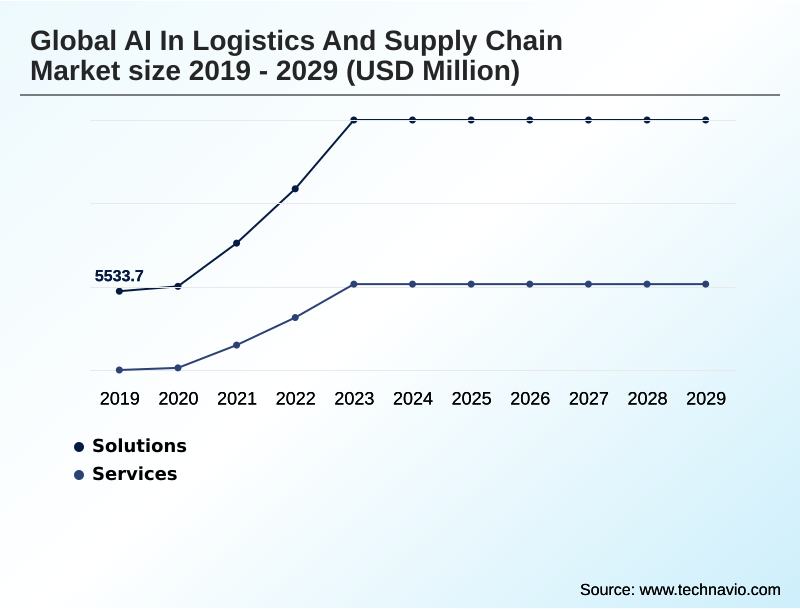
- By Component - Solutions segment was valued at USD 10.79 billion in 2023
- By Deployment - Cloud segment accounted for the largest market revenue share in 2023
Market Size & Forecast
- Market Opportunities: USD 58.12 billion
- Market Future Opportunities: USD 46.23 billion
- CAGR from 2024 to 2029 : 26.6%
Market Summary
- The AI in logistics and supply chain market is defined by a strategic shift toward intelligent automation and data-driven operations. Key drivers include the pressing need for greater operational efficiency, enhanced end-to-end visibility, and real-time decision-making capabilities. Businesses are deploying advanced AI technologies to tackle complex challenges, from optimizing transportation networks to automating warehouse functions.
- For example, a global retailer facing an unexpected surge in demand for a specific product can leverage AI-powered demand forecasting to anticipate inventory needs across different regions. Subsequently, AI-driven dynamic routing algorithms can readjust last-mile delivery schedules in real-time, accounting for traffic and driver availability to ensure fulfillment deadlines are met.
- This level of agility is becoming essential for maintaining a competitive edge. However, the market is not without its challenges. The successful implementation of these sophisticated systems is often constrained by issues of data quality and integration, alongside a persistent talent gap in specialized AI expertise.
- As the market evolves, the emergence of generative AI for supply chain optimization and a focus on predictive risk management are becoming prominent trends, signaling a move toward more resilient and proactive supply chain ecosystems.
What will be the Size of the AI In Logistics And Supply Chain Market during the forecast period?
Get Key Insights on Market Forecast (PDF) Get Free Sample
How is the AI In Logistics And Supply Chain Market Segmented?
The ai in logistics and supply chain industry research report provides comprehensive data (region-wise segment analysis), with forecasts and estimates in "USD million" for the period 2025-2029, as well as historical data from 2019-2023 for the following segments.
- Component
- Solutions
- Services
- Deployment
- Cloud
- On premises
- Application
- Supply chain planning
- Warehouse management
- Transportation management
- Fleet management
- Others
- Geography
- North America
- US
- Canada
- Mexico
- APAC
- China
- India
- Japan
- Europe
- Germany
- France
- UK
- Middle East and Africa
- Saudi Arabia
- UAE
- South Africa
- South America
- Brazil
- Argentina
- Colombia
- Rest of World (ROW)
- North America
By Component Insights
The solutions segment is estimated to witness significant growth during the forecast period.
The AI in logistics and supply chain market's solutions segment is driven by the need for enhanced automation and optimized decision-making.
These offerings include advanced analytics platforms for predictive maintenance and route optimization software that leverages real-time data to improve efficiency.
AI-powered warehouse automation technologies are central to this segment, with robotic picking systems demonstrating a reduction in fulfillment errors by up to 25%. These solutions utilize machine learning models and intelligent process automation to manage complex operations.
The goal is to create a more resilient and responsive supply chain through proactive risk management and improved demand forecasting accuracy.
This data-driven approach, supported by intelligent decision-making, transforms traditional logistics into highly efficient, automated workflows, enhancing overall supply chain agility.
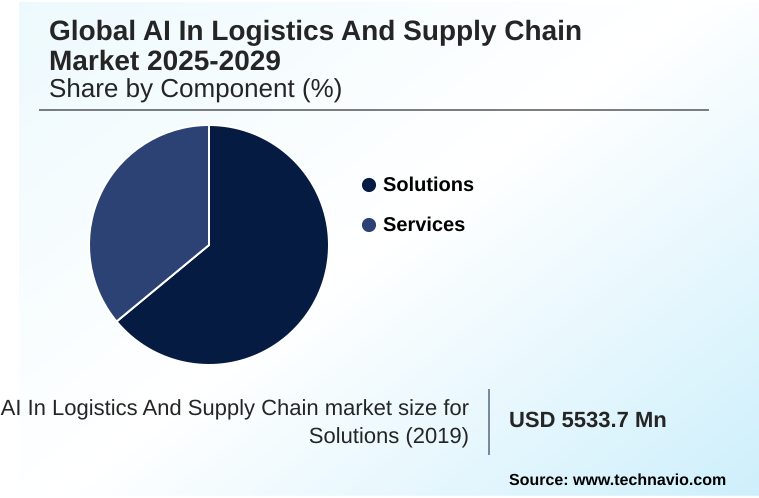
The Solutions segment was valued at USD 10.79 billion in 2023 and showed a gradual increase during the forecast period.
Regional Analysis
North America is estimated to contribute 36.7% to the growth of the global market during the forecast period.Technavio’s analysts have elaborately explained the regional trends and drivers that shape the market during the forecast period.
See How AI In Logistics And Supply Chain Market Demand is Rising in North America Get Free Sample
The geographic landscape of the market is led by North America, which accounts for over 36% of the incremental growth opportunity, driven by advanced infrastructure and high technology adoption rates in the US and Canada.
In this region, a focus on intelligent transportation systems and warehouse execution systems addresses challenges like rising labor costs.
Meanwhile, the APAC region is the fastest-growing market, propelled by its expanding manufacturing base and burgeoning e-commerce sector in China and India.
The adoption of AI at major APAC ports has been shown to reduce vessel turnaround times by 15%, highlighting the technology's impact on operational efficiency.
The integration of sustainable logistics practices and multi-enterprise collaboration platforms is a key trend in Europe, while the Middle East and Africa are emerging as high-potential markets due to significant investments in smart logistics hubs.
Market Dynamics
Our researchers analyzed the data with 2024 as the base year, along with the key drivers, trends, and challenges. A holistic analysis of drivers will help companies refine their marketing strategies to gain a competitive advantage.
- Achieving a competitive edge in modern commerce increasingly depends on mastering logistics, with a clear focus on using AI to improve inventory accuracy and operational flow. The strategic implementation of ai for last-mile delivery optimization is critical for customer satisfaction, directly impacting brand loyalty.
- In parallel, the use of generative AI in supply chain planning allows organizations to model and de-risk complex scenarios with unprecedented speed. AI-powered demand forecasting models have become foundational, moving beyond historical data to incorporate real-time market signals. For asset-intensive operations, machine learning for predictive maintenance is essential, minimizing downtime and extending equipment life.
- Within distribution centers, computer vision in warehouse management automates quality control and inventory checks. The deployment of RPA for logistics administrative tasks frees up human capital for higher-value activities, while intelligent route optimization for fleets reduces fuel costs and emissions. Creating a digital twin for supply chain simulation enables stress-testing of networks without real-world risk.
- AI in cold chain logistics monitoring ensures the integrity of sensitive goods like pharmaceuticals and food. Furthermore, predictive analytics for supply chain risk helps businesses anticipate and mitigate disruptions before they escalate. Firms leveraging AI-driven transportation management systems report nearly double the on-time delivery rates compared to those using legacy tools.
- Automating procurement with artificial intelligence streamlines sourcing and enhances negotiation outcomes. Other key applications include AI applications for freight consolidation and enhancing supply chain visibility with AI. The push for ai for sustainable logistics practices is also gaining momentum. AI-powered workforce management in warehouses optimizes labor deployment, while anomaly detection in shipping lanes enhances security.
- Finally, optimizing warehouse slotting with ai and enabling real-time decision-making in logistics are key to creating truly adaptive supply chains.
What are the key market drivers leading to the rise in the adoption of AI In Logistics And Supply Chain Industry?
- The pursuit of increased efficiency and substantial cost reduction serves as a paramount driver for the global AI in logistics and supply chain market.
- Market growth is fundamentally driven by the pursuit of enhanced efficiency and visibility. AI-driven route optimization software consistently reduces fuel costs by 10-15% through intelligent decision-making and dynamic routing.
- Simultaneously, the deployment of platforms offering real-time visibility and end-to-end visibility has lowered stockout incidents by 20%, directly improving customer satisfaction and revenue.
- These drivers compel investment in technologies such as autonomous mobile robots and advanced analytics platforms that deliver quantifiable returns.
- The ability to leverage cognitive insights from vast datasets for fleet management solutions and procurement optimization is creating more resilient and cost-effective supply chains.
- This focus on tangible outcomes solidifies AI’s role as a critical enabler of modern logistics, fostering greater human-robot collaboration and superior operational control.
What are the market trends shaping the AI In Logistics And Supply Chain Industry?
- The trend of hyperautomation is reshaping warehouses and distribution centers. This involves applying advanced technologies to automate processes, driving significant gains in operational efficiency and accuracy.
- Key market trends are centered on achieving new levels of automation and intelligence. The adoption of hyperautomation, supported by technologies like automated guided vehicles and robotic process automation, has increased warehouse throughput by up to 30% during peak operational periods.
- This drive for operational efficiency is complemented by the emergence of generative AI applications, which can produce viable supply chain disruption scenarios 50% faster than manual analysis. Such capabilities are transforming sales and operations planning and supply chain network design. The integration of computer vision systems for quality control and inventory optimization contributes to this trend.
- These advancements are enabling more sophisticated logistics network optimization and smarter warehouse automation technologies, pushing the boundaries of what is possible in automated fulfillment and strategic planning.
What challenges does the AI In Logistics And Supply Chain Industry face during its growth?
- Persistent data quality and integration issues represent a significant challenge that impedes the effective adoption and growth of AI in the logistics industry.
- Despite strong drivers, the market faces significant challenges, primarily related to data and implementation complexities. Data harmonization remains a primary obstacle, with data cleansing efforts consuming up to 60% of the initial project timeline for many AI deployments. High upfront costs for systems like a digital twin of an organization and the uncertainty of ROI also temper adoption rates.
- However, organizations that successfully overcome these hurdles report an average ROI within 24 months. The talent gap for professionals skilled in AI-powered chatbots and smart contract analysis further complicates matters.
- Addressing these issues through investment in data infrastructure and workforce upskilling is crucial for unlocking the full potential of AI for anomaly detection and other advanced applications, ensuring long-term supply chain resilience.
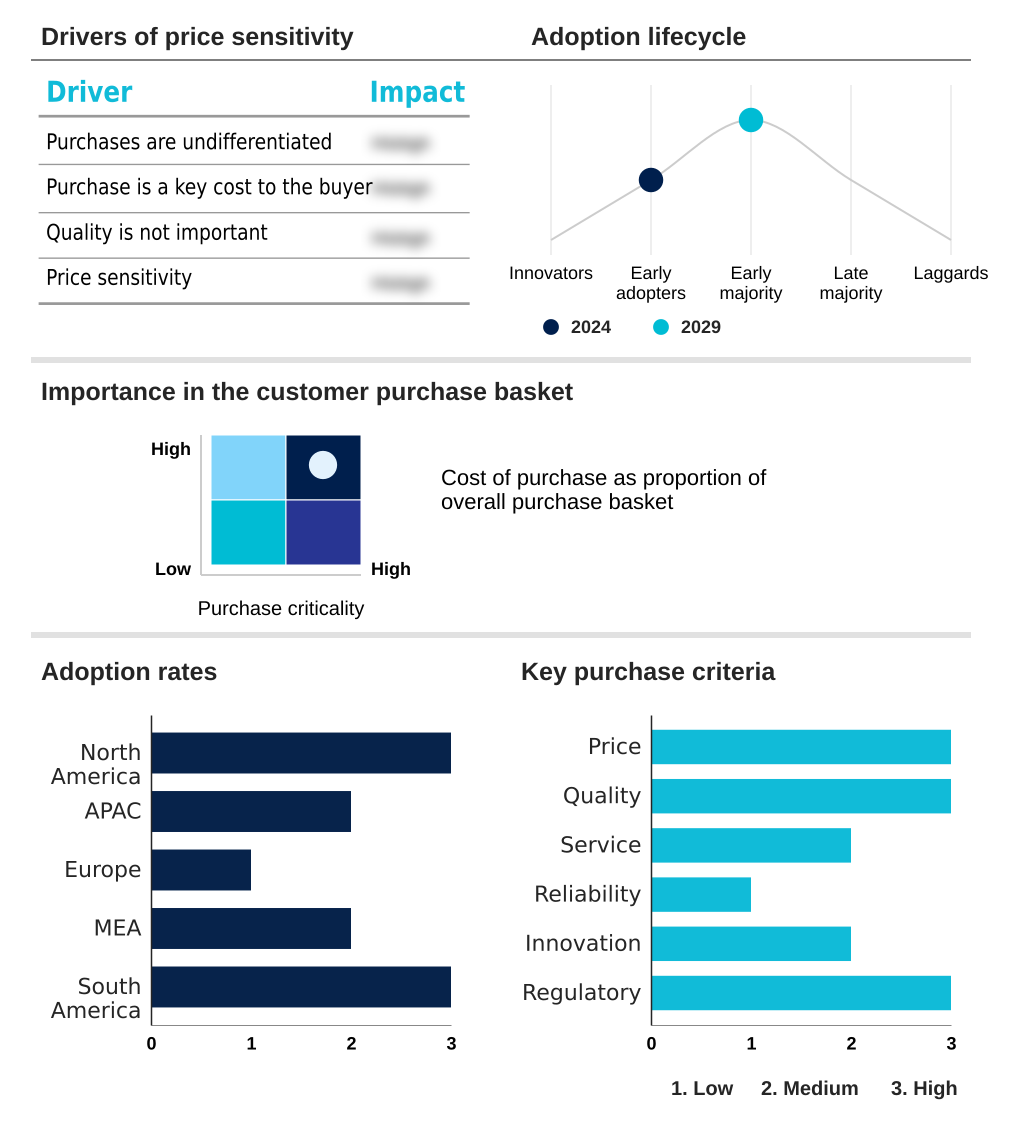
Exclusive Technavio Analysis on Customer Landscape
The ai in logistics and supply chain market forecasting report includes the adoption lifecycle of the market, covering from the innovator’s stage to the laggard’s stage. It focuses on adoption rates in different regions based on penetration. Furthermore, the ai in logistics and supply chain market report also includes key purchase criteria and drivers of price sensitivity to help companies evaluate and develop their market growth analysis strategies.
Customer Landscape of AI In Logistics And Supply Chain Industry
Competitive Landscape
Companies are implementing various strategies, such as strategic alliances, ai in logistics and supply chain market forecast, partnerships, mergers and acquisitions, geographical expansion, and product/service launches, to enhance their presence in the industry.
Amazon.com Inc. - Delivers a suite of AI-powered solutions, including predictive demand planning and logistics automation, to optimize supply chain operations and enhance decision-making across the value chain.
The industry research and growth report includes detailed analyses of the competitive landscape of the market and information about key companies, including:
- Amazon.com Inc.
- Aramex International LLC
- Blue Yonder Group Inc.
- C H Robinson Worldwide Inc.
- Coupa Software Inc.
- DP World
- E2open Parent Holdings Inc.
- Fourkites Inc.
- GEP
- Google LLC
- Infor Inc.
- IBM Corp.
- Microsoft Corp.
- Oracle Corp.
- project44
- SAP SE
- Symbotic Inc.
- XPO Inc.
- Zebra Technologies Corp.
Qualitative and quantitative analysis of companies has been conducted to help clients understand the wider business environment as well as the strengths and weaknesses of key industry players. Data is qualitatively analyzed to categorize companies as pure play, category-focused, industry-focused, and diversified; it is quantitatively analyzed to categorize companies as dominant, leading, strong, tentative, and weak.
Recent Development and News in Ai in logistics and supply chain market
- In November 2024, Oracle Corp. launched its new AI-driven 'Fusion Cloud SCM Intelligence Suite', enhancing its supply chain platform with generative AI for scenario modeling and risk simulation.
- In January 2025, Blue Yonder Group Inc. announced a strategic partnership with a leading robotics firm to integrate advanced autonomous mobile robots (AMRs) into its Luminate Warehouse Management System (WMS).
- In September 2024, FourKites Inc. secured a USD 150 million Series E funding round to expand its real-time visibility platform's predictive analytics capabilities and accelerate its market penetration in APAC.
- In March 2025, project44 announced the opening of a new regional headquarters in Dubai to better serve the growing demand for supply chain visibility solutions in the Middle East and Africa.
Dive into Technavio’s robust research methodology, blending expert interviews, extensive data synthesis, and validated models for unparalleled AI In Logistics And Supply Chain Market insights. See full methodology.
| Market Scope | |
|---|---|
| Page number | 295 |
| Base year | 2024 |
| Historic period | 2019-2023 |
| Forecast period | 2025-2029 |
| Growth momentum & CAGR | Accelerate at a CAGR of 26.6% |
| Market growth 2025-2029 | USD 46225.9 million |
| Market structure | Fragmented |
| YoY growth 2024-2025(%) | 24.9% |
| Key countries | US, Canada, Mexico, China, India, Japan, South Korea, Australia, Indonesia, Germany, France, UK, Italy, The Netherlands, Spain, Saudi Arabia, UAE, South Africa, Israel, Turkey, Brazil, Argentina and Colombia |
| Competitive landscape | Leading Companies, Market Positioning of Companies, Competitive Strategies, and Industry Risks |
Research Analyst Overview
- The AI in logistics and supply chain market is characterized by the integration of sophisticated technologies to refine complex operational workflows. The implementation of intelligent process automation has been shown to reduce order processing times by over 40%, a compelling metric for boardroom decisions on technology investment.
- Advanced analytics platforms and machine learning models are central to this transformation, enabling predictive analytics for demand sensing and dynamic routing. In warehouse environments, robotic process automation and computer vision systems work in tandem with automated guided vehicles and autonomous mobile robots to streamline fulfillment.
- Key applications such as intelligent transportation systems, inventory slotting, and a supply chain control tower provide real-time visibility and cognitive planning capabilities. The use of a digital twin of an organization for scenario planning is becoming more prevalent. Furthermore, predictive maintenance insights are increasingly influencing capital expenditure budgets for fleet management.
- The technology also supports ethical sourcing compliance and sustainable logistics practices through enhanced real-time shipment tracking and freight procurement optimization, ultimately enabling more strategic and intelligent decision-making across the entire value chain, from load planning and consolidation to last-mile delivery optimization and the management of cold chain logistics.
What are the Key Data Covered in this AI In Logistics And Supply Chain Market Research and Growth Report?
-
What is the expected growth of the AI In Logistics And Supply Chain Market between 2025 and 2029?
-
USD 46.23 billion, at a CAGR of 26.6%
-
-
What segmentation does the market report cover?
-
The report is segmented by Component (Solutions, Services), Deployment (Cloud, On premises), Application (Supply chain planning, Warehouse management, Transportation management, Fleet management, Others) and Geography (North America, APAC, Europe, Middle East and Africa, South America)
-
-
Which regions are analyzed in the report?
-
North America, APAC, Europe, Middle East and Africa and South America
-
-
What are the key growth drivers and market challenges?
-
Increased efficiency and cost reduction, Data quality and integration issues
-
-
Who are the major players in the AI In Logistics And Supply Chain Market?
-
Amazon.com Inc., Aramex International LLC, Blue Yonder Group Inc., C H Robinson Worldwide Inc., Coupa Software Inc., DP World, E2open Parent Holdings Inc., Fourkites Inc., GEP, Google LLC, Infor Inc., IBM Corp., Microsoft Corp., Oracle Corp., project44, SAP SE, Symbotic Inc., XPO Inc. and Zebra Technologies Corp.
-
Market Research Insights
- The dynamics of the AI in logistics and supply chain market are shaped by the tangible benefits of intelligent automation. Implementations of demand sensing and cognitive planning have demonstrated up to a 20% improvement in demand forecasting accuracy, directly impacting inventory levels. Concurrently, business process automation within warehouses has reduced manual processing costs by over 30%.
- These outcomes are driving the adoption of solutions that foster greater supply chain agility and enable robust, data-driven decision-making. As organizations prioritize operational efficiency, the focus on technologies that offer quantifiable returns, such as AI-powered spend analytics and dynamic resource allocation, intensifies.
- The ability to achieve such improvements reinforces the strategic value of AI in building resilient and competitive supply chain operations.
We can help! Our analysts can customize this ai in logistics and supply chain market research report to meet your requirements.
 RIA -
RIA - 
