
AI In Medical Coding Market Size 2025-2029
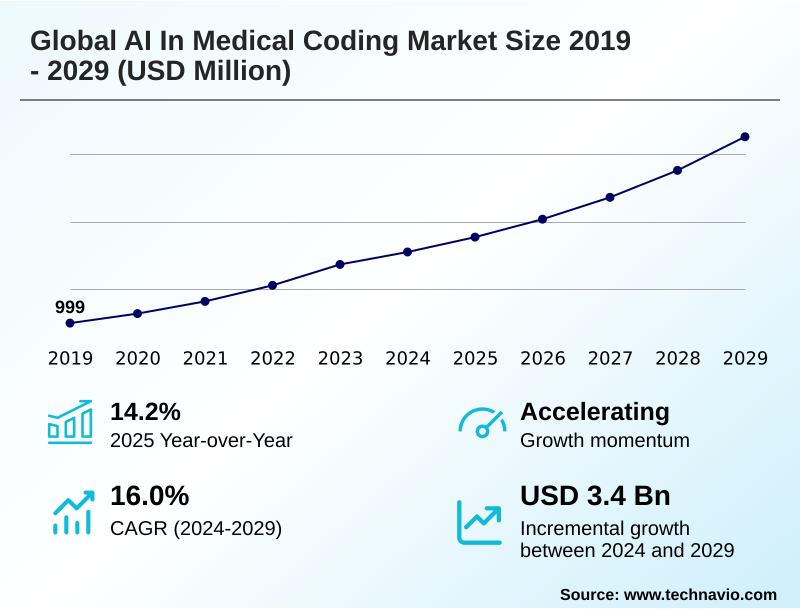
The ai in medical coding market size is valued to increase by USD 3.40 billion, at a CAGR of 16% from 2024 to 2029. Imperative for enhanced coding accuracy and efficiency will drive the ai in medical coding market.
Major Market Trends & Insights
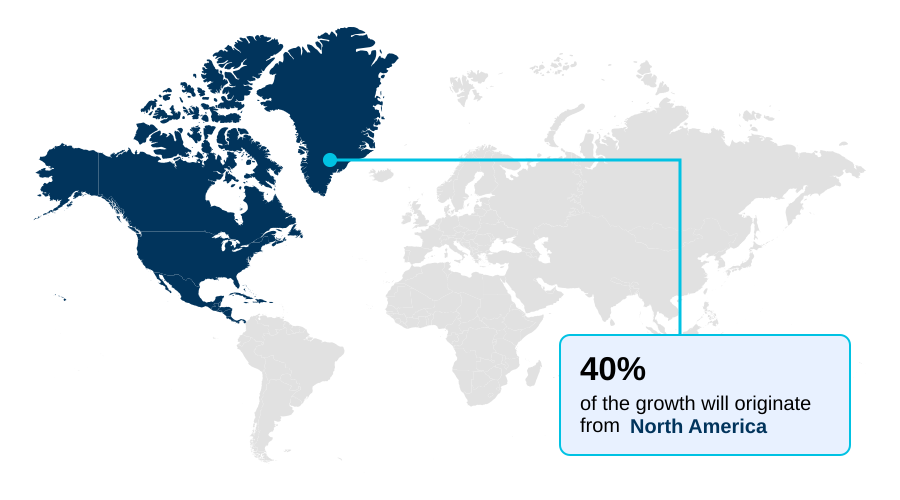
- North America dominated the market and accounted for a 40.3% growth during the forecast period.
- By Application - Automated coding segment was valued at USD 1.41 billion in 2023
- By Technology - Natural language processing segment accounted for the largest market revenue share in 2023
Market Size & Forecast
- Market Opportunities: USD 5.51 billion
- Market Future Opportunities: USD 3.40 billion
- CAGR from 2024 to 2029 : 16%
Market Summary
- The AI in medical coding market is driven by the critical need to enhance administrative efficiency and financial accuracy within healthcare. Persistent challenges, such as a shortage of skilled personnel and the high potential for human error in manual processes, have accelerated the adoption of intelligent automation.
- Technologies like natural language processing and machine learning form the core of these solutions, enabling systems to interpret unstructured clinical notes and suggest accurate codes. For instance, a hospital system can deploy an AI-driven platform for computer-assisted coding to pre-screen all outbound claims against payer-specific policies, flagging potential errors before submission.
- This proactive approach significantly aids claims denial management and strengthens revenue cycle management. As the industry moves toward value-based care, the demand for high-quality, granular data derived from precise coding becomes even more paramount.
- The role of AI in clinical documentation improvement and its integration with existing EHR platforms are key trends defining the market's trajectory, promising a future of more streamlined and data-driven healthcare operations.
What will be the Size of the AI In Medical Coding Market during the forecast period?
Get Key Insights on Market Forecast (PDF) Get Free Sample
How is the AI In Medical Coding Market Segmented?
The ai in medical coding industry research report provides comprehensive data (region-wise segment analysis), with forecasts and estimates in "USD million" for the period 2025-2029, as well as historical data from 2019-2023 for the following segments.
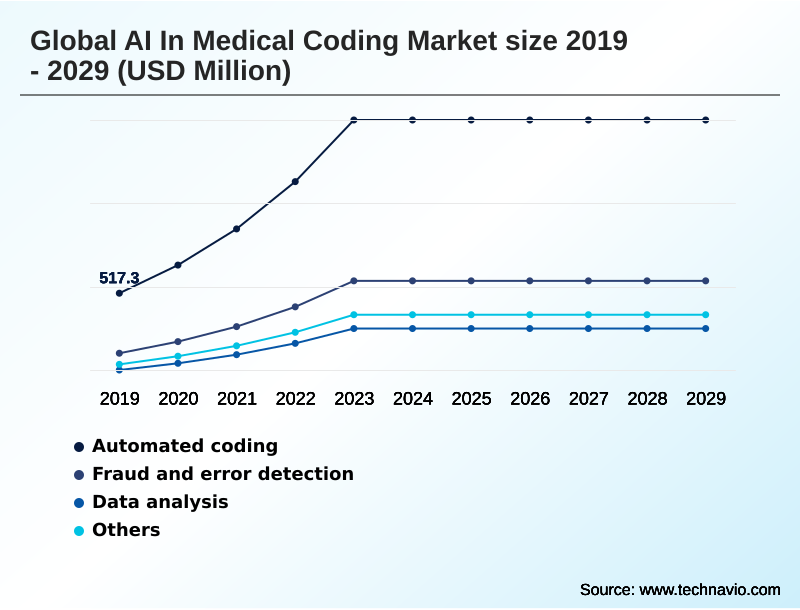
- Application
- Automated coding
- Fraud and error detection
- Data analysis
- Others
- Technology
- Natural language processing
- Machine learning
- Robotic process automation
- Type
- Outsourced
- In-house
- Geography
- North America
- US
- Canada
- Mexico
- Europe
- Germany
- UK
- France
- APAC
- China
- Japan
- India
- Middle East and Africa
- UAE
- Saudi Arabia
- South Africa
- South America
- Brazil
- Argentina
- Colombia
- Rest of World (ROW)
- North America
By Application Insights
The automated coding segment is estimated to witness significant growth during the forecast period.
The automated coding segment is central to the global AI in medical coding market, leveraging natural language processing and machine learning to interpret unstructured clinical documentation.
This technology enables autonomous coding by automatically assigning correct ICD-10 and CPT code assignments, which is critical for effective revenue cycle management.
By facilitating seamless EHR integration and providing real-time code suggestions, these platforms drastically reduce manual errors and accelerate billing cycles. For instance, providers implementing computer-assisted coding have reported productivity gains of over 40%, significantly improving claims denial management.
This application of AI addresses the core industry challenges of inefficiency and inaccuracy, ensuring that healthcare organizations can optimize financial performance while maintaining high compliance standards with payer-specific policies.
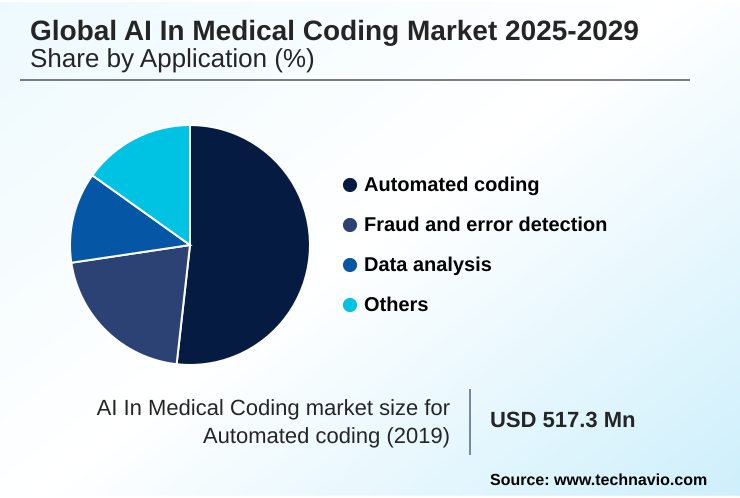
The Automated coding segment was valued at USD 1.41 billion in 2023 and showed a gradual increase during the forecast period.
Regional Analysis
North America is estimated to contribute 40.3% to the growth of the global market during the forecast period.Technavio’s analysts have elaborately explained the regional trends and drivers that shape the market during the forecast period.
See How AI In Medical Coding Market Demand is Rising in North America Get Free Sample
Geographically, the market is led by North America, which is poised to contribute over 40% of the incremental growth, a result of its complex reimbursement systems and the high adoption rate of digital health technologies.
The demand for HIPAA compliant AI coding solutions to improve billing accuracy and support AI for value-based care models is a significant driver in this region.
Meanwhile, APAC is emerging as the fastest-growing region, where escalating healthcare expenditures and government-led digitalization initiatives are creating fertile ground for adoption.
Providers in this region are leveraging AI coding for specialty clinics and other automation tools to manage expanding patient loads and streamline operations.
This investment in technology enables healthcare systems to leapfrog legacy processes, with some achieving a 15% improvement in administrative task efficiency within the first year of implementation.
Market Dynamics
Our researchers analyzed the data with 2024 as the base year, along with the key drivers, trends, and challenges. A holistic analysis of drivers will help companies refine their marketing strategies to gain a competitive advantage.
- Achieving end-to-end revenue cycle automation requires a strategic approach that goes beyond basic tools. A comprehensive cost benefit analysis of AI coding often reveals that integrating an AI platform for ICD-10-CM/PCS is just the first step.
- The real value emerges when using NLP to extract clinical concepts, which feeds into autonomous coding for outpatient encounters and helps in improving DRG assignment with AI. This process is reinforced by AI's role in clinical documentation improvement, which ensures high-quality data from the start.
- On the operational side, automating prior authorization with RPA and using machine learning to identify upcoding are critical for compliance. The technology's impact is also measured by its effect on ai coding impact on coder productivity and its ability to provide real time coding suggestions in ehr.
- For more advanced use cases, generative AI for summarizing patient notes offers further efficiencies. Managing data privacy in AI coding and integrating AI with legacy EHR systems remain key implementation hurdles. However, success stories show that AI for reducing discharged-not-final-billed days and its ability to address ai solutions for medical coder shortage make a compelling case.
- The move toward compliance monitoring with ai algorithms, supported by robust ai training for medical coding staff, solidifies the technology's central role. Organizations that successfully implement these systems report a reduction in DNFB days that is twice as effective as those using only standalone tools.
What are the key market drivers leading to the rise in the adoption of AI In Medical Coding Industry?
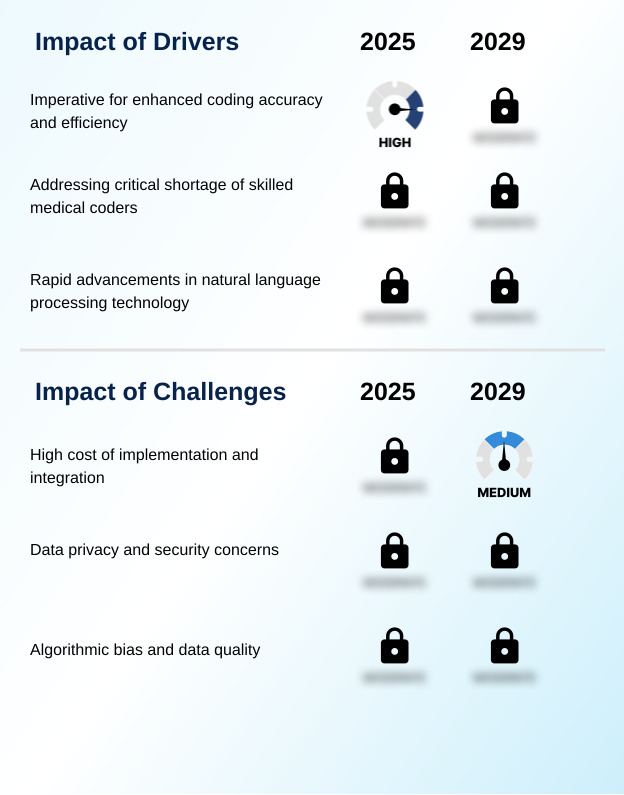
- The imperative for enhanced coding accuracy and efficiency is a primary driver, addressing revenue leakage and regulatory non-compliance from manual errors.
- The market's rapid expansion is propelled by the dual pressures of a critical labor shortage and an unrelenting demand for financial accuracy.
- The demand for certified coders continues to outstrip supply, creating significant operational backlogs and revenue cycle delays for healthcare providers.
- AI-driven platforms are directly addressing medical coder shortage by automating a substantial portion of the coding workload, with some systems processing records up to 80% faster than manual methods.
- This automation is crucial for improving coder productivity and achieving superior ai for medical billing accuracy. By handling high-volume, repetitive tasks, AI frees up human experts to manage complex cases, ensuring both efficiency and quality.
- This technological augmentation provides a scalable and sustainable solution to a persistent industry-wide problem.
What are the market trends shaping the AI In Medical Coding Industry?
- The ascendancy of generative AI and natural language processing is fundamentally reshaping the market. These technologies enable a more nuanced and accurate interpretation of complex clinical documentation.
- Key trends are reshaping the medical coding landscape, driven by the integration of generative AI and autonomous systems. The emergence of ambient AI scribe technology, which captures and documents patient encounters in real time, is revolutionizing clinical documentation. This, combined with advanced natural language processing for automating coding workflows, is significantly improving efficiency.
- Leading platforms now automate over 90% of routine coding tasks, allowing human coders to focus on more complex cases. Furthermore, organizations adopting these integrated solutions have reported up to a 40% increase in coder productivity.
- This shift from simple automation to intelligent, autonomous systems that leverage generative AI in clinical notes is redefining the standards for accuracy and speed in revenue cycle management.
What challenges does the AI In Medical Coding Industry face during its growth?
- The high cost of implementation and integration presents a significant challenge, particularly for smaller healthcare organizations with limited budgets.
- Significant challenges constrain widespread adoption, primarily revolving around cost, security, and data integrity. The initial cost of AI coding implementation can range from tens of thousands to millions of dollars, creating a substantial financial barrier for many healthcare organizations.
- Concurrently, the necessity for HIPAA compliant AI coding introduces complexity, as healthcare data is a prime target for cyberattacks, with security breaches in the sector increasing by over 15% in the last year. Furthermore, the risk of mitigating algorithmic bias in healthcare is a critical ethical concern.
- If training data is not representative, AI systems can perpetuate and even amplify health disparities, undermining the technology's potential benefits and creating significant compliance and reputational risks.
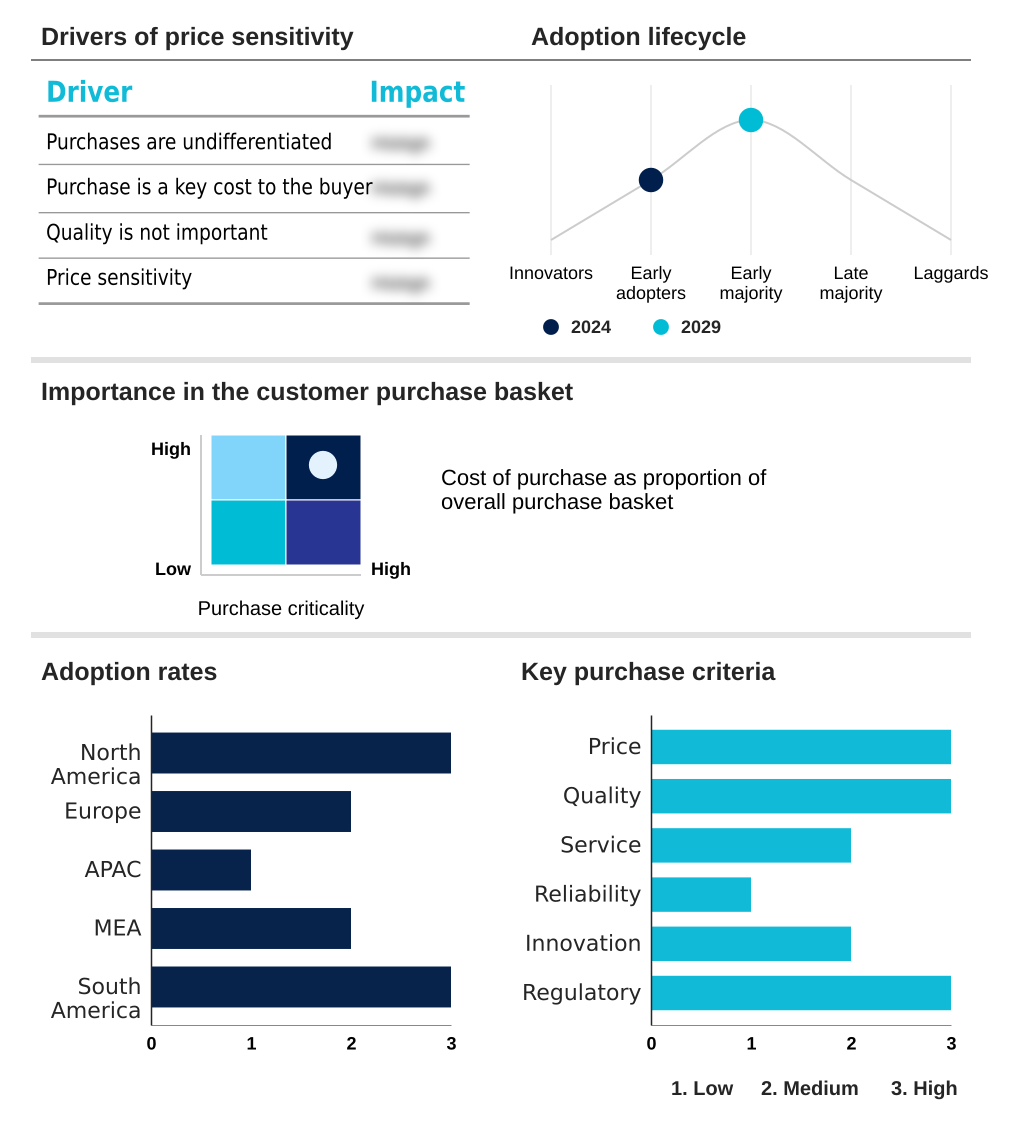
Exclusive Technavio Analysis on Customer Landscape
The ai in medical coding market forecasting report includes the adoption lifecycle of the market, covering from the innovator’s stage to the laggard’s stage. It focuses on adoption rates in different regions based on penetration. Furthermore, the ai in medical coding market report also includes key purchase criteria and drivers of price sensitivity to help companies evaluate and develop their market growth analysis strategies.
Customer Landscape of AI In Medical Coding Industry
Competitive Landscape
Companies are implementing various strategies, such as strategic alliances, ai in medical coding market forecast, partnerships, mergers and acquisitions, geographical expansion, and product/service launches, to enhance their presence in the industry.
3M Co. - Offerings center on AI platforms that use natural language processing and machine learning to automate code assignment, streamline revenue cycle management, and enhance coding accuracy for compliance.
The industry research and growth report includes detailed analyses of the competitive landscape of the market and information about key companies, including:
- 3M Co.
- AGS Health LLC
- Aideo Technologies LLC
- CodaMetrix
- CureMD
- Datavant
- Dolbey Systems Inc.
- Fathom Health
- FinThrive Inc.
- GaleAI Inc.
- GeBBS Healthcare Solutions Inc.
- HealthOrbit AI
- Medicodio Inc.
- MiMedx Group Inc.
- Nuance Communications Inc.
- Nym Health
- Optum
- XpertDox LLC
Qualitative and quantitative analysis of companies has been conducted to help clients understand the wider business environment as well as the strengths and weaknesses of key industry players. Data is qualitatively analyzed to categorize companies as pure play, category-focused, industry-focused, and diversified; it is quantitatively analyzed to categorize companies as dominant, leading, strong, tentative, and weak.
Recent Development and News in Ai in medical coding market
- In September, 2024, WhizAI introduced a new platform integrating a domain-tuned Large Language Model and an intent-ready NLP engine to provide life sciences companies with more accurate, privacy-focused conversational analytics.
- In November, 2024, Google Cloud announced a collaboration with DeliverHealth to leverage its Gemini 1.5 Pro models to improve the accuracy and speed of clinical documentation through voice dictation.
- In December, 2024, Maverick Medical AI announced the completed deployment of its autonomous AI medical coding solution across all 399 of RadNet sites to optimize operational costs and enhance reimbursement.
- In January, 2025, NVIDIA announced strategic collaborations with healthcare leaders, including the Mayo Clinic, to develop AI-powered digital pathology, creating advanced pathology foundation models to improve cancer diagnosis.
Dive into Technavio’s robust research methodology, blending expert interviews, extensive data synthesis, and validated models for unparalleled AI In Medical Coding Market insights. See full methodology.
| Market Scope | |
|---|---|
| Page number | 303 |
| Base year | 2024 |
| Historic period | 2019-2023 |
| Forecast period | 2025-2029 |
| Growth momentum & CAGR | Accelerate at a CAGR of 16% |
| Market growth 2025-2029 | USD 3404.9 million |
| Market structure | Fragmented |
| YoY growth 2024-2025(%) | 14.2% |
| Key countries | US, Canada, Mexico, Germany, UK, France, Italy, Spain, The Netherlands, China, Japan, India, South Korea, Australia, Indonesia, UAE, Saudi Arabia, South Africa, Israel, Turkey, Brazil, Argentina and Colombia |
| Competitive landscape | Leading Companies, Market Positioning of Companies, Competitive Strategies, and Industry Risks |
Research Analyst Overview
- The AI in medical coding market is shaped by a confluence of technological advancement and operational necessity, where organizations must weigh investment in autonomous coding against the inefficiencies of manual processes.
- A critical boardroom decision involves the large-scale EHR integration of sophisticated platforms that promise not just automation but also enhanced data integrity through rigorous data anonymization and federated learning models. The core technologies driving this shift include natural language processing, machine learning, and robotic process automation, which underpin capabilities like real-time code suggestion and predictive coding analytics.
- Solutions are increasingly focused on delivering audit-ready medical codes to improve claims denial management and ensure compliance with complex payer-specific policies. Systems now automate over 90% of routine coding tasks, enabling computer-assisted coding to evolve into a more independent function.
- The goal is to achieve superior revenue cycle management through precise CPT code assignment, HCPCS code generation, and diagnostic related group assignment. This requires a focus on algorithm transparency and continuous monitoring for upcoding detection, which is vital for maintaining trust and ensuring accurate claims data analysis.
- Effective clinical documentation improvement and accurate measurement of patient severity of illness are additional benefits that justify the strategic investment.
What are the Key Data Covered in this AI In Medical Coding Market Research and Growth Report?
-
What is the expected growth of the AI In Medical Coding Market between 2025 and 2029?
-
USD 3.40 billion, at a CAGR of 16%
-
-
What segmentation does the market report cover?
-
The report is segmented by Application (Automated coding, Fraud and error detection, Data analysis, and Others), Technology (Natural language processing, Machine learning, and Robotic process automation), Type (Outsourced, and In-house) and Geography (North America, Europe, APAC, Middle East and Africa, South America)
-
-
Which regions are analyzed in the report?
-
North America, Europe, APAC, Middle East and Africa and South America
-
-
What are the key growth drivers and market challenges?
-
Imperative for enhanced coding accuracy and efficiency, High cost of implementation and integration
-
-
Who are the major players in the AI In Medical Coding Market?
-
3M Co., AGS Health LLC, Aideo Technologies LLC, CodaMetrix, CureMD, Datavant, Dolbey Systems Inc., Fathom Health, FinThrive Inc., GaleAI Inc., GeBBS Healthcare Solutions Inc., HealthOrbit AI, Medicodio Inc., MiMedx Group Inc., Nuance Communications Inc., Nym Health, Optum and XpertDox LLC
-
Market Research Insights
- The market dynamics are defined by a strong push for operational and financial optimization. Organizations leveraging AI for medical billing accuracy through automated clinical coding platforms report significant gains, with some automating over 90% of routine tasks. The focus is on improving coder productivity and reducing claim denials with AI.
- Solutions centered on ai driven coding compliance and ai enhanced audit tools are critical, especially with the use of EHR integrated coding solutions for ai for value-based care. The deployment of ambient ai scribe technology and clinical data extraction tools is key to optimizing coding workflows.
- Decision-makers weigh the ai medical coding roi against the initial cost of ai coding implementation. As providers increasingly use predictive analytics for billing and real time documentation feedback, platforms are being developed for ai coding for specialty clinics to address the persistent medical coder shortage.
- These hipaa compliant ai coding and gdpr in healthcare ai solutions are essential for machine learning for fraud detection and automating revenue cycle with ai via ai powered code review.
We can help! Our analysts can customize this ai in medical coding market research report to meet your requirements.
 RIA -
RIA - 
