AI In Mining Market Analysis, Size, and Forecast 2025-2029: APAC (China, Australia, and India), North America (US, Canada, and Mexico), Europe (Germany, UK, and France), South America (Brazil, Argentina, and Colombia), Middle East and Africa (South Africa, UAE, and Saudi Arabia), and Rest of World (ROW)

AI In Mining Market Analysis, Size, and Forecast 2025-2029:
APAC (China, Australia, and India), North America (US, Canada, and Mexico), Europe (Germany, UK, and France), South America (Brazil, Argentina, and Colombia), Middle East and Africa (South Africa, UAE, and Saudi Arabia), and Rest of World (ROW)

Published: Dec 2025 304 Pages SKU: IRTNTR81082

Market Overview at a Glance

$96.34 B
Market Opportunity
41.4%
CAGR 2024 - 2029
38.8%
APAC Growth
$9.85 B
Cloud-based segment 2023

AI In Mining Market Size 2025-2029

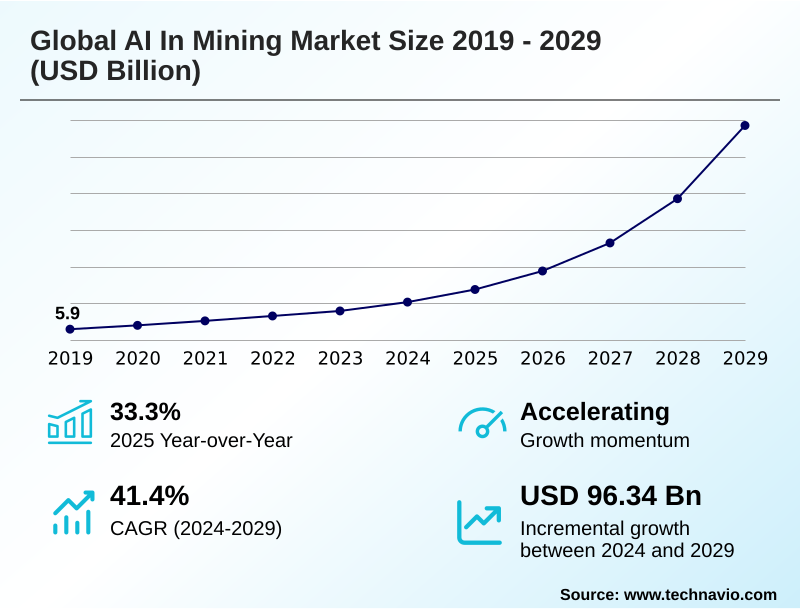
The ai in mining market size is valued to increase by USD 96.34 billion, at a CAGR of 41.4% from 2024 to 2029. Intensifying focus on worker safety and environmental, social and governance (ESG) compliance will drive the ai in mining market.

Major Market Trends & Insights

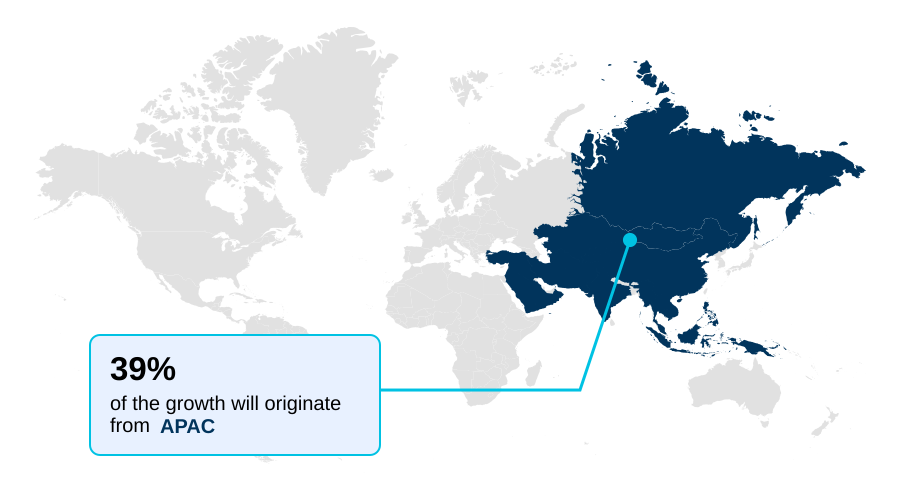
  • APAC dominated the market and accounted for a 38.8% growth during the forecast period.
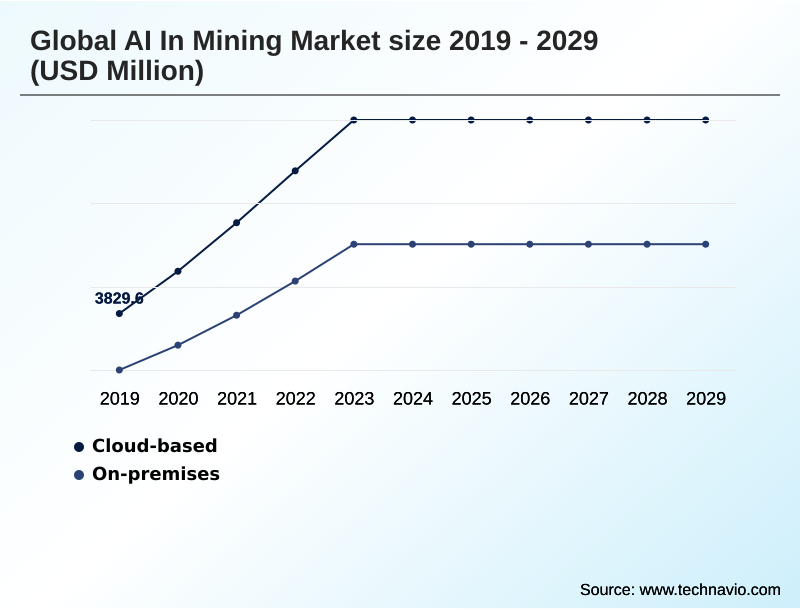
  • By Deployment - Cloud-based segment was valued at USD 9.85 billion in 2023
  • By Type - Surface mining segment accounted for the largest market revenue share in 2023

Market Size & Forecast

  • Market Opportunities: USD 111.11 billion
  • Market Future Opportunities: USD 96.34 billion
  • CAGR from 2024 to 2029 : 41.4%

Market Summary

  • The AI in mining market is undergoing a fundamental transformation, shifting from traditional operational methods to a data-centric model driven by intelligent technologies. This evolution is not merely about technological adoption but a strategic necessity to address persistent pressures for improved productivity, enhanced safety, and greater sustainability. Core applications span the entire mining lifecycle, from exploration to reclamation.
  • For instance, companies are leveraging machine learning to analyze vast geological datasets, increasing the probability of discovering new, economically viable deposits. In operations, the deployment of autonomous haulage systems is becoming more widespread, removing personnel from hazardous environments and optimizing material transport around the clock.
  • A key business scenario involves the use of predictive maintenance, where AI algorithms analyze real-time sensor data from critical machinery, such as haul trucks and crushers. By forecasting potential component failures, operators can move from a reactive to a proactive maintenance schedule, minimizing costly unplanned downtime and extending asset life, thereby directly impacting financial resilience and operational continuity.
  • This shift toward prescriptive management, enabled by AI, is reshaping how mining enterprises create value and maintain their social license to operate.

What will be the Size of the AI In Mining Market during the forecast period?

Get Key Insights on Market Forecast (PDF) Request Free Sample

How is the AI In Mining Market Segmented?

The ai in mining industry research report provides comprehensive data (region-wise segment analysis), with forecasts and estimates in "USD million" for the period 2025-2029, as well as historical data from 2019-2023 for the following segments.

  • Deployment
    • Cloud-based
    • On-premises
  • Type
    • Surface mining
    • Underground mining
  • Technology
    • ML and deep learning
    • Robotics and automation
    • Computer vision
    • NLP
    • Others
  • Geography
    • APAC
      • China
      • Australia
      • India
    • North America
      • US
      • Canada
      • Mexico
    • Europe
      • Germany
      • UK
      • France
    • South America
      • Brazil
      • Argentina
      • Colombia
    • Middle East and Africa
      • South Africa
      • UAE
      • Saudi Arabia
    • Rest of World (ROW)

By Deployment Insights

The cloud-based segment is estimated to witness significant growth during the forecast period.

The cloud deployment model is reshaping the global AI in mining market by offering scalable computational power without significant upfront capital expenditure.

This approach is critical for processing vast datasets essential for advanced applications like AI-powered mineral exploration and comprehensive resource characterization.

Mining companies are leveraging cloud platforms to run complex simulations and train sophisticated models for energy consumption management and intelligent mine ventilation. The flexibility of the cloud enables dynamic adjustments to computational resources, ensuring cost-efficiency.

For instance, using cloud-based platforms for drone-based surveying data analysis has led to a reduction in survey processing times by over 40%.

The model also facilitates collaboration across geographically dispersed teams and supports emerging technologies like generative AI in mining and AI for tailings dam monitoring, enabling subsurface 3D mapping and more accurate predictive analytics.

Request Free Sample

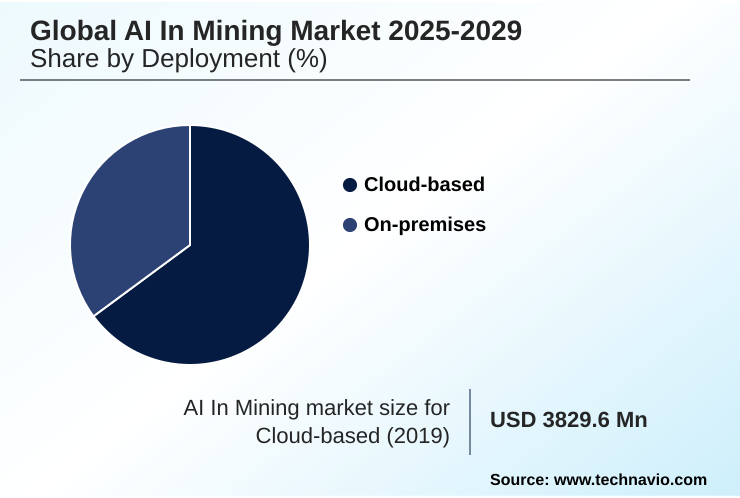
The Cloud-based segment was valued at USD 9.85 billion in 2023 and showed a gradual increase during the forecast period.

Request Free Sample

Regional Analysis

APAC is estimated to contribute 38.8% to the growth of the global market during the forecast period.Technavio’s analysts have elaborately explained the regional trends and drivers that shape the market during the forecast period.

See How AI In Mining Market Demand is Rising in APAC Request Free Sample

The geographic landscape for AI in mining is led by APAC, which is set to contribute nearly 39% of the market's incremental growth, driven by large-scale operations in Australia and modernization mandates in China.

In this region, real-time data analytics is fundamental for managing vast supply chain logistics.

North America follows, with a strong focus on optimizing existing mines in the United States and Canada, where advanced seismic event monitoring systems have reduced false alerts by over 40%.

The use of natural language processing (NLP) to analyze decades of geological reports is also gaining traction, accelerating resource discovery. Europe emphasizes sustainability and deep mining, using AI for blast fragmentation analysis to improve efficiency.

Across all regions, the goal is to achieve real-time operational control and smart mine transformation.

This is supported by predictive analytics deployment for resource management optimization and robotic process automation (RPA) for repetitive tasks, demonstrating a global shift towards integrated, intelligent operations.

Market Dynamics

Our researchers analyzed the data with 2024 as the base year, along with the key drivers, trends, and challenges. A holistic analysis of drivers will help companies refine their marketing strategies to gain a competitive advantage.

  • The adoption of artificial intelligence in mining is advancing beyond pilot projects into core operational strategies, addressing specific, high-value challenges across the value chain. A primary hurdle is the AI integration with legacy mining systems, which requires significant investment in both technology and workforce training to overcome the AI skills gap in mining.
  • In safety, computer vision for PPE compliance tracking is becoming standard, improving worker safety with AI monitoring. Operationally, the focus is on tangible returns, such as using fleet management AI for fuel consumption reduction.
  • Predictive maintenance for haul truck fleets is now a critical application, with some operators reporting a reduction in unexpected failures that is more than double what was achievable with traditional preventative schedules. The application of machine learning for ore grade estimation is refining mine-to-mill efficiency.
  • Operators are using digital twins for mine simulation to test new extraction methods, while autonomous drilling impact on blast outcomes is closely studied to improve downstream processing. Deeper insights are being unlocked through NLP for analyzing geological survey reports and AI-driven exploration for critical raw materials.
  • Robotic systems for underground mine inspection are removing humans from hazardous areas, and AI algorithms for seismic hazard prediction enhance safety in deep mines. Optimizing mineral processing with AI, alongside AI applications in mine water management and optimizing ventilation on demand with AI, showcases AI's role in reducing mining's carbon footprint.
  • The increased connectivity, however, raises cybersecurity challenges in connected mines, while drone technology for stockpile volume calculation and real-time data analytics for operational bottlenecks provide unprecedented visibility.

What are the key market drivers leading to the rise in the adoption of AI In Mining Industry?

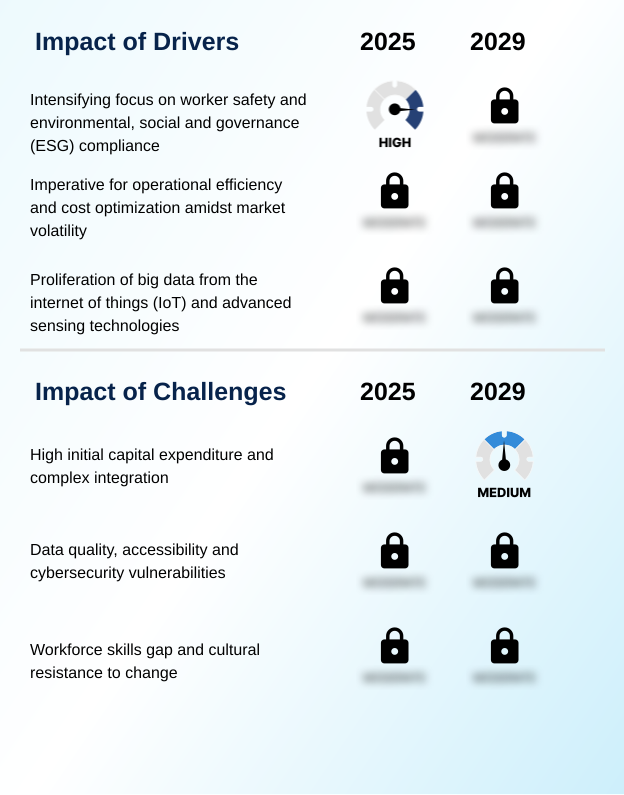
  • An intensifying focus on worker safety and environmental, social, and governance (ESG) compliance is a key driver of market growth.

  • Market growth is primarily driven by the imperative for enhanced safety and productivity.
  • The deployment of autonomous haulage systems and robotic drilling systems directly addresses this by removing personnel from hazardous environments, contributing to a documented 50% reduction in vehicle-related safety incidents at mature sites.
  • Concurrently, the push for environmental footprint minimization is accelerating the adoption of intelligent systems like ventilation on demand, which can lower energy costs by up to 20%.
  • The need for critical mineral discovery acceleration is another major driver, with AI-powered geological modeling and analysis platforms increasing the success rate of exploration campaigns.
  • These technologies contribute to supply chain resilience and personnel safety monitoring, enabling an unplanned downtime reduction and an overall increase in the mineral recovery rate increase across the value chain.

What are the market trends shaping the AI In Mining Industry?

  • The imperative for enhanced operational efficiency and cost reduction is a defining trend. This is driving the adoption of intelligent technologies across the mining value chain.

  • Key trends in the AI in mining market are centered on achieving tangible operational efficiency enhancement and cost reduction strategies. The application of predictive maintenance using sophisticated machine learning models has become a cornerstone, with leading operators reporting up to a 40% decrease in critical equipment failures.
  • This is complemented by the use of computer vision systems for real-time monitoring, which enhances worker safety improvement efforts. The creation of a digital twin for mining operations allows for holistic simulation and optimization, driving asset utilization maximization.
  • Furthermore, advanced ore sorting technology is being deployed to improve mineral recovery, with some systems demonstrating a 10% increase in head grade before processing. These trends collectively support ESG compliance automation by optimizing resource use and minimizing waste, cementing data-driven intelligence as a competitive necessity.

What challenges does the AI In Mining Industry face during its growth?

  • High initial capital expenditure and complex integration with legacy systems represent a key challenge affecting industry growth.

  • Key challenges revolve around integration complexity and data management. The process of legacy system integration can be a significant hurdle, often requiring extensive capital and specialized expertise from workforce upskilling programs. Ensuring robust cybersecurity for OT systems is paramount, as a single breach could halt operations managed from a remote operations center.
  • Effective mine planning optimization and process control optimization depend on high-quality, accessible data, which requires strong data governance frameworks. Even with advanced fleet management systems, achieving true data-driven decision making is difficult when data is siloed. Moreover, accurately predicting events like geotechnical instability prediction requires massive, clean datasets that are difficult to compile.
  • Despite these challenges, the benefits are clear, with successful integrations showing a 15-20% improvement in process efficiency.

Exclusive Technavio Analysis on Customer Landscape

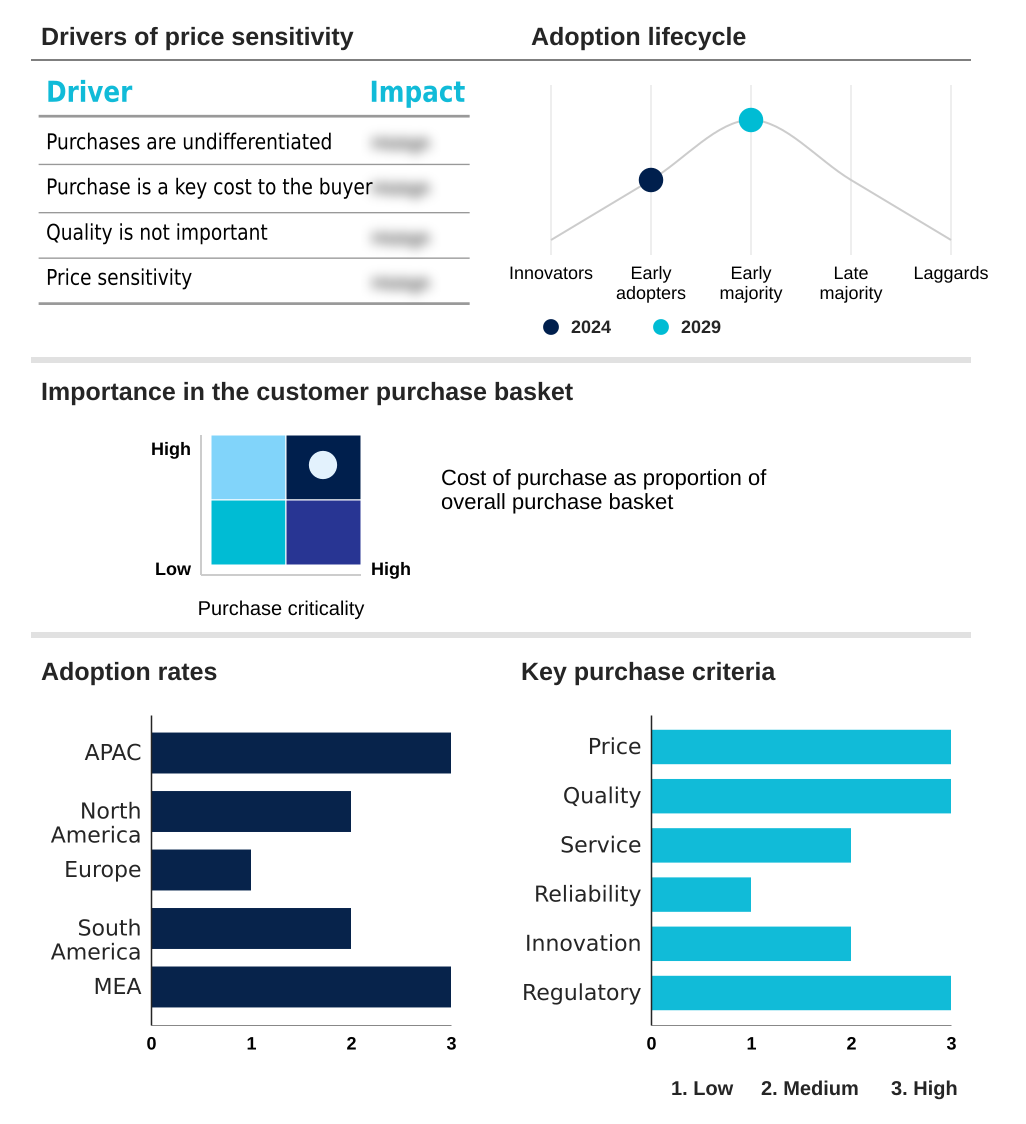
The ai in mining market forecasting report includes the adoption lifecycle of the market, covering from the innovator’s stage to the laggard’s stage. It focuses on adoption rates in different regions based on penetration. Furthermore, the ai in mining market report also includes key purchase criteria and drivers of price sensitivity to help companies evaluate and develop their market growth analysis strategies.

Customer Landscape of AI In Mining Industry

Competitive Landscape

Companies are implementing various strategies, such as strategic alliances, ai in mining market forecast, partnerships, mergers and acquisitions, geographical expansion, and product/service launches, to enhance their presence in the industry.

ABB Ltd. - Delivers industrial IoT solutions, leveraging predictive analytics and process optimization to enhance asset performance and operational intelligence across mining value chains.

The industry research and growth report includes detailed analyses of the competitive landscape of the market and information about key companies, including:

  • ABB Ltd.
  • Anglo American plc
  • Barrick Gold Corp.
  • BHP Group Ltd.
  • Caterpillar Inc.
  • FLSmidth and Co. AS
  • Fortescue Metals Group Ltd.
  • Glencore Plc
  • IBM Corp.
  • KoBold Metals
  • Komatsu Ltd.
  • Microsoft Corp.
  • Newmont Corp.
  • Rio Tinto Ltd.
  • Sandvik AB
  • SAP SE
  • Teck Resources Ltd.
  • The Weir Group Plc

Qualitative and quantitative analysis of companies has been conducted to help clients understand the wider business environment as well as the strengths and weaknesses of key industry players. Data is qualitatively analyzed to categorize companies as pure play, category-focused, industry-focused, and diversified; it is quantitatively analyzed to categorize companies as dominant, leading, strong, tentative, and weak.

Recent Development and News in Ai in mining market

  • In May, 2025, BHP Group Ltd. announced a new AI-driven initiative aimed at achieving a 15% reduction in Scope 1 emissions across its Western Australia Iron Ore operations by integrating autonomous fleet data with renewable energy grid management.
  • In January, 2025, Epiroc announced the commercial rollout of its next-generation battery-electric vehicle fleet, which integrates advanced AI for predictive battery management and automated charging cycles to maximize uptime.
  • In October, 2024, NVIDIA confirmed a strategic collaboration with several industrial software partners to deploy its Omniverse platform, creating physics-based digital twins of mine sites to simulate and optimize operational workflows.
  • In August, 2024, EarthLabs Inc. reported the successful identification of new critical mineral deposits for a client using its proprietary AI exploration platform, validating the technology's ability to accelerate discovery timelines.

Dive into Technavio’s robust research methodology, blending expert interviews, extensive data synthesis, and validated models for unparalleled AI In Mining Market insights. See full methodology.

Market Scope
Page number 304
Base year 2024
Historic period 2019-2023
Forecast period 2025-2029
Growth momentum & CAGR Accelerate at a CAGR of 41.4%
Market growth 2025-2029 USD 96343.5 million
Market structure Fragmented
YoY growth 2024-2025(%) 33.3%
Key countries China, Australia, India, Japan, South Korea, Indonesia, US, Canada, Mexico, Germany, UK, France, Italy, The Netherlands, Spain, Brazil, Argentina, Colombia, South Africa, UAE, Saudi Arabia, Israel and Turkey
Competitive landscape Leading Companies, Market Positioning of Companies, Competitive Strategies, and Industry Risks

Request Free Sample

Research Analyst Overview

  • The AI in mining market is defined by a strategic pivot toward data-centric operations, where machine learning models and real-time data analytics are foundational. The deployment of autonomous haulage systems and robotic drilling systems is transitioning from niche applications to standard practice in large-scale operations, driven by the need to enhance safety and productivity.
  • A critical focus area is predictive maintenance, which leverages sensor data to anticipate equipment failures, with some implementations achieving a 30% reduction in unplanned downtime for critical assets. The creation of a comprehensive digital twin of a mine allows for advanced mine planning optimization and geological modeling.
  • This is complemented by technologies like computer vision for personnel safety monitoring and ore sorting technology for process control optimization. In underground environments, ventilation on demand systems managed by AI are improving safety and energy consumption management.
  • The entire operation is often managed from a remote operations center, coordinating everything from fleet management systems and supply chain logistics to resource characterization. Advanced techniques like blast fragmentation analysis, seismic event monitoring, and drone-based surveying are being refined by AI, while natural language processing (NLP) unlocks insights from unstructured data, supporting AI-powered mineral exploration.

What are the Key Data Covered in this AI In Mining Market Research and Growth Report?

  • What is the expected growth of the AI In Mining Market between 2025 and 2029?

    • USD 96.34 billion, at a CAGR of 41.4%

  • What segmentation does the market report cover?

    • The report is segmented by Deployment (Cloud-based, and On-premises), Type (Surface mining, and Underground mining), Technology (ML and deep learning, Robotics and automation, Computer vision, NLP, and Others) and Geography (APAC, North America, Europe, South America, Middle East and Africa)

  • Which regions are analyzed in the report?

    • APAC, North America, Europe, South America and Middle East and Africa

  • What are the key growth drivers and market challenges?

    • Intensifying focus on worker safety and environmental, social and governance (ESG) compliance, High initial capital expenditure and complex integration

  • Who are the major players in the AI In Mining Market?

    • ABB Ltd., Anglo American plc, Barrick Gold Corp., BHP Group Ltd., Caterpillar Inc., FLSmidth and Co. AS, Fortescue Metals Group Ltd., Glencore Plc, IBM Corp., KoBold Metals, Komatsu Ltd., Microsoft Corp., Newmont Corp., Rio Tinto Ltd., Sandvik AB, SAP SE, Teck Resources Ltd. and The Weir Group Plc

Market Research Insights

  • The AI in mining market is driven by a clear business case for operational efficiency enhancement and cost reduction strategies. Deployments focusing on asset utilization maximization through predictive analytics deployment have demonstrated an ability to achieve unplanned downtime reduction by over 25%.
  • Concurrently, pressures for worker safety improvement and ESG compliance automation are fueling smart mine transformation projects, which include AI for tailings dam monitoring and intelligent mine ventilation. While legacy system integration and the need for robust data governance frameworks and workforce upskilling programs present challenges, the move toward data-driven decision making is irreversible.
  • Firms that successfully implement real-time operational control report a mineral recovery rate increase of up to 15%. This trend is further supported by the need for critical mineral discovery acceleration, leveraging subsurface 3D mapping and generative AI in mining to strengthen supply chain resilience and environmental footprint minimization.
  • Managing cybersecurity for OT systems remains a critical component of this evolution toward complete resource management optimization and robotic process automation (RPA).

We can help! Our analysts can customize this ai in mining market research report to meet your requirements.

Get in touch

1. Executive Summary

1.1 Market overview

Executive Summary - Chart on Market Overview
Executive Summary - Data Table on Market Overview
Executive Summary - Chart on Global Market Characteristics
Executive Summary - Chart on Market by Geography
Executive Summary - Chart on Market Segmentation by Deployment
Executive Summary - Chart on Market Segmentation by Type
Executive Summary - Chart on Market Segmentation by Technology
Executive Summary - Chart on Incremental Growth
Executive Summary - Data Table on Incremental Growth
Executive Summary - Chart on Company Market Positioning

2. Technavio Analysis

2.1 Analysis of price sensitivity, lifecycle, customer purchase basket, adoption rates, and purchase criteria

2.2 Criticality of inputs and Factors of differentiation

Chart on Overview on criticality of inputs and factors of differentiation

2.3 Factors of disruption

Chart on Overview on factors of disruption

2.4 Impact of drivers and challenges

Chart on Impact of drivers and challenges in 2024 and 2029

3. Market Landscape

3.1 Market ecosystem

Chart on Parent Market
Data Table on - Parent Market

3.2 Market characteristics

Chart on Market characteristics analysis

3.3 Value chain analysis

Chart on Value chain analysis

4. Market Sizing

4.1 Market definition

Data Table on Offerings of companies included in the market definition

4.2 Market segment analysis

Market segments

4.3 Market size 2024

4.4 Market outlook: Forecast for 2024-2029

Chart on Global - Market size and forecast 2024-2029 ($ million)
Data Table on Global - Market size and forecast 2024-2029 ($ million)
Chart on Global Market: Year-over-year growth 2024-2029 (%)
Data Table on Global Market: Year-over-year growth 2024-2029 (%)

5. Historic Market Size

5.1 Global AI In Mining Market 2019 - 2023

Historic Market Size - Data Table on Global AI In Mining Market 2019 - 2023 ($ million)

5.2 Deployment segment analysis 2019 - 2023

Historic Market Size - Deployment Segment 2019 - 2023 ($ million)

5.3 Type segment analysis 2019 - 2023

Historic Market Size - Type Segment 2019 - 2023 ($ million)

5.4 Technology segment analysis 2019 - 2023

Historic Market Size - Technology Segment 2019 - 2023 ($ million)

5.5 Geography segment analysis 2019 - 2023

Historic Market Size - Geography Segment 2019 - 2023 ($ million)

5.6 Country segment analysis 2019 - 2023

Historic Market Size - Country Segment 2019 - 2023 ($ million)

6. Five Forces Analysis

6.1 Five forces summary

Five forces analysis - Comparison between 2024 and 2029

6.2 Bargaining power of buyers

Bargaining power of buyers - Impact of key factors 2024 and 2029

6.3 Bargaining power of suppliers

Bargaining power of suppliers - Impact of key factors in 2024 and 2029

6.4 Threat of new entrants

Threat of new entrants - Impact of key factors in 2024 and 2029

6.5 Threat of substitutes

Threat of substitutes - Impact of key factors in 2024 and 2029

6.6 Threat of rivalry

Threat of rivalry - Impact of key factors in 2024 and 2029

6.7 Market condition

Chart on Market condition - Five forces 2024 and 2029

7. Market Segmentation by Deployment

7.1 Market segments

Chart on Deployment - Market share 2024-2029 (%)
Data Table on Deployment - Market share 2024-2029 (%)

7.2 Comparison by Deployment

Chart on Comparison by Deployment
Data Table on Comparison by Deployment

7.3 Cloud-based - Market size and forecast 2024-2029

Chart on Cloud-based - Market size and forecast 2024-2029 ($ million)
Data Table on Cloud-based - Market size and forecast 2024-2029 ($ million)
Chart on Cloud-based - Year-over-year growth 2024-2029 (%)
Data Table on Cloud-based - Year-over-year growth 2024-2029 (%)

7.4 On-premises - Market size and forecast 2024-2029

Chart on On-premises - Market size and forecast 2024-2029 ($ million)
Data Table on On-premises - Market size and forecast 2024-2029 ($ million)
Chart on On-premises - Year-over-year growth 2024-2029 (%)
Data Table on On-premises - Year-over-year growth 2024-2029 (%)

7.5 Market opportunity by Deployment

Market opportunity by Deployment ($ million)
Data Table on Market opportunity by Deployment ($ million)

8. Market Segmentation by Type

8.1 Market segments

Chart on Type - Market share 2024-2029 (%)
Data Table on Type - Market share 2024-2029 (%)

8.2 Comparison by Type

Chart on Comparison by Type
Data Table on Comparison by Type

8.3 Surface mining - Market size and forecast 2024-2029

Chart on Surface mining - Market size and forecast 2024-2029 ($ million)
Data Table on Surface mining - Market size and forecast 2024-2029 ($ million)
Chart on Surface mining - Year-over-year growth 2024-2029 (%)
Data Table on Surface mining - Year-over-year growth 2024-2029 (%)

8.4 Underground mining - Market size and forecast 2024-2029

Chart on Underground mining - Market size and forecast 2024-2029 ($ million)
Data Table on Underground mining - Market size and forecast 2024-2029 ($ million)
Chart on Underground mining - Year-over-year growth 2024-2029 (%)
Data Table on Underground mining - Year-over-year growth 2024-2029 (%)

8.5 Market opportunity by Type

Market opportunity by Type ($ million)
Data Table on Market opportunity by Type ($ million)

9. Market Segmentation by Technology

9.1 Market segments

Chart on Technology - Market share 2024-2029 (%)
Data Table on Technology - Market share 2024-2029 (%)

9.2 Comparison by Technology

Chart on Comparison by Technology
Data Table on Comparison by Technology

9.3 ML and deep learning - Market size and forecast 2024-2029

Chart on ML and deep learning - Market size and forecast 2024-2029 ($ million)
Data Table on ML and deep learning - Market size and forecast 2024-2029 ($ million)
Chart on ML and deep learning - Year-over-year growth 2024-2029 (%)
Data Table on ML and deep learning - Year-over-year growth 2024-2029 (%)

9.4 Robotics and automation - Market size and forecast 2024-2029

Chart on Robotics and automation - Market size and forecast 2024-2029 ($ million)
Data Table on Robotics and automation - Market size and forecast 2024-2029 ($ million)
Chart on Robotics and automation - Year-over-year growth 2024-2029 (%)
Data Table on Robotics and automation - Year-over-year growth 2024-2029 (%)

9.5 Computer vision - Market size and forecast 2024-2029

Chart on Computer vision - Market size and forecast 2024-2029 ($ million)
Data Table on Computer vision - Market size and forecast 2024-2029 ($ million)
Chart on Computer vision - Year-over-year growth 2024-2029 (%)
Data Table on Computer vision - Year-over-year growth 2024-2029 (%)

9.6 NLP - Market size and forecast 2024-2029

Chart on NLP - Market size and forecast 2024-2029 ($ million)
Data Table on NLP - Market size and forecast 2024-2029 ($ million)
Chart on NLP - Year-over-year growth 2024-2029 (%)
Data Table on NLP - Year-over-year growth 2024-2029 (%)

9.7 Others - Market size and forecast 2024-2029

Chart on Others - Market size and forecast 2024-2029 ($ million)
Data Table on Others - Market size and forecast 2024-2029 ($ million)
Chart on Others - Year-over-year growth 2024-2029 (%)
Data Table on Others - Year-over-year growth 2024-2029 (%)

9.8 Market opportunity by Technology

Market opportunity by Technology ($ million)
Data Table on Market opportunity by Technology ($ million)

10. Customer Landscape

10.1 Customer landscape overview

Analysis of price sensitivity, lifecycle, customer purchase basket, adoption rates, and purchase criteria

11. Geographic Landscape

11.1 Geographic segmentation

Chart on Market share by geography 2024-2029 (%)
Data Table on Market share by geography 2024-2029 (%)

11.2 Geographic comparison

Chart on Geographic comparison
Data Table on Geographic comparison

11.3 APAC - Market size and forecast 2024-2029

Chart on APAC - Market size and forecast 2024-2029 ($ million)
Data Table on APAC - Market size and forecast 2024-2029 ($ million)
Chart on APAC - Year-over-year growth 2024-2029 (%)
Data Table on APAC - Year-over-year growth 2024-2029 (%)
Chart on Regional Comparison - APAC
Data Table on Regional Comparison - APAC

11.3.1 China - Market size and forecast 2024-2029

Chart on China - Market size and forecast 2024-2029 ($ million)
Data Table on China - Market size and forecast 2024-2029 ($ million)
Chart on China - Year-over-year growth 2024-2029 (%)
Data Table on China - Year-over-year growth 2024-2029 (%)

11.3.2 Australia - Market size and forecast 2024-2029

Chart on Australia - Market size and forecast 2024-2029 ($ million)
Data Table on Australia - Market size and forecast 2024-2029 ($ million)
Chart on Australia - Year-over-year growth 2024-2029 (%)
Data Table on Australia - Year-over-year growth 2024-2029 (%)

11.3.3 India - Market size and forecast 2024-2029

Chart on India - Market size and forecast 2024-2029 ($ million)
Data Table on India - Market size and forecast 2024-2029 ($ million)
Chart on India - Year-over-year growth 2024-2029 (%)
Data Table on India - Year-over-year growth 2024-2029 (%)

11.3.4 Japan - Market size and forecast 2024-2029

Chart on Japan - Market size and forecast 2024-2029 ($ million)
Data Table on Japan - Market size and forecast 2024-2029 ($ million)
Chart on Japan - Year-over-year growth 2024-2029 (%)
Data Table on Japan - Year-over-year growth 2024-2029 (%)

11.3.5 South Korea - Market size and forecast 2024-2029

Chart on South Korea - Market size and forecast 2024-2029 ($ million)
Data Table on South Korea - Market size and forecast 2024-2029 ($ million)
Chart on South Korea - Year-over-year growth 2024-2029 (%)
Data Table on South Korea - Year-over-year growth 2024-2029 (%)

11.3.6 Indonesia - Market size and forecast 2024-2029

Chart on Indonesia - Market size and forecast 2024-2029 ($ million)
Data Table on Indonesia - Market size and forecast 2024-2029 ($ million)
Chart on Indonesia - Year-over-year growth 2024-2029 (%)
Data Table on Indonesia - Year-over-year growth 2024-2029 (%)

11.4 North America - Market size and forecast 2024-2029

Chart on North America - Market size and forecast 2024-2029 ($ million)
Data Table on North America - Market size and forecast 2024-2029 ($ million)
Chart on North America - Year-over-year growth 2024-2029 (%)
Data Table on North America - Year-over-year growth 2024-2029 (%)
Chart on Regional Comparison - North America
Data Table on Regional Comparison - North America

11.4.1 US - Market size and forecast 2024-2029

Chart on US - Market size and forecast 2024-2029 ($ million)
Data Table on US - Market size and forecast 2024-2029 ($ million)
Chart on US - Year-over-year growth 2024-2029 (%)
Data Table on US - Year-over-year growth 2024-2029 (%)

11.4.2 Canada - Market size and forecast 2024-2029

Chart on Canada - Market size and forecast 2024-2029 ($ million)
Data Table on Canada - Market size and forecast 2024-2029 ($ million)
Chart on Canada - Year-over-year growth 2024-2029 (%)
Data Table on Canada - Year-over-year growth 2024-2029 (%)

11.4.3 Mexico - Market size and forecast 2024-2029

Chart on Mexico - Market size and forecast 2024-2029 ($ million)
Data Table on Mexico - Market size and forecast 2024-2029 ($ million)
Chart on Mexico - Year-over-year growth 2024-2029 (%)
Data Table on Mexico - Year-over-year growth 2024-2029 (%)

11.5 Europe - Market size and forecast 2024-2029

Chart on Europe - Market size and forecast 2024-2029 ($ million)
Data Table on Europe - Market size and forecast 2024-2029 ($ million)
Chart on Europe - Year-over-year growth 2024-2029 (%)
Data Table on Europe - Year-over-year growth 2024-2029 (%)
Chart on Regional Comparison - Europe
Data Table on Regional Comparison - Europe

11.5.1 Germany - Market size and forecast 2024-2029

Chart on Germany - Market size and forecast 2024-2029 ($ million)
Data Table on Germany - Market size and forecast 2024-2029 ($ million)
Chart on Germany - Year-over-year growth 2024-2029 (%)
Data Table on Germany - Year-over-year growth 2024-2029 (%)

11.5.2 UK - Market size and forecast 2024-2029

Chart on UK - Market size and forecast 2024-2029 ($ million)
Data Table on UK - Market size and forecast 2024-2029 ($ million)
Chart on UK - Year-over-year growth 2024-2029 (%)
Data Table on UK - Year-over-year growth 2024-2029 (%)

11.5.3 France - Market size and forecast 2024-2029

Chart on France - Market size and forecast 2024-2029 ($ million)
Data Table on France - Market size and forecast 2024-2029 ($ million)
Chart on France - Year-over-year growth 2024-2029 (%)
Data Table on France - Year-over-year growth 2024-2029 (%)

11.5.4 Italy - Market size and forecast 2024-2029

Chart on Italy - Market size and forecast 2024-2029 ($ million)
Data Table on Italy - Market size and forecast 2024-2029 ($ million)
Chart on Italy - Year-over-year growth 2024-2029 (%)
Data Table on Italy - Year-over-year growth 2024-2029 (%)

11.5.5 The Netherlands - Market size and forecast 2024-2029

Chart on The Netherlands - Market size and forecast 2024-2029 ($ million)
Data Table on The Netherlands - Market size and forecast 2024-2029 ($ million)
Chart on The Netherlands - Year-over-year growth 2024-2029 (%)
Data Table on The Netherlands - Year-over-year growth 2024-2029 (%)

11.5.6 Spain - Market size and forecast 2024-2029

Chart on Spain - Market size and forecast 2024-2029 ($ million)
Data Table on Spain - Market size and forecast 2024-2029 ($ million)
Chart on Spain - Year-over-year growth 2024-2029 (%)
Data Table on Spain - Year-over-year growth 2024-2029 (%)

11.6 South America - Market size and forecast 2024-2029

Chart on South America - Market size and forecast 2024-2029 ($ million)
Data Table on South America - Market size and forecast 2024-2029 ($ million)
Chart on South America - Year-over-year growth 2024-2029 (%)
Data Table on South America - Year-over-year growth 2024-2029 (%)
Chart on Regional Comparison - South America
Data Table on Regional Comparison - South America

11.6.1 Brazil - Market size and forecast 2024-2029

Chart on Brazil - Market size and forecast 2024-2029 ($ million)
Data Table on Brazil - Market size and forecast 2024-2029 ($ million)
Chart on Brazil - Year-over-year growth 2024-2029 (%)
Data Table on Brazil - Year-over-year growth 2024-2029 (%)

11.6.2 Argentina - Market size and forecast 2024-2029

Chart on Argentina - Market size and forecast 2024-2029 ($ million)
Data Table on Argentina - Market size and forecast 2024-2029 ($ million)
Chart on Argentina - Year-over-year growth 2024-2029 (%)
Data Table on Argentina - Year-over-year growth 2024-2029 (%)

11.6.3 Colombia - Market size and forecast 2024-2029

Chart on Colombia - Market size and forecast 2024-2029 ($ million)
Data Table on Colombia - Market size and forecast 2024-2029 ($ million)
Chart on Colombia - Year-over-year growth 2024-2029 (%)
Data Table on Colombia - Year-over-year growth 2024-2029 (%)

11.7 Middle East and Africa - Market size and forecast 2024-2029

Chart on Middle East and Africa - Market size and forecast 2024-2029 ($ million)
Data Table on Middle East and Africa - Market size and forecast 2024-2029 ($ million)
Chart on Middle East and Africa - Year-over-year growth 2024-2029 (%)
Data Table on Middle East and Africa - Year-over-year growth 2024-2029 (%)
Chart on Regional Comparison - Middle East and Africa
Data Table on Regional Comparison - Middle East and Africa

11.7.1 South Africa - Market size and forecast 2024-2029

Chart on South Africa - Market size and forecast 2024-2029 ($ million)
Data Table on South Africa - Market size and forecast 2024-2029 ($ million)
Chart on South Africa - Year-over-year growth 2024-2029 (%)
Data Table on South Africa - Year-over-year growth 2024-2029 (%)

11.7.2 UAE - Market size and forecast 2024-2029

Chart on UAE - Market size and forecast 2024-2029 ($ million)
Data Table on UAE - Market size and forecast 2024-2029 ($ million)
Chart on UAE - Year-over-year growth 2024-2029 (%)
Data Table on UAE - Year-over-year growth 2024-2029 (%)

11.7.3 Saudi Arabia - Market size and forecast 2024-2029

Chart on Saudi Arabia - Market size and forecast 2024-2029 ($ million)
Data Table on Saudi Arabia - Market size and forecast 2024-2029 ($ million)
Chart on Saudi Arabia - Year-over-year growth 2024-2029 (%)
Data Table on Saudi Arabia - Year-over-year growth 2024-2029 (%)

11.7.4 Israel - Market size and forecast 2024-2029

Chart on Israel - Market size and forecast 2024-2029 ($ million)
Data Table on Israel - Market size and forecast 2024-2029 ($ million)
Chart on Israel - Year-over-year growth 2024-2029 (%)
Data Table on Israel - Year-over-year growth 2024-2029 (%)

11.7.5 Turkey - Market size and forecast 2024-2029

Chart on Turkey - Market size and forecast 2024-2029 ($ million)
Data Table on Turkey - Market size and forecast 2024-2029 ($ million)
Chart on Turkey - Year-over-year growth 2024-2029 (%)
Data Table on Turkey - Year-over-year growth 2024-2029 (%)

11.8 Market opportunity by geography

Market opportunity by geography ($ million)
Data Tables on Market opportunity by geography ($ million)

12. Drivers, Challenges, and Opportunity

12.1 Market drivers

Intensifying focus on worker safety and environmental, social and governance (ESG) compliance
Imperative for operational efficiency and cost optimization amidst market volatility
Proliferation of big data from the internet of things (IoT) and advanced sensing technologies

12.2 Market challenges

High initial capital expenditure and complex integration
Data quality, accessibility and cybersecurity vulnerabilities
Workforce skills gap and cultural resistance to change

12.3 Impact of drivers and challenges

Impact of drivers and challenges in 2024 and 2029

12.4 Market opportunities

Imperative for enhanced operational efficiency and cost reduction
Heightened emphasis on worker safety and environmental, social, and governance (ESG) mandates
Accelerated mineral exploration to meet critical raw material demand

13. Competitive Landscape

13.1 Overview

13.2

Overview on criticality of inputs and factors of differentiation

13.3 Landscape disruption

Overview on factors of disruption

13.4 Industry risks

Impact of key risks on business

14. Competitive Analysis

14.1 Companies profiled

Companies covered

14.2 Company ranking index

14.3 Market positioning of companies

Matrix on companies position and classification

14.4 ABB Ltd.

ABB Ltd. - Overview
ABB Ltd. - Business segments
ABB Ltd. - Key news
ABB Ltd. - Key offerings
ABB Ltd. - Segment focus
SWOT

14.5 Anglo American plc

Anglo American plc - Overview
Anglo American plc - Business segments
Anglo American plc - Key news
Anglo American plc - Key offerings
Anglo American plc - Segment focus
SWOT

14.6 Barrick Gold Corp.

Barrick Gold Corp. - Overview
Barrick Gold Corp. - Product / Service
Barrick Gold Corp. - Key offerings
SWOT

14.7 BHP Group Ltd.

BHP Group Ltd. - Overview
BHP Group Ltd. - Business segments
BHP Group Ltd. - Key offerings
BHP Group Ltd. - Segment focus
SWOT

14.8 Caterpillar Inc.

Caterpillar Inc. - Overview
Caterpillar Inc. - Business segments
Caterpillar Inc. - Key news
Caterpillar Inc. - Key offerings
Caterpillar Inc. - Segment focus
SWOT

14.9 Fortescue Metals Group Ltd.

Fortescue Metals Group Ltd. - Overview
Fortescue Metals Group Ltd. - Product / Service
Fortescue Metals Group Ltd. - Key offerings
SWOT

14.10 Glencore Plc

Glencore Plc - Overview
Glencore Plc - Business segments
Glencore Plc - Key news
Glencore Plc - Key offerings
Glencore Plc - Segment focus
SWOT

14.11 IBM Corp.

IBM Corp. - Overview
IBM Corp. - Business segments
IBM Corp. - Key news
IBM Corp. - Key offerings
IBM Corp. - Segment focus
SWOT

14.12 Komatsu Ltd.

Komatsu Ltd. - Overview
Komatsu Ltd. - Business segments
Komatsu Ltd. - Key news
Komatsu Ltd. - Key offerings
Komatsu Ltd. - Segment focus
SWOT

14.13 Microsoft Corp.

Microsoft Corp. - Overview
Microsoft Corp. - Business segments
Microsoft Corp. - Key news
Microsoft Corp. - Key offerings
Microsoft Corp. - Segment focus
SWOT

14.14 Newmont Corp.

Newmont Corp. - Overview
Newmont Corp. - Business segments
Newmont Corp. - Key offerings
Newmont Corp. - Segment focus
SWOT

14.15 Rio Tinto Ltd.

Rio Tinto Ltd. - Overview
Rio Tinto Ltd. - Business segments
Rio Tinto Ltd. - Key news
Rio Tinto Ltd. - Key offerings
Rio Tinto Ltd. - Segment focus
SWOT

14.16 Sandvik AB

Sandvik AB - Overview
Sandvik AB - Business segments
Sandvik AB - Key news
Sandvik AB - Key offerings
Sandvik AB - Segment focus
SWOT

14.17 SAP SE

SAP SE - Overview
SAP SE - Business segments
SAP SE - Key news
SAP SE - Key offerings
SAP SE - Segment focus
SWOT

14.18 Teck Resources Ltd.

Teck Resources Ltd. - Overview
Teck Resources Ltd. - Business segments
Teck Resources Ltd. - Key offerings
Teck Resources Ltd. - Segment focus
SWOT

15. Appendix

15.1 Scope of the report

Market definition
Objectives
Notes and caveats

15.2 Inclusions and exclusions checklist

Inclusions checklist
Exclusions checklist

15.3 Currency conversion rates for US$

15.4 Research methodology

15.5 Data procurement

Information sources

15.6 Data validation

15.7 Validation techniques employed for market sizing

15.8 Data synthesis

15.9 360 degree market analysis

15.10 List of abbreviations

Research Methodology

Technavio presents a detailed picture of the market by way of study, synthesis, and summation of data from multiple sources. The analysts have presented the various facets of the market with a particular focus on identifying the key industry influencers. The data thus presented is comprehensive, reliable, and the result of extensive research, both primary and secondary.

INFORMATION SOURCES

Primary sources

  • Manufacturers and suppliers
  • Channel partners
  • Industry experts
  • Strategic decision makers

Secondary sources

  • Industry journals and periodicals
  • Government data
  • Financial reports of key industry players
  • Historical data
  • Press releases

DATA ANALYSIS

Data Synthesis

  • Collation of data
  • Estimation of key figures
  • Analysis of derived insights

Data Validation

  • Triangulation with data models
  • Reference against proprietary databases
  • Corroboration with industry experts

REPORT WRITING

Qualitative

  • Market drivers
  • Market challenges
  • Market trends
  • Five forces analysis

Quantitative

  • Market size and forecast
  • Market segmentation
  • Geographical insights
  • Competitive landscape

Interested in this report?

Get your sample now to see our research methodology and insights!

Download Now

Frequently Asked Questions

AI In Mining market growth will increase by USD 96343.5 million during 2025-2029.

The AI In Mining market is expected to grow at a CAGR of 41.4% during 2025-2029.

AI In Mining market is segmented by Deployment (Cloud-based, On-premises) Type (Surface mining, Underground mining) Technology (ML and deep learning, Robotics and automation, Computer vision, NLP, Others)

ABB Ltd., Anglo American plc, Barrick Gold Corp., BHP Group Ltd., Caterpillar Inc., FLSmidth and Co. AS, Fortescue Metals Group Ltd., Glencore Plc, IBM Corp., KoBold Metals, Komatsu Ltd., Microsoft Corp., Newmont Corp., Rio Tinto Ltd., Sandvik AB, SAP SE, Teck Resources Ltd., The Weir Group Plc are a few of the key vendors in the AI In Mining market.

APAC will register the highest growth rate of 38.8% among the other regions. Therefore, the AI In Mining market in APAC is expected to garner significant business opportunities for the vendors during the forecast period.

China, Australia, India, Japan, South Korea, Indonesia, US, Canada, Mexico, Germany, UK, France, Italy, The Netherlands, Spain, Brazil, Argentina, Colombia, South Africa, UAE, Saudi Arabia, Israel, Turkey

  • Intensifying focus on worker safety and environmental, social and governance (ESG) compliance is the driving factor this market.

The AI In Mining market vendors should focus on grabbing business opportunities from the Deployment segment as it accounted for the largest market share in the base year.