AI In Operating Room Market Size 2025-2029
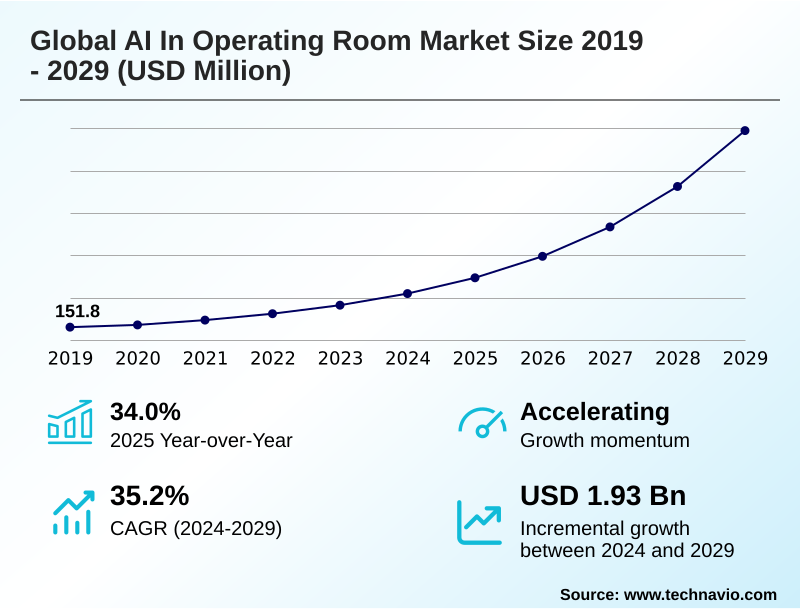
The ai in operating room market size is valued to increase by USD 1.93 billion, at a CAGR of 35.2% from 2024 to 2029. Technological advancements in AI platforms and surgical robotics will drive the ai in operating room market.
Major Market Trends & Insights
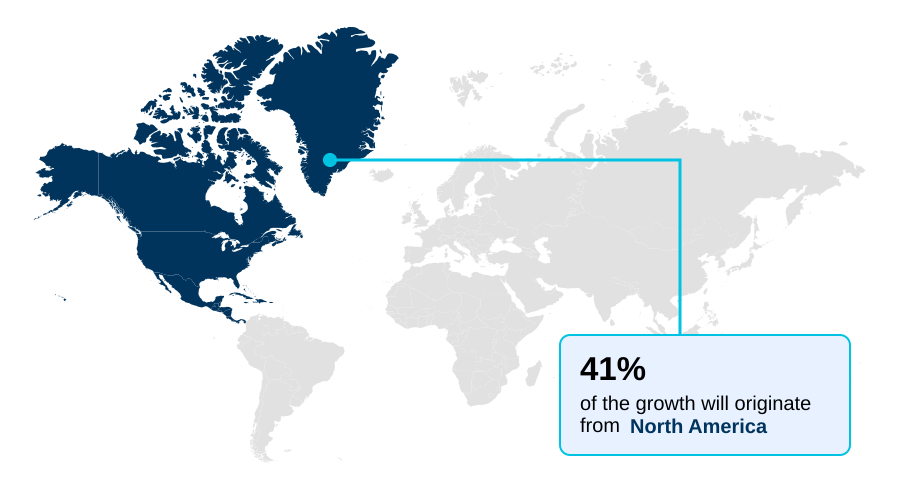
- North America dominated the market and accounted for a 41.4% growth during the forecast period.
- By Component - Hardware segment was valued at USD 240.9 million in 2023
- By Technology - Deep learning segment accounted for the largest market revenue share in 2023
Market Size & Forecast
- Market Opportunities: USD 2.32 billion
- Market Future Opportunities: USD 1.93 billion
- CAGR from 2024 to 2029 : 35.2%
Market Summary
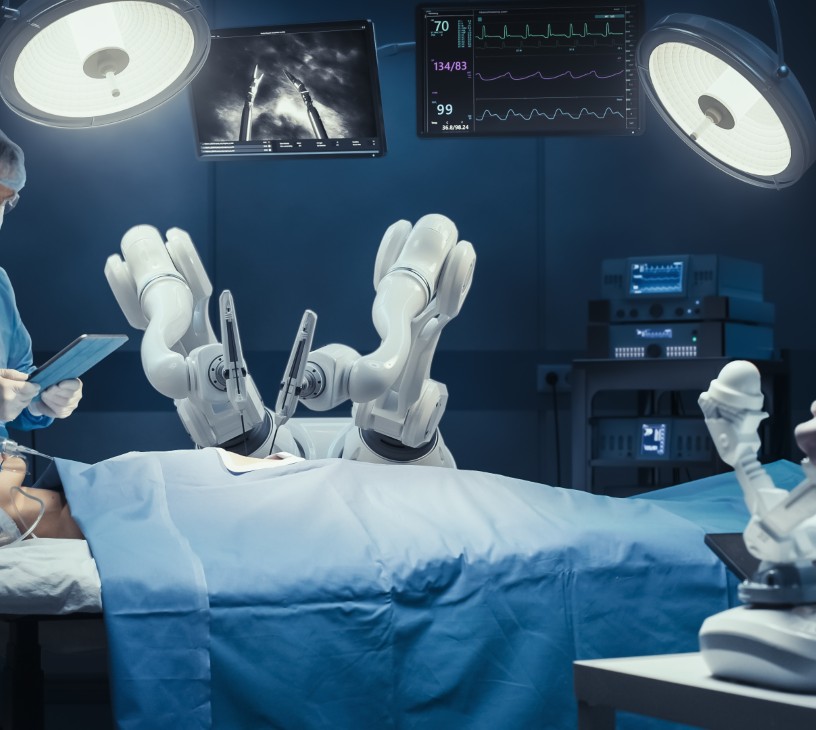
- The AI In Operating Room market is transforming surgical care by integrating advanced technologies to improve precision, efficiency, and patient outcomes. Core technologies such as machine learning algorithms, deep learning in surgery, and computer vision for surgery are at the heart of this evolution, enabling a new generation of AI-enhanced surgical tools and platforms.
- These systems facilitate comprehensive preoperative surgical planning through detailed patient-specific 3d modeling and offer real-time decision support during procedures. A key application is surgical workflow optimization, where AI analyzes data to streamline scheduling and resource allocation, significantly reducing delays and operational costs.
- For instance, a hospital can use predictive modeling for outcomes to optimize its OR turnover times, ensuring better utilization of critical resources. Post-surgery, postoperative data analysis and procedural video analysis are used for continuous quality improvement and surgical skill assessment.
- While adoption is driven by the clear benefits of data-driven surgical care, challenges related to implementation costs and data security must be addressed for broader market penetration.
What will be the Size of the AI In Operating Room Market during the forecast period?
Get Key Insights on Market Forecast (PDF) Get Free Sample
How is the AI In Operating Room Market Segmented?
The ai in operating room industry research report provides comprehensive data (region-wise segment analysis), with forecasts and estimates in "USD million" for the period 2025-2029, as well as historical data from 2019-2023 for the following segments.
- Component
- Hardware
- Software
- Technology
- Deep learning
- Machine learning
- Natural language processing
- Others
- Application
- Urology
- Gastroenterology
- Neurology
- Cardiology
- Orthopedics
- Geography
- North America
- US
- Canada
- Mexico
- Europe
- Germany
- UK
- France
- APAC
- China
- Japan
- India
- South America
- Brazil
- Argentina
- Colombia
- Middle East and Africa
- Saudi Arabia
- UAE
- South Africa
- Rest of World (ROW)
- North America
By Component Insights
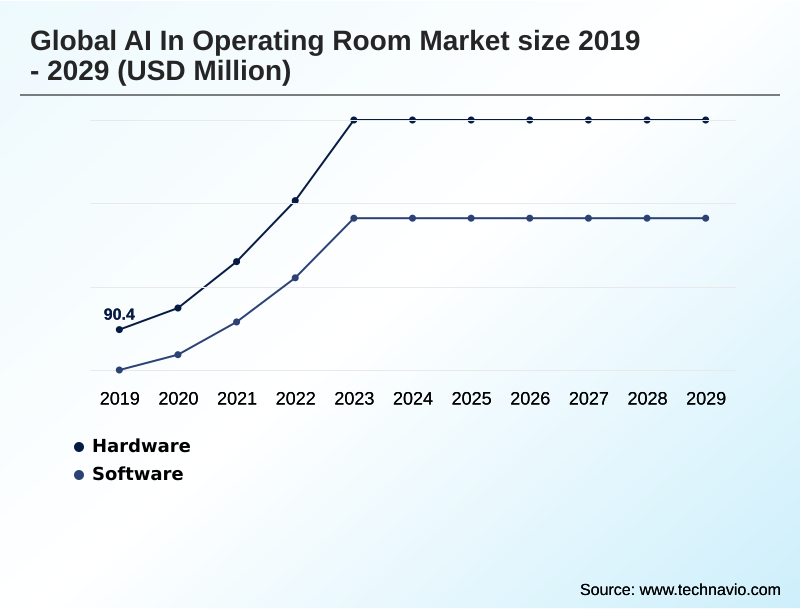
The hardware segment is estimated to witness significant growth during the forecast period.
The hardware segment is characterized by the deep integration of AI into surgical robotics platforms and smart surgical instruments.
This progression creates intelligent devices that augment a surgeon’s capabilities, leading to enhanced precision, which has improved implant placement accuracy by over 15% in certain procedures.
Key components include advanced robotic systems and ai-enhanced endoscopy tools embedded with sensors for real-time tissue analysis. A critical area of innovation is augmented reality surgical navigation systems, which overlay patient-specific 3d modeling onto the surgeon's field of view.
These digital surgery ecosystems, driven by deep learning in surgery and powerful processors, are enabling more precise minimally invasive procedures and better patient outcomes through ambient clinical intelligence.
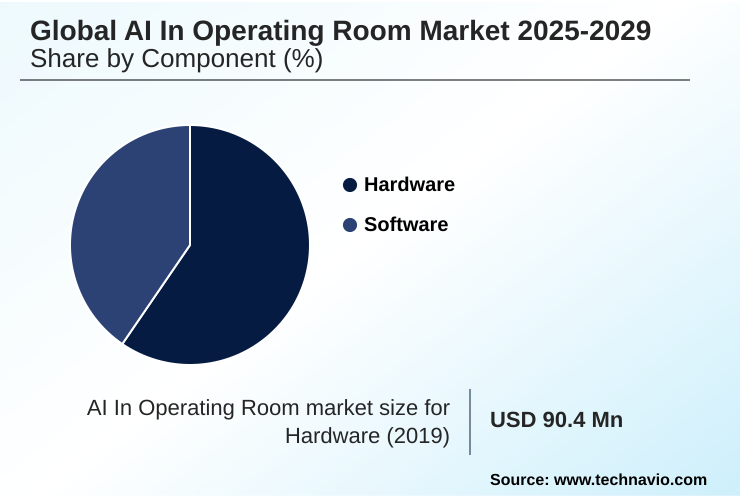
The Hardware segment was valued at USD 240.9 million in 2023 and showed a gradual increase during the forecast period.
Regional Analysis
North America is estimated to contribute 41.4% to the growth of the global market during the forecast period.Technavio’s analysts have elaborately explained the regional trends and drivers that shape the market during the forecast period.
See How AI In Operating Room Market Demand is Rising in North America Get Free Sample
North America accounts for 41% of the market opportunity, driven by high healthcare expenditure and rapid adoption of novel technologies.
This region's dominance in the AI in Operating Room market is sustained by a robust innovation ecosystem and a strong focus on operating room efficiency tools.
Europe follows, representing over 26% of the market, with a strong focus on ai-powered diagnostic imaging and research.
However, the APAC region is set to grow the fastest, with a CAGR of 36.4%, fueled by modernizing healthcare infrastructure and increasing investments in AI for surgical risk assessment.
The intelligent surgical units and AI-powered surgical training simulators are seeing increased demand across all regions, but disparities in or scheduling optimization and access to advanced tele-mentoring in surgery persist between developed and emerging markets like South America.
Market Dynamics
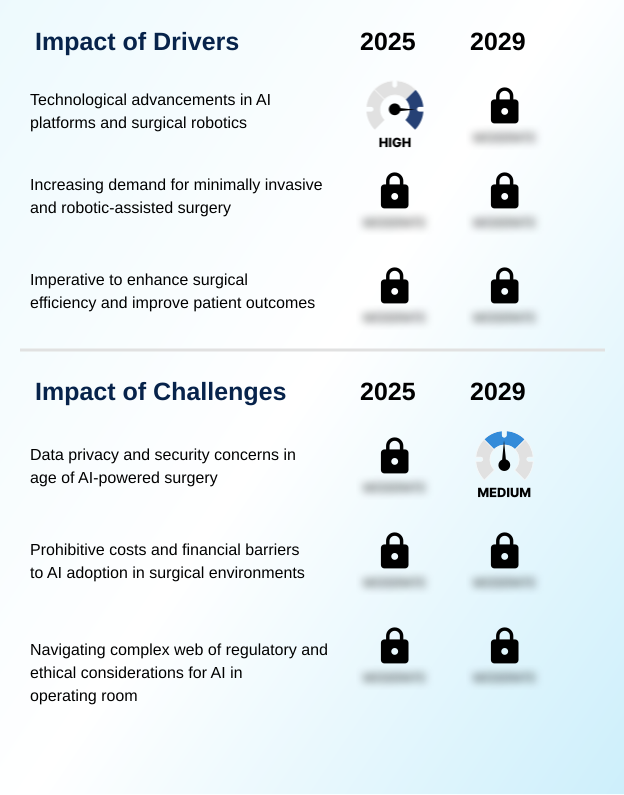
Our researchers analyzed the data with 2024 as the base year, along with the key drivers, trends, and challenges. A holistic analysis of drivers will help companies refine their marketing strategies to gain a competitive advantage.
- The integration of advanced intelligence is pivotal for improving surgical outcomes with data analytics and achieving an AI-driven standardization of surgical best practices. A key focus is on AI for reducing surgical variability, where platforms analyze procedural data to identify and promote optimal techniques, which is especially critical in complex fields like machine learning in orthopedic surgery.
- The use of deep learning for tissue recognition and computer vision for polyp detection enhances diagnostic accuracy during procedures. For navigation, augmented reality for spine surgery navigation provides surgeons with an unprecedented view of patient anatomy.
- Operationally, predictive analytics for or scheduling helps hospitals optimize resource utilization, addressing a significant cost center where facilities with integrated systems show marked efficiency gains over those without. The role of natural language processing for operative notes automates documentation, while AI algorithms for surgical instrument tracking improve logistics.
- Beyond the procedure, the AI role in postoperative patient monitoring is crucial for early complication detection. However, data privacy in AI-powered surgery and navigating the ethical considerations of AI in surgery remain paramount.
- The impact of AI on surgical training is being realized through AI-powered surgical training simulators, while the cost-effectiveness of AI in operating rooms is a key factor in adoption decisions. These systems increasingly require integrating AI with electronic health records and addressing regulatory pathways for AI medical devices.
What are the key market drivers leading to the rise in the adoption of AI In Operating Room Industry?
- Technological advancements in AI platforms and surgical robotics are a key driver for the market, enhancing surgical precision and enabling data-driven decision-making.
- The market's expansion is fueled by continuous innovation in AI-enhanced surgical tools and robotic surgery advancements. The development of powerful machine learning algorithms and computer vision for surgery is enhancing robotic-assisted surgery, leading to greater precision and improved patient outcomes.
- This technological push is supported by a receptive regulatory environment, which saw a record 221 authorizations for AI-enabled medical devices in a single year.
- The demand for minimally invasive procedures is a powerful catalyst, driving adoption of intelligent operating room technologies.
- Data-driven surgical care is another key driver, as healthcare systems use predictive surgical analytics and AI-driven clinical pathways to improve efficiency, optimize resource allocation, and enhance patient safety, making it a compelling investment for providers.
What are the market trends shaping the AI In Operating Room Industry?
- A primary market trend is the adoption of AI-driven surgical training and personalized education platforms. These systems provide immersive, data-driven simulation environments to enhance surgeon proficiency.
- The AI in Operating Room market is increasingly shaped by trends that extend beyond the procedure itself. AI for surgeon training is moving from concept to practice with platforms that provide objective feedback, with some systems demonstrating over 80% accuracy in predicting trainee proficiency. A significant trend is enhanced intraoperative guidance systems using augmented reality surgical navigation to improve precision.
- This provides surgeons with a real-time anatomical map. Furthermore, ai-based complication prediction is being applied in remote patient recovery monitoring, where machine learning models analyze data from wearables to detect recovery deviations. This data-driven approach supports value-based surgery models by reducing readmissions. These surgical intelligence software solutions, including AI in gastroenterology procedures, are becoming integral to the entire care continuum.
What challenges does the AI In Operating Room Industry face during its growth?
- Significant challenges affecting industry growth include data privacy and security concerns inherent in the age of AI-powered surgery.
- Despite its potential, the market faces significant challenges, particularly around data privacy in AI-powered surgery. The aggregation of sensitive health data for surgical data analytics creates vulnerabilities, a risk highlighted by a single healthcare data breach that affected 190 million individuals. This makes ethical AI in surgery a critical concern.
- Furthermore, high implementation costs for smart OR technology are a major barrier, alongside the complexities of navigating evolving regulatory frameworks for medical AI. These AI-powered surgical logistics challenges are compounded by the need for specialized procedural video analysis and training, hindering widespread adoption, particularly in facilities with limited capital for digital surgery platforms and computer-assisted intervention.
Exclusive Technavio Analysis on Customer Landscape
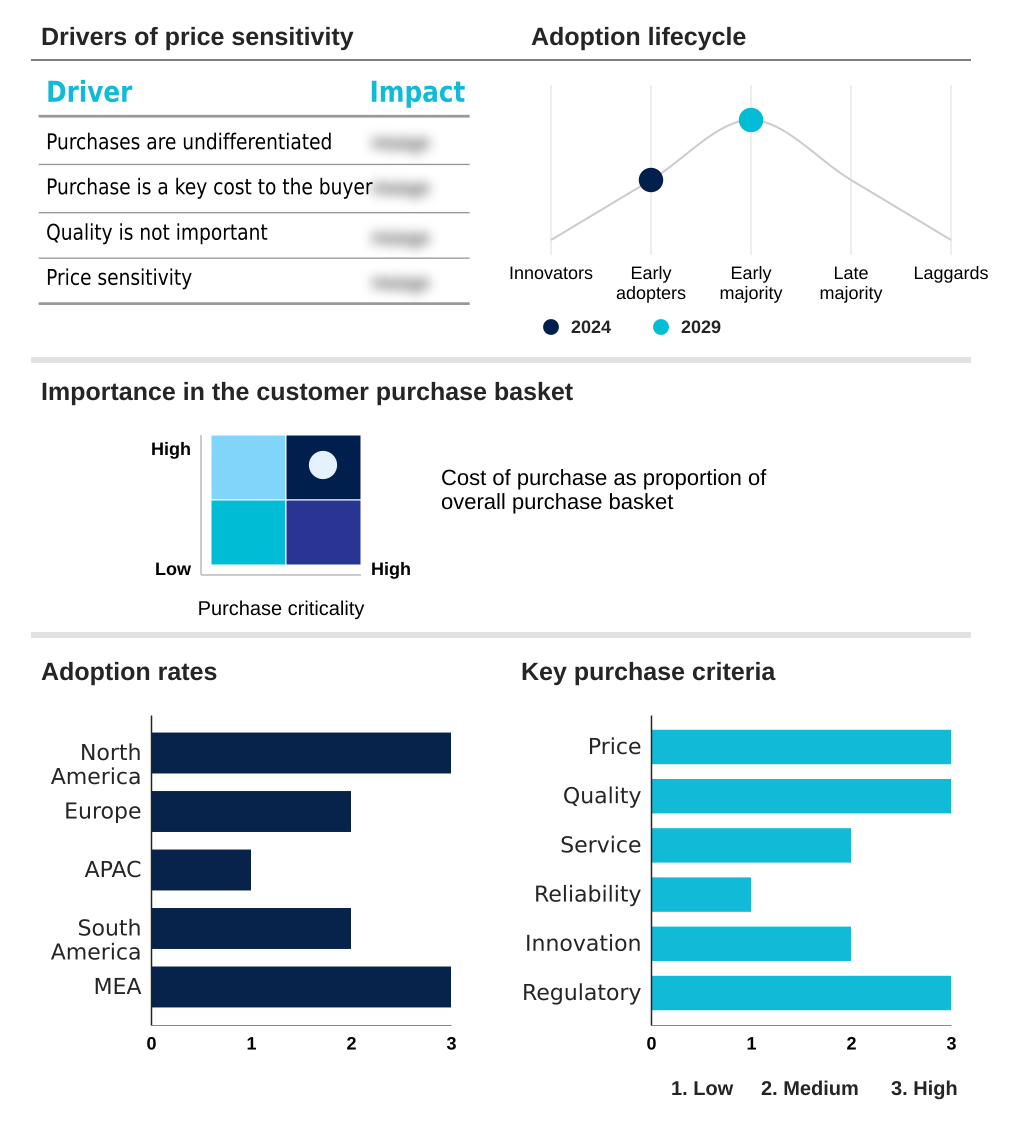
The ai in operating room market forecasting report includes the adoption lifecycle of the market, covering from the innovator’s stage to the laggard’s stage. It focuses on adoption rates in different regions based on penetration. Furthermore, the ai in operating room market report also includes key purchase criteria and drivers of price sensitivity to help companies evaluate and develop their market growth analysis strategies.
Customer Landscape of AI In Operating Room Industry
Competitive Landscape
Companies are implementing various strategies, such as strategic alliances, ai in operating room market forecast, partnerships, mergers and acquisitions, geographical expansion, and product/service launches, to enhance their presence in the industry.
Activ Surgical Inc. - Delivers real-time intraoperative visualization and surgical insights through an advanced AI-powered imaging module, leveraging computer vision and fluorescence technologies.
The industry research and growth report includes detailed analyses of the competitive landscape of the market and information about key companies, including:
- Activ Surgical Inc.
- Barco NV
- Brainlab AG
- Brainomix Ltd.
- Caresyntax GmbH
- Getinge AB
- Global Healthcare Exchange LLC
- Intuitive Surgical Inc.
- Johnson and Johnson Services
- KARL STORZ SE and Co. KG
- LeanTaaS Inc.
- Medtronic Plc
- Proximie Ltd.
- Scalpel Ltd.
- Stryker Corp.
- Theator Inc.
- Zimmer Biomet Holdings Inc.
Qualitative and quantitative analysis of companies has been conducted to help clients understand the wider business environment as well as the strengths and weaknesses of key industry players. Data is qualitatively analyzed to categorize companies as pure play, category-focused, industry-focused, and diversified; it is quantitatively analyzed to categorize companies as dominant, leading, strong, tentative, and weak.
Recent Development and News in Ai in operating room market
- In November, 2024, The European Union began implementing its landmark AI Act, which classifies most AI-powered medical technologies as high-risk systems requiring rigorous conformity assessments and continuous monitoring.
- In December, 2024, The U.S. Food and Drug Administration issued final guidance on Predetermined Change Control Plans, establishing a more agile regulatory pathway for modifications to AI and machine learning models in medical devices.
- In January, 2025, South Korea's Digital Medical Products Act became effective, introducing a new comprehensive regulatory framework for AI-based medical software and devices to foster innovation while ensuring safety.
- In May, 2025, A research team at Washington University in St. Louis detailed an AI foundation model capable of analyzing clinical notes from surgical patients to proactively predict postoperative complications like pneumonia and infections.
Dive into Technavio’s robust research methodology, blending expert interviews, extensive data synthesis, and validated models for unparalleled AI In Operating Room Market insights. See full methodology.
| Market Scope | |
|---|---|
| Page number | 299 |
| Base year | 2024 |
| Historic period | 2019-2023 |
| Forecast period | 2025-2029 |
| Growth momentum & CAGR | Accelerate at a CAGR of 35.2% |
| Market growth 2025-2029 | USD 1926.0 million |
| Market structure | Fragmented |
| YoY growth 2024-2025(%) | 34.0% |
| Key countries | US, Canada, Mexico, Germany, UK, France, The Netherlands, Italy, Spain, China, Japan, India, South Korea, Australia, Indonesia, Brazil, Argentina, Colombia, Saudi Arabia, UAE, South Africa, Israel and Turkey |
| Competitive landscape | Leading Companies, Market Positioning of Companies, Competitive Strategies, and Industry Risks |
Research Analyst Overview
- The AI In Operating Room market is fundamentally reshaping surgical practice through the integration of sophisticated surgical robotics platforms and digital surgery ecosystems. The approval of 221 AI-enabled medical devices in a single year underscores the rapid pace of innovation and provides a clearer regulatory pathway, a critical factor for boardroom-level strategic planning and investment.
- Core technologies like deep learning in surgery and computer vision for surgery are enabling advanced preoperative surgical planning and intraoperative guidance systems. This shift facilitates surgical workflow optimization and enhances minimally invasive procedures. Surgical data analytics, derived from procedural video analysis and other sources, are providing unprecedented data-driven surgical insights.
- The focus is on improving surgical performance metrics and enabling predictive modeling for outcomes, moving the field toward standardized excellence and enhanced patient safety. This data-centric approach is also transforming surgical simulation and training, making it more objective and effective. AI-powered diagnostic imaging and postoperative data analysis are becoming standard components of the care continuum.
What are the Key Data Covered in this AI In Operating Room Market Research and Growth Report?
-
What is the expected growth of the AI In Operating Room Market between 2025 and 2029?
-
USD 1.93 billion, at a CAGR of 35.2%
-
-
What segmentation does the market report cover?
-
The report is segmented by Component (Hardware, Software), Technology (Deep learning, Machine learning, Natural language processing, Others), Application (Urology, Gastroenterology, Neurology, Cardiology, Orthopedics) and Geography (North America, Europe, APAC, South America, Middle East and Africa)
-
-
Which regions are analyzed in the report?
-
North America, Europe, APAC, South America and Middle East and Africa
-
-
What are the key growth drivers and market challenges?
-
Technological advancements in AI platforms and surgical robotics, Data privacy and security concerns in age of AI-powered surgery
-
-
Who are the major players in the AI In Operating Room Market?
-
Activ Surgical Inc., Barco NV, Brainlab AG, Brainomix Ltd., Caresyntax GmbH, Getinge AB, Global Healthcare Exchange LLC, Intuitive Surgical Inc., Johnson and Johnson Services, KARL STORZ SE and Co. KG, LeanTaaS Inc., Medtronic Plc, Proximie Ltd., Scalpel Ltd., Stryker Corp., Theator Inc. and Zimmer Biomet Holdings Inc.
-
Market Research Insights
- The market is defined by a push toward data-driven surgical care, with a strong emphasis on value-based surgery models. The adoption of digital surgery platforms is accelerating, evidenced by a record 221 regulatory authorizations for AI-enabled medical devices in a single year. These surgical intelligence software systems are central to or scheduling optimization and improving outcomes.
- Innovations in AI in medical imaging analysis are critical, as they support personalized surgical planning tools that lead to more precise interventions. A survey of healthcare leaders highlighted a clear expectation of positive returns on AI investments as a prerequisite for adoption.
- Smart OR technology and computer-assisted intervention are no longer theoretical; they are practical tools enabling operating room efficiency tools and better patient care.
We can help! Our analysts can customize this ai in operating room market research report to meet your requirements.
 RIA -
RIA - 
