AI In Procurement Market Analysis, Size, and Forecast 2025-2029: North America (US, Canada, and Mexico), APAC (China, Japan, and India), Europe (Germany, UK, and France), Middle East and Africa (UAE, South Africa, and Israel), South America (Brazil, Argentina, and Colombia), and Rest of World (ROW)

AI In Procurement Market Analysis, Size, and Forecast 2025-2029:
North America (US, Canada, and Mexico), APAC (China, Japan, and India), Europe (Germany, UK, and France), Middle East and Africa (UAE, South Africa, and Israel), South America (Brazil, Argentina, and Colombia), and Rest of World (ROW)

Published: Dec 2025 305 Pages SKU: IRTNTR81026

Market Overview at a Glance

$5.87 B
Market Opportunity
27.9%
CAGR 2024 - 2029
35.9%
North America Growth
$1.24 B
Software segment 2023

AI In Procurement Market Size 2025-2029

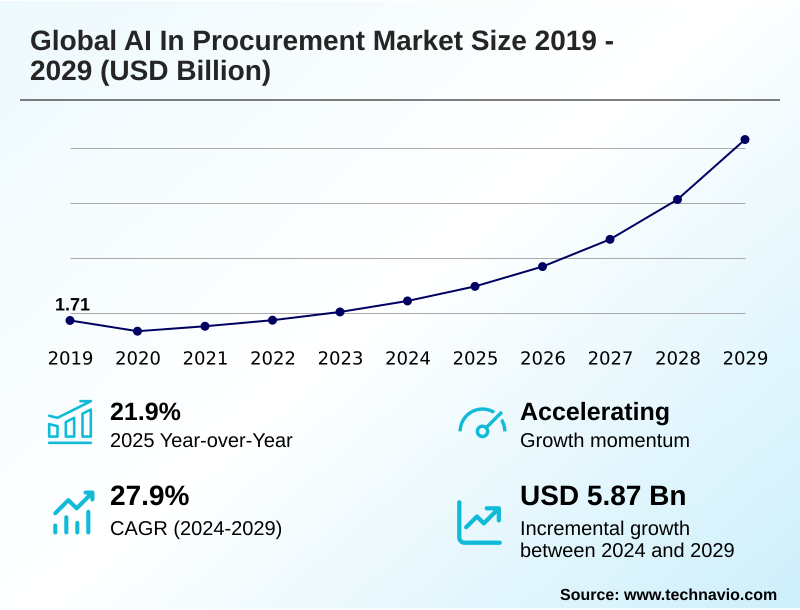
The ai in procurement market size is valued to increase by USD 5.87 billion, at a CAGR of 27.9% from 2024 to 2029. Enhanced decision making and operational efficiency will drive the ai in procurement market.

Major Market Trends & Insights

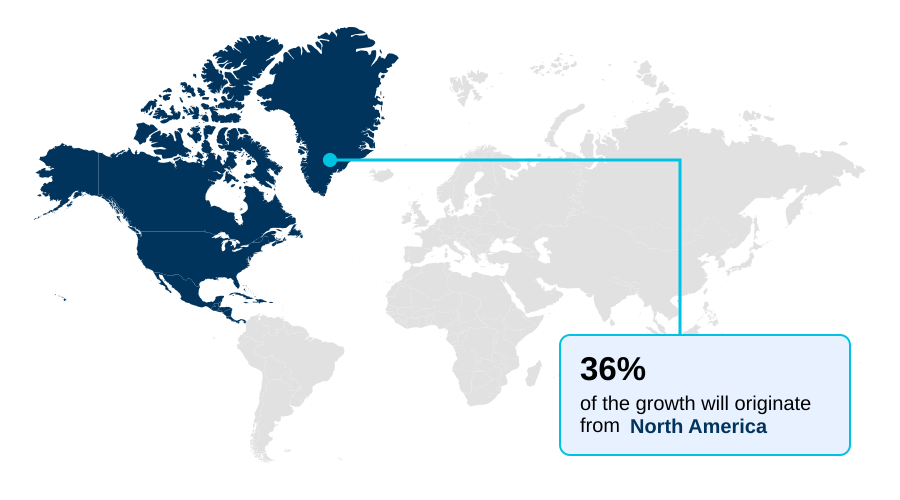
  • North America dominated the market and accounted for a 35.9% growth during the forecast period.
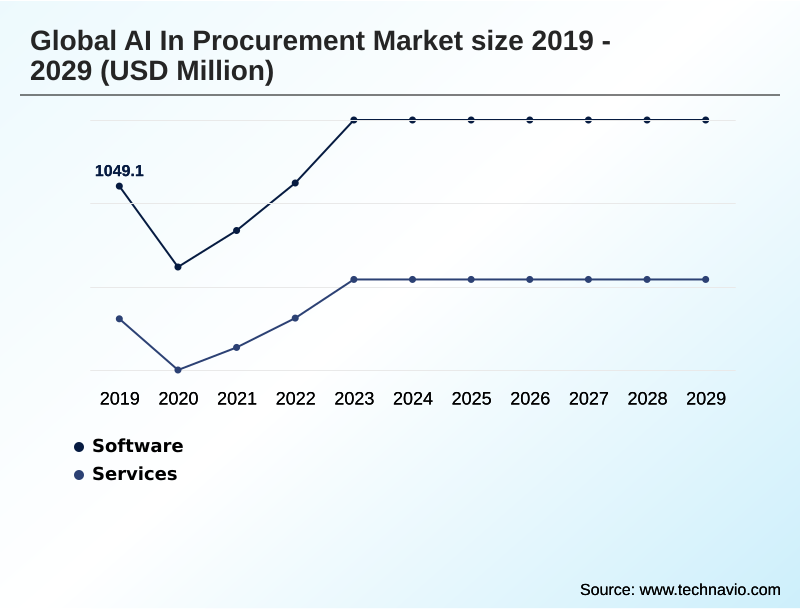
  • By Component - Software segment was valued at USD 1.24 billion in 2023
  • By End-user - Manufacturing segment accounted for the largest market revenue share in 2023

Market Size & Forecast

  • Market Opportunities: USD 6.58 billion
  • Market Future Opportunities: USD 5.87 billion
  • CAGR from 2024 to 2029 : 27.9%

Market Summary

  • The AI in procurement market is undergoing a significant transformation, moving from a transactional function to a strategic business partner. This shift is driven by the need for enhanced operational efficiency, proactive risk management, and data-driven insights.
  • By leveraging technologies such as machine learning and natural language processing, organizations are automating repetitive tasks like invoice processing and purchase order creation, allowing professionals to focus on higher-value activities. For instance, a manufacturing firm can utilize predictive analytics to anticipate supply chain disruptions, analyzing real-time data on supplier performance and geopolitical events to develop alternative sourcing strategies proactively.
  • This capability builds resilience in a volatile global market. However, the integration of these sophisticated systems introduces challenges, including the complexity of integrating with legacy platforms, ensuring data security against cyber threats, and addressing the growing talent gap for professionals skilled in both procurement and AI.
  • The evolving regulatory environment, including new data privacy and AI governance laws, further complicates adoption, demanding a strategic approach to compliance and risk management.

What will be the Size of the AI In Procurement Market during the forecast period?

Get Key Insights on Market Forecast (PDF) Request Free Sample

How is the AI In Procurement Market Segmented?

The ai in procurement industry research report provides comprehensive data (region-wise segment analysis), with forecasts and estimates in "USD million" for the period 2025-2029, as well as historical data from 2019-2023 for the following segments.

  • Component
    • Software
    • Services
  • End-user
    • Manufacturing
    • Retail and e-commerce
    • Healthcare
    • Transportation and logistics
    • Others
  • Technology
    • Machine learning
    • Natural language processing
    • Predictive analytics
    • Computer vision
    • Robotic process automation
  • Geography
    • North America
      • US
      • Canada
      • Mexico
    • APAC
      • China
      • Japan
      • India
    • Europe
      • Germany
      • UK
      • France
    • Middle East and Africa
      • UAE
      • South Africa
      • Israel
    • South America
      • Brazil
      • Argentina
      • Colombia
    • Rest of World (ROW)

By Component Insights

The software segment is estimated to witness significant growth during the forecast period.

The software segment is defined by a rapidly evolving landscape where advanced AI functionalities are becoming more accessible. Organizations are moving beyond simple task automation, leveraging platforms for strategic partnership.

A key trend involves the use of generative AI tools for procurement data enrichment and payment fraud detection, which can improve data accuracy by over 95%.

These AI-driven category management systems, integrated with procurement chatbots, provide strategic sourcing intelligence and real-time spend visibility.

This shift enables procurement software to act as a strategic partner, offering predictive insights and intelligent invoice processing through natural language processing in sourcing and AI for ESG compliance, supporting complex decision-making across the entire source-to-pay process with robust procurement workflow automation.

Request Free Sample

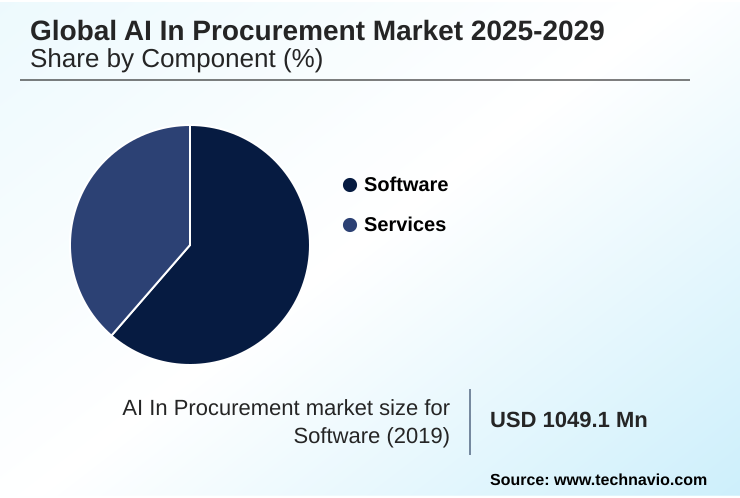
The Software segment was valued at USD 1.24 billion in 2023 and showed a gradual increase during the forecast period.

Request Free Sample

Regional Analysis

North America is estimated to contribute 35.9% to the growth of the global market during the forecast period.Technavio’s analysts have elaborately explained the regional trends and drivers that shape the market during the forecast period.

See How AI In Procurement Market Demand is Rising in North America Request Free Sample

The geographic landscape of the AI in procurement market is led by North America, which accounts for over 35% of the market's incremental growth, driven by early technology adoption and a high concentration of AI providers.

This region leverages AI for predictive sourcing and comprehensive supply chain risk monitoring. In contrast, the APAC region is the fastest-growing market, propelled by rapid digitalization and a strong manufacturing base.

European adoption is shaped by a stringent regulatory environment, with a focus on using AI for spend optimization and ensuring compliance with evolving data laws. AI for supplier negotiation and robotic process automation in P2P are being implemented globally.

South America and the Middle East and Africa are emerging markets, with growing interest in AI for spend analytics and automated supplier vetting to navigate economic pressures and enhance operational stability.

Market Dynamics

Our researchers analyzed the data with 2024 as the base year, along with the key drivers, trends, and challenges. A holistic analysis of drivers will help companies refine their marketing strategies to gain a competitive advantage.

  • Organizations are increasingly exploring how AI improves procurement efficiency by moving beyond basic automation. A key question is understanding the benefits of generative AI in sourcing, which allows for the rapid creation of complex documents like RFPs and supplier scorecards.
  • For strategic planning, firms are focused on AI for mitigating supply chain risks, using predictive analytics for commodity pricing to anticipate market shifts. The challenge of implementing AI in legacy procurement systems remains, but the business case is compelling, with use cases for AI in contract management demonstrating a significant reduction in legal review cycles.
  • In retail, AI-driven demand forecasting for retail is critical for inventory optimization. Operationally, robotic process automation for invoice matching and automating the procure-to-pay cycle have become standard practice, while machine learning models for supplier scoring are refining partner selection.
  • Firms that leverage natural language processing for RFP analysis can process submissions more than twice as fast as those using manual methods. This efficiency extends to using AI for real-time spend analytics and optimizing tail spend with AI.
  • The ability to use AI for strategic supplier discovery is transforming sourcing, while AI-powered negotiation tools for procurement are empowering teams to secure better terms. Furthermore, AI for ensuring procurement policy compliance and reducing procurement fraud with AI are critical for governance, as is AI-driven ESG monitoring in procurement.
  • The entire process is being streamlined, from automating supplier onboarding with AI to the strategic evaluation of partners.

What are the key market drivers leading to the rise in the adoption of AI In Procurement Industry?

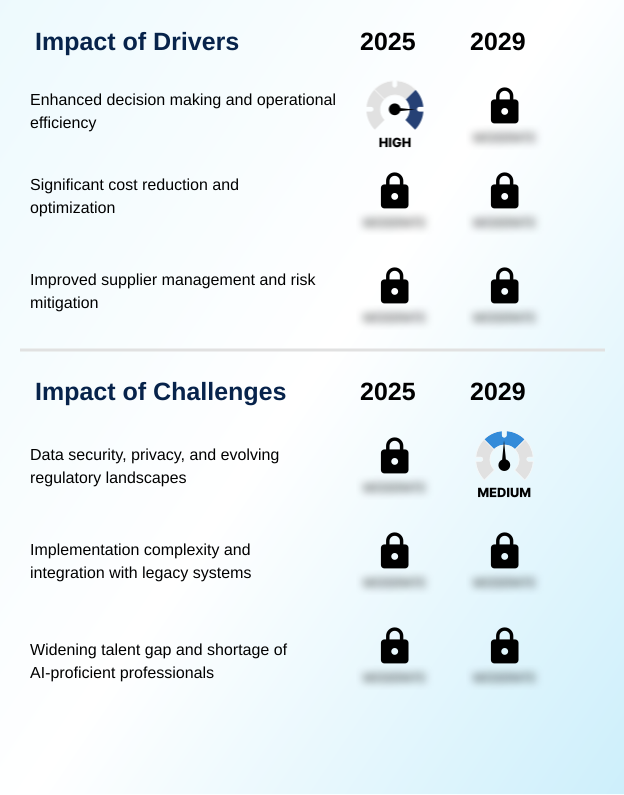
  • The primary driver propelling market growth is the significant enhancement of decision-making capabilities and operational efficiency through AI integration.

  • The market is propelled by the significant financial and operational advantages AI delivers.
  • A primary driver is substantial cost reduction, with AI-powered spend optimization identifying savings opportunities previously hidden in vast datasets, leading to outcomes like a 15% reduction in purchasing costs for some adopters.
  • Enhanced decision-making is another critical factor, as procurement analytics and machine learning for spend analytics provide actionable insights from complex information. This enables a more strategic approach to procurement, moving beyond tactical execution.
  • Improved supplier management, facilitated by AI-driven supplier discovery and supplier performance management, builds more resilient and competitive supply chains.
  • By automating due diligence and using AI to vet new partners through tools like procurement workflow automation, organizations can better mitigate risks related to performance, compliance, and geopolitical instability, ultimately transforming the procurement function.

What are the market trends shaping the AI In Procurement Industry?

  • A key market trend is the drive toward enhanced efficiency and cost reduction through the strategic automation of procurement workflows. This shift liberates resources and accelerates operational cycle times.

  • Key market trends revolve around leveraging AI to achieve new levels of operational excellence. The adoption of AI-powered tail spend solutions and conversational AI for procurement automates previously unmanaged expenditure and routine communications, with some firms reporting a 44% reduction in manual tasks.
  • A significant trend is the move toward proactive risk management, using predictive risk signals to enhance supply chain resilience in an era of frequent disruptions. For example, continuous risk assessment is critical, as highlighted by a notable increase in supplier bankruptcies last year. This allows procurement teams to shift from a reactive to a proactive stance.
  • The use of procurement control tower solutions provides a centralized hub for data-driven insights, enabling more strategic decisions. Furthermore, technologies like computer vision for inventory audit are enhancing accuracy and reducing manual cycle counting, directly improving procurement planning.

What challenges does the AI In Procurement Industry face during its growth?

  • A key challenge affecting industry growth stems from concerns over data security and privacy, compounded by an evolving and complex regulatory landscape.

  • Market growth faces significant challenges, primarily centered on data governance, system integration, and talent. Data security is a major concern, as AI platforms handling sensitive supplier financial data and contract terms become high-value targets for cyberattacks. The evolving regulatory landscape, exemplified by the EU AI Act with penalties of up to 7% of global revenue, adds complexity to compliance monitoring.
  • Implementation complexity and integration with legacy ERP systems present another barrier, as retrofitting AI onto older architectures can be costly and inefficient. This is compounded by a widening talent gap, with a significant shortage of professionals possessing the hybrid skills needed for AI in strategic sourcing and data analytics.
  • This forces reliance on external consultants, increasing the overall cost and complexity of AI adoption and hindering the ability to scale solutions effectively.

Exclusive Technavio Analysis on Customer Landscape

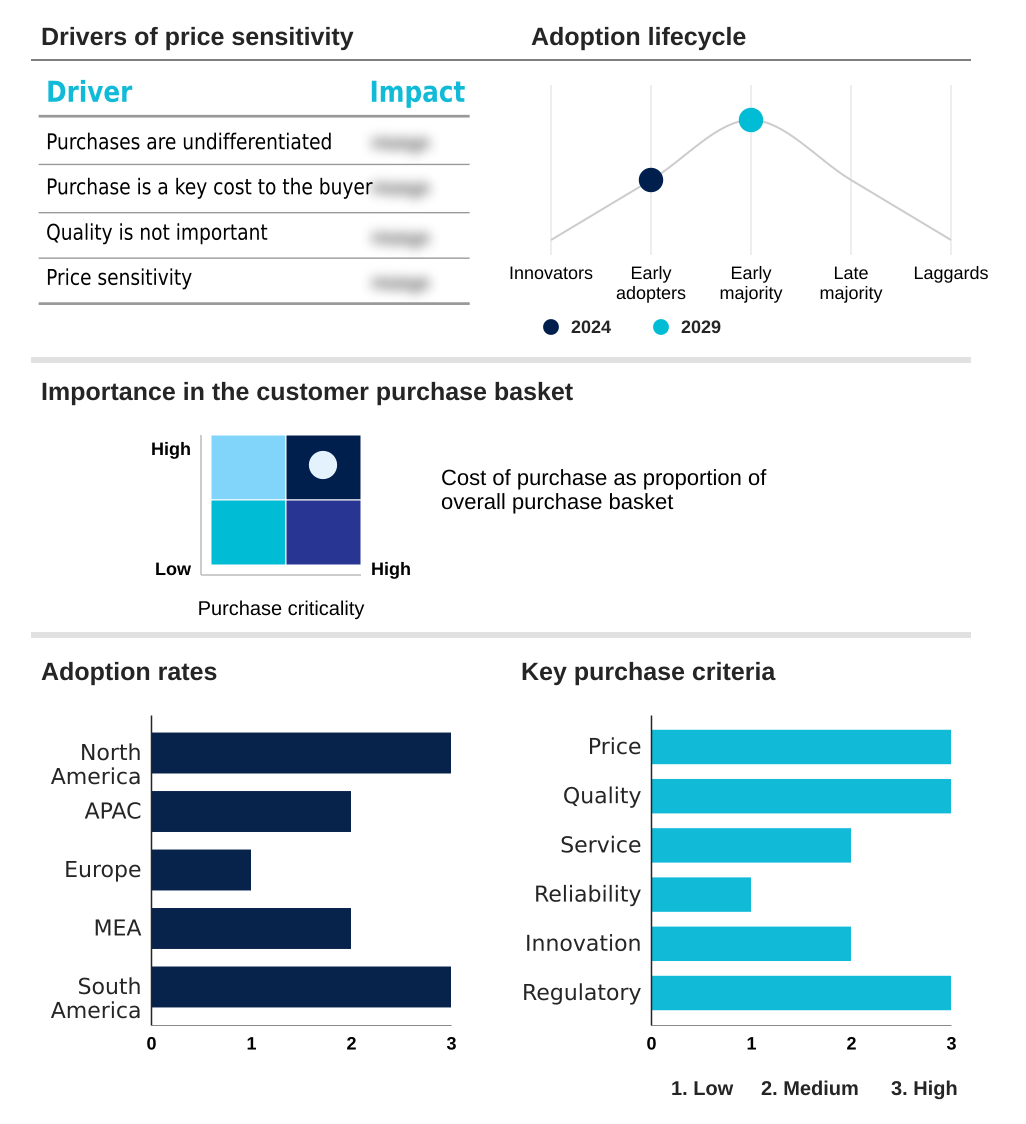
The ai in procurement market forecasting report includes the adoption lifecycle of the market, covering from the innovator’s stage to the laggard’s stage. It focuses on adoption rates in different regions based on penetration. Furthermore, the ai in procurement market report also includes key purchase criteria and drivers of price sensitivity to help companies evaluate and develop their market growth analysis strategies.

Customer Landscape of AI In Procurement Industry

Competitive Landscape

Companies are implementing various strategies, such as strategic alliances, ai in procurement market forecast, partnerships, mergers and acquisitions, geographical expansion, and product/service launches, to enhance their presence in the industry.

Basware Corp. - Enables financial automation through AI-driven platforms, optimizing accounts payable and strategic outcomes with predictive analytics and touchless invoice processing.

The industry research and growth report includes detailed analyses of the competitive landscape of the market and information about key companies, including:

  • Basware Corp.
  • Clarifai Inc.
  • Coupa Software Inc.
  • GEP
  • H2O.ai Inc.
  • Intel Corp.
  • IBM Corp.
  • Ivalua Inc.
  • JAGGAER LLC
  • Microsoft Corp.
  • NVIDIA Corp.
  • Oracle Corp.
  • Proactis Holdings plc
  • SAP SE
  • TradeShift Inc.
  • Xeeva Inc.
  • Zebra Technologies Corp.
  • Zycus Inc.

Qualitative and quantitative analysis of companies has been conducted to help clients understand the wider business environment as well as the strengths and weaknesses of key industry players. Data is qualitatively analyzed to categorize companies as pure play, category-focused, industry-focused, and diversified; it is quantitatively analyzed to categorize companies as dominant, leading, strong, tentative, and weak.

Recent Development and News in Ai in procurement market

  • In September, 2024, IBM Corp. announced the launch of watsonx for Procurement, a new suite of generative AI agents designed to automate complex sourcing events, from RFP generation to advanced supplier negotiation simulations.
  • In November, 2024, SAP SE and NVIDIA Corp. revealed a strategic partnership to integrate NVIDIA's AI Enterprise software into the SAP Ariba platform, aiming to accelerate predictive analytics for supply chain risk.
  • In February, 2025, Coupa Software Inc. acquired a leading ESG data analytics firm to integrate real-time sustainability and compliance scoring directly into its procurement platform, enhancing supplier vetting.
  • In April, 2025, Microsoft Corp. launched its 'Responsible Procurement AI' initiative, providing a new framework and tools within Azure to help organizations ensure their use of AI in procurement complies with the evolving EU AI Act.

Dive into Technavio’s robust research methodology, blending expert interviews, extensive data synthesis, and validated models for unparalleled AI In Procurement Market insights. See full methodology.

Market Scope
Page number 305
Base year 2024
Historic period 2019-2023
Forecast period 2025-2029
Growth momentum & CAGR Accelerate at a CAGR of 27.9%
Market growth 2025-2029 USD 5865.4 million
Market structure Fragmented
YoY growth 2024-2025(%) 21.9%
Key countries US, Canada, Mexico, China, Japan, India, South Korea, Australia, Indonesia, Germany, UK, France, Italy, The Netherlands, Spain, UAE, South Africa, Israel, Saudi Arabia, Turkey, Brazil, Argentina and Colombia
Competitive landscape Leading Companies, Market Positioning of Companies, Competitive Strategies, and Industry Risks

Request Free Sample

Research Analyst Overview

  • The AI in procurement market is fundamentally reshaping enterprise operations by embedding intelligence across the entire source-to-pay process. This evolution is marked by a transition from basic purchase order automation and invoice data extraction to sophisticated strategic sourcing intelligence and predictive sourcing. Organizations are deploying AI-driven supplier discovery and supplier onboarding automation to build more resilient networks.
  • At the core, spend analysis automation and detailed spend categorization provide unparalleled real-time spend visibility, allowing for proactive tail spend management. For instance, companies leveraging these tools have achieved a 15% enhancement in procurement return on investment. The adoption of procurement analytics, powered by machine learning, facilitates dynamic supplier performance management and robust supplier risk assessment.
  • Within the workflow, guided buying systems and procurement chatbots streamline user interactions, while request for proposal (RFP) automation accelerates sourcing cycles. A key boardroom-level driver is compliance monitoring, where AI ensures adherence to internal policies and external regulations, directly impacting corporate governance.
  • Advanced functionalities like negotiation support systems and robust payment fraud detection further enhance financial controls and outcomes within e-procurement platforms and contract lifecycle management.

What are the Key Data Covered in this AI In Procurement Market Research and Growth Report?

  • What is the expected growth of the AI In Procurement Market between 2025 and 2029?

    • USD 5.87 billion, at a CAGR of 27.9%

  • What segmentation does the market report cover?

    • The report is segmented by Component (Software, Services), End-user (Manufacturing, Retail and e-commerce, Healthcare, Transportation and logistics, Others), Technology (Machine learning, Natural language processing, Predictive analytics, Computer vision, Robotic process automation) and Geography (North America, APAC, Europe, Middle East and Africa, South America)

  • Which regions are analyzed in the report?

    • North America, APAC, Europe, Middle East and Africa and South America

  • What are the key growth drivers and market challenges?

    • Enhanced decision making and operational efficiency, Data security, privacy, and evolving regulatory landscapes

  • Who are the major players in the AI In Procurement Market?

    • Basware Corp., Clarifai Inc., Coupa Software Inc., GEP, H2O.ai Inc., Intel Corp., IBM Corp., Ivalua Inc., JAGGAER LLC, Microsoft Corp., NVIDIA Corp., Oracle Corp., Proactis Holdings plc, SAP SE, TradeShift Inc., Xeeva Inc., Zebra Technologies Corp. and Zycus Inc.

Market Research Insights

  • Market dynamics are increasingly influenced by the adoption of advanced AI, with organizations leveraging autonomous sourcing and cognitive spend intelligence to gain a competitive edge. A recent study indicated that nearly a quarter of businesses have already deployed generative AI, achieving a 44% reduction in manual tasks.
  • This drive for efficiency is evident as companies use AI-powered supplier collaboration and intelligent procurement intake systems. Firms implementing AI-driven category management have reported a 15% enhancement in procurement ROI.
  • Furthermore, the use of a procurement digital twin allows for sophisticated scenario modeling, while agentic AI in procurement helps automate complex negotiations, reflecting a clear trend toward more intelligent and resilient supply chain operations.

We can help! Our analysts can customize this ai in procurement market research report to meet your requirements.

Get in touch

1. Executive Summary

1.1 Market overview

Executive Summary - Chart on Market Overview
Executive Summary - Data Table on Market Overview
Executive Summary - Chart on Global Market Characteristics
Executive Summary - Chart on Market by Geography
Executive Summary - Chart on Market Segmentation by Component
Executive Summary - Chart on Market Segmentation by End-user
Executive Summary - Chart on Market Segmentation by Technology
Executive Summary - Chart on Incremental Growth
Executive Summary - Data Table on Incremental Growth
Executive Summary - Chart on Company Market Positioning

2. Technavio Analysis

2.1 Analysis of price sensitivity, lifecycle, customer purchase basket, adoption rates, and purchase criteria

2.2 Criticality of inputs and Factors of differentiation

Chart on Overview on criticality of inputs and factors of differentiation

2.3 Factors of disruption

Chart on Overview on factors of disruption

2.4 Impact of drivers and challenges

Chart on Impact of drivers and challenges in 2024 and 2029

3. Market Landscape

3.1 Market ecosystem

Chart on Parent Market
Data Table on - Parent Market

3.2 Market characteristics

Chart on Market characteristics analysis

3.3 Value chain analysis

Chart on Value chain analysis

4. Market Sizing

4.1 Market definition

Data Table on Offerings of companies included in the market definition

4.2 Market segment analysis

Market segments

4.3 Market size 2024

4.4 Market outlook: Forecast for 2024-2029

Chart on Global - Market size and forecast 2024-2029 ($ million)
Data Table on Global - Market size and forecast 2024-2029 ($ million)
Chart on Global Market: Year-over-year growth 2024-2029 (%)
Data Table on Global Market: Year-over-year growth 2024-2029 (%)

5. Historic Market Size

5.1 Global AI In Procurement Market 2019 - 2023

Historic Market Size - Data Table on Global AI In Procurement Market 2019 - 2023 ($ million)

5.2 Component segment analysis 2019 - 2023

Historic Market Size - Component Segment 2019 - 2023 ($ million)

5.3 End-user segment analysis 2019 - 2023

Historic Market Size - End-user Segment 2019 - 2023 ($ million)

5.4 Technology segment analysis 2019 - 2023

Historic Market Size - Technology Segment 2019 - 2023 ($ million)

5.5 Geography segment analysis 2019 - 2023

Historic Market Size - Geography Segment 2019 - 2023 ($ million)

5.6 Country segment analysis 2019 - 2023

Historic Market Size - Country Segment 2019 - 2023 ($ million)

6. Five Forces Analysis

6.1 Five forces summary

Five forces analysis - Comparison between 2024 and 2029

6.2 Bargaining power of buyers

Bargaining power of buyers - Impact of key factors 2024 and 2029

6.3 Bargaining power of suppliers

Bargaining power of suppliers - Impact of key factors in 2024 and 2029

6.4 Threat of new entrants

Threat of new entrants - Impact of key factors in 2024 and 2029

6.5 Threat of substitutes

Threat of substitutes - Impact of key factors in 2024 and 2029

6.6 Threat of rivalry

Threat of rivalry - Impact of key factors in 2024 and 2029

6.7 Market condition

Chart on Market condition - Five forces 2024 and 2029

7. Market Segmentation by Component

7.1 Market segments

Chart on Component - Market share 2024-2029 (%)
Data Table on Component - Market share 2024-2029 (%)

7.2 Comparison by Component

Chart on Comparison by Component
Data Table on Comparison by Component

7.3 Software - Market size and forecast 2024-2029

Chart on Software - Market size and forecast 2024-2029 ($ million)
Data Table on Software - Market size and forecast 2024-2029 ($ million)
Chart on Software - Year-over-year growth 2024-2029 (%)
Data Table on Software - Year-over-year growth 2024-2029 (%)

7.4 Services - Market size and forecast 2024-2029

Chart on Services - Market size and forecast 2024-2029 ($ million)
Data Table on Services - Market size and forecast 2024-2029 ($ million)
Chart on Services - Year-over-year growth 2024-2029 (%)
Data Table on Services - Year-over-year growth 2024-2029 (%)

7.5 Market opportunity by Component

Market opportunity by Component ($ million)
Data Table on Market opportunity by Component ($ million)

8. Market Segmentation by End-user

8.1 Market segments

Chart on End-user - Market share 2024-2029 (%)
Data Table on End-user - Market share 2024-2029 (%)

8.2 Comparison by End-user

Chart on Comparison by End-user
Data Table on Comparison by End-user

8.3 Manufacturing - Market size and forecast 2024-2029

Chart on Manufacturing - Market size and forecast 2024-2029 ($ million)
Data Table on Manufacturing - Market size and forecast 2024-2029 ($ million)
Chart on Manufacturing - Year-over-year growth 2024-2029 (%)
Data Table on Manufacturing - Year-over-year growth 2024-2029 (%)

8.4 Retail and e-commerce - Market size and forecast 2024-2029

Chart on Retail and e-commerce - Market size and forecast 2024-2029 ($ million)
Data Table on Retail and e-commerce - Market size and forecast 2024-2029 ($ million)
Chart on Retail and e-commerce - Year-over-year growth 2024-2029 (%)
Data Table on Retail and e-commerce - Year-over-year growth 2024-2029 (%)

8.5 Healthcare - Market size and forecast 2024-2029

Chart on Healthcare - Market size and forecast 2024-2029 ($ million)
Data Table on Healthcare - Market size and forecast 2024-2029 ($ million)
Chart on Healthcare - Year-over-year growth 2024-2029 (%)
Data Table on Healthcare - Year-over-year growth 2024-2029 (%)

8.6 Transportation and logistics - Market size and forecast 2024-2029

Chart on Transportation and logistics - Market size and forecast 2024-2029 ($ million)
Data Table on Transportation and logistics - Market size and forecast 2024-2029 ($ million)
Chart on Transportation and logistics - Year-over-year growth 2024-2029 (%)
Data Table on Transportation and logistics - Year-over-year growth 2024-2029 (%)

8.7 Others - Market size and forecast 2024-2029

Chart on Others - Market size and forecast 2024-2029 ($ million)
Data Table on Others - Market size and forecast 2024-2029 ($ million)
Chart on Others - Year-over-year growth 2024-2029 (%)
Data Table on Others - Year-over-year growth 2024-2029 (%)

8.8 Market opportunity by End-user

Market opportunity by End-user ($ million)
Data Table on Market opportunity by End-user ($ million)

9. Market Segmentation by Technology

9.1 Market segments

Chart on Technology - Market share 2024-2029 (%)
Data Table on Technology - Market share 2024-2029 (%)

9.2 Comparison by Technology

Chart on Comparison by Technology
Data Table on Comparison by Technology

9.3 Machine learning - Market size and forecast 2024-2029

Chart on Machine learning - Market size and forecast 2024-2029 ($ million)
Data Table on Machine learning - Market size and forecast 2024-2029 ($ million)
Chart on Machine learning - Year-over-year growth 2024-2029 (%)
Data Table on Machine learning - Year-over-year growth 2024-2029 (%)

9.4 Natural language processing - Market size and forecast 2024-2029

Chart on Natural language processing - Market size and forecast 2024-2029 ($ million)
Data Table on Natural language processing - Market size and forecast 2024-2029 ($ million)
Chart on Natural language processing - Year-over-year growth 2024-2029 (%)
Data Table on Natural language processing - Year-over-year growth 2024-2029 (%)

9.5 Predictive analytics - Market size and forecast 2024-2029

Chart on Predictive analytics - Market size and forecast 2024-2029 ($ million)
Data Table on Predictive analytics - Market size and forecast 2024-2029 ($ million)
Chart on Predictive analytics - Year-over-year growth 2024-2029 (%)
Data Table on Predictive analytics - Year-over-year growth 2024-2029 (%)

9.6 Computer vision - Market size and forecast 2024-2029

Chart on Computer vision - Market size and forecast 2024-2029 ($ million)
Data Table on Computer vision - Market size and forecast 2024-2029 ($ million)
Chart on Computer vision - Year-over-year growth 2024-2029 (%)
Data Table on Computer vision - Year-over-year growth 2024-2029 (%)

9.7 Robotic process automation - Market size and forecast 2024-2029

Chart on Robotic process automation - Market size and forecast 2024-2029 ($ million)
Data Table on Robotic process automation - Market size and forecast 2024-2029 ($ million)
Chart on Robotic process automation - Year-over-year growth 2024-2029 (%)
Data Table on Robotic process automation - Year-over-year growth 2024-2029 (%)

9.8 Market opportunity by Technology

Market opportunity by Technology ($ million)
Data Table on Market opportunity by Technology ($ million)

10. Customer Landscape

10.1 Customer landscape overview

Analysis of price sensitivity, lifecycle, customer purchase basket, adoption rates, and purchase criteria

11. Geographic Landscape

11.1 Geographic segmentation

Chart on Market share by geography 2024-2029 (%)
Data Table on Market share by geography 2024-2029 (%)

11.2 Geographic comparison

Chart on Geographic comparison
Data Table on Geographic comparison

11.3 North America - Market size and forecast 2024-2029

Chart on North America - Market size and forecast 2024-2029 ($ million)
Data Table on North America - Market size and forecast 2024-2029 ($ million)
Chart on North America - Year-over-year growth 2024-2029 (%)
Data Table on North America - Year-over-year growth 2024-2029 (%)
Chart on Regional Comparison - North America
Data Table on Regional Comparison - North America

11.3.1 US - Market size and forecast 2024-2029

Chart on US - Market size and forecast 2024-2029 ($ million)
Data Table on US - Market size and forecast 2024-2029 ($ million)
Chart on US - Year-over-year growth 2024-2029 (%)
Data Table on US - Year-over-year growth 2024-2029 (%)

11.3.2 Canada - Market size and forecast 2024-2029

Chart on Canada - Market size and forecast 2024-2029 ($ million)
Data Table on Canada - Market size and forecast 2024-2029 ($ million)
Chart on Canada - Year-over-year growth 2024-2029 (%)
Data Table on Canada - Year-over-year growth 2024-2029 (%)

11.3.3 Mexico - Market size and forecast 2024-2029

Chart on Mexico - Market size and forecast 2024-2029 ($ million)
Data Table on Mexico - Market size and forecast 2024-2029 ($ million)
Chart on Mexico - Year-over-year growth 2024-2029 (%)
Data Table on Mexico - Year-over-year growth 2024-2029 (%)

11.4 APAC - Market size and forecast 2024-2029

Chart on APAC - Market size and forecast 2024-2029 ($ million)
Data Table on APAC - Market size and forecast 2024-2029 ($ million)
Chart on APAC - Year-over-year growth 2024-2029 (%)
Data Table on APAC - Year-over-year growth 2024-2029 (%)
Chart on Regional Comparison - APAC
Data Table on Regional Comparison - APAC

11.4.1 China - Market size and forecast 2024-2029

Chart on China - Market size and forecast 2024-2029 ($ million)
Data Table on China - Market size and forecast 2024-2029 ($ million)
Chart on China - Year-over-year growth 2024-2029 (%)
Data Table on China - Year-over-year growth 2024-2029 (%)

11.4.2 Japan - Market size and forecast 2024-2029

Chart on Japan - Market size and forecast 2024-2029 ($ million)
Data Table on Japan - Market size and forecast 2024-2029 ($ million)
Chart on Japan - Year-over-year growth 2024-2029 (%)
Data Table on Japan - Year-over-year growth 2024-2029 (%)

11.4.3 India - Market size and forecast 2024-2029

Chart on India - Market size and forecast 2024-2029 ($ million)
Data Table on India - Market size and forecast 2024-2029 ($ million)
Chart on India - Year-over-year growth 2024-2029 (%)
Data Table on India - Year-over-year growth 2024-2029 (%)

11.4.4 South Korea - Market size and forecast 2024-2029

Chart on South Korea - Market size and forecast 2024-2029 ($ million)
Data Table on South Korea - Market size and forecast 2024-2029 ($ million)
Chart on South Korea - Year-over-year growth 2024-2029 (%)
Data Table on South Korea - Year-over-year growth 2024-2029 (%)

11.4.5 Australia - Market size and forecast 2024-2029

Chart on Australia - Market size and forecast 2024-2029 ($ million)
Data Table on Australia - Market size and forecast 2024-2029 ($ million)
Chart on Australia - Year-over-year growth 2024-2029 (%)
Data Table on Australia - Year-over-year growth 2024-2029 (%)

11.4.6 Indonesia - Market size and forecast 2024-2029

Chart on Indonesia - Market size and forecast 2024-2029 ($ million)
Data Table on Indonesia - Market size and forecast 2024-2029 ($ million)
Chart on Indonesia - Year-over-year growth 2024-2029 (%)
Data Table on Indonesia - Year-over-year growth 2024-2029 (%)

11.5 Europe - Market size and forecast 2024-2029

Chart on Europe - Market size and forecast 2024-2029 ($ million)
Data Table on Europe - Market size and forecast 2024-2029 ($ million)
Chart on Europe - Year-over-year growth 2024-2029 (%)
Data Table on Europe - Year-over-year growth 2024-2029 (%)
Chart on Regional Comparison - Europe
Data Table on Regional Comparison - Europe

11.5.1 Germany - Market size and forecast 2024-2029

Chart on Germany - Market size and forecast 2024-2029 ($ million)
Data Table on Germany - Market size and forecast 2024-2029 ($ million)
Chart on Germany - Year-over-year growth 2024-2029 (%)
Data Table on Germany - Year-over-year growth 2024-2029 (%)

11.5.2 UK - Market size and forecast 2024-2029

Chart on UK - Market size and forecast 2024-2029 ($ million)
Data Table on UK - Market size and forecast 2024-2029 ($ million)
Chart on UK - Year-over-year growth 2024-2029 (%)
Data Table on UK - Year-over-year growth 2024-2029 (%)

11.5.3 France - Market size and forecast 2024-2029

Chart on France - Market size and forecast 2024-2029 ($ million)
Data Table on France - Market size and forecast 2024-2029 ($ million)
Chart on France - Year-over-year growth 2024-2029 (%)
Data Table on France - Year-over-year growth 2024-2029 (%)

11.5.4 Italy - Market size and forecast 2024-2029

Chart on Italy - Market size and forecast 2024-2029 ($ million)
Data Table on Italy - Market size and forecast 2024-2029 ($ million)
Chart on Italy - Year-over-year growth 2024-2029 (%)
Data Table on Italy - Year-over-year growth 2024-2029 (%)

11.5.5 The Netherlands - Market size and forecast 2024-2029

Chart on The Netherlands - Market size and forecast 2024-2029 ($ million)
Data Table on The Netherlands - Market size and forecast 2024-2029 ($ million)
Chart on The Netherlands - Year-over-year growth 2024-2029 (%)
Data Table on The Netherlands - Year-over-year growth 2024-2029 (%)

11.5.6 Spain - Market size and forecast 2024-2029

Chart on Spain - Market size and forecast 2024-2029 ($ million)
Data Table on Spain - Market size and forecast 2024-2029 ($ million)
Chart on Spain - Year-over-year growth 2024-2029 (%)
Data Table on Spain - Year-over-year growth 2024-2029 (%)

11.6 Middle East and Africa - Market size and forecast 2024-2029

Chart on Middle East and Africa - Market size and forecast 2024-2029 ($ million)
Data Table on Middle East and Africa - Market size and forecast 2024-2029 ($ million)
Chart on Middle East and Africa - Year-over-year growth 2024-2029 (%)
Data Table on Middle East and Africa - Year-over-year growth 2024-2029 (%)
Chart on Regional Comparison - Middle East and Africa
Data Table on Regional Comparison - Middle East and Africa

11.6.1 UAE - Market size and forecast 2024-2029

Chart on UAE - Market size and forecast 2024-2029 ($ million)
Data Table on UAE - Market size and forecast 2024-2029 ($ million)
Chart on UAE - Year-over-year growth 2024-2029 (%)
Data Table on UAE - Year-over-year growth 2024-2029 (%)

11.6.2 South Africa - Market size and forecast 2024-2029

Chart on South Africa - Market size and forecast 2024-2029 ($ million)
Data Table on South Africa - Market size and forecast 2024-2029 ($ million)
Chart on South Africa - Year-over-year growth 2024-2029 (%)
Data Table on South Africa - Year-over-year growth 2024-2029 (%)

11.6.3 Israel - Market size and forecast 2024-2029

Chart on Israel - Market size and forecast 2024-2029 ($ million)
Data Table on Israel - Market size and forecast 2024-2029 ($ million)
Chart on Israel - Year-over-year growth 2024-2029 (%)
Data Table on Israel - Year-over-year growth 2024-2029 (%)

11.6.4 Saudi Arabia - Market size and forecast 2024-2029

Chart on Saudi Arabia - Market size and forecast 2024-2029 ($ million)
Data Table on Saudi Arabia - Market size and forecast 2024-2029 ($ million)
Chart on Saudi Arabia - Year-over-year growth 2024-2029 (%)
Data Table on Saudi Arabia - Year-over-year growth 2024-2029 (%)

11.6.5 Turkey - Market size and forecast 2024-2029

Chart on Turkey - Market size and forecast 2024-2029 ($ million)
Data Table on Turkey - Market size and forecast 2024-2029 ($ million)
Chart on Turkey - Year-over-year growth 2024-2029 (%)
Data Table on Turkey - Year-over-year growth 2024-2029 (%)

11.7 South America - Market size and forecast 2024-2029

Chart on South America - Market size and forecast 2024-2029 ($ million)
Data Table on South America - Market size and forecast 2024-2029 ($ million)
Chart on South America - Year-over-year growth 2024-2029 (%)
Data Table on South America - Year-over-year growth 2024-2029 (%)
Chart on Regional Comparison - South America
Data Table on Regional Comparison - South America

11.7.1 Brazil - Market size and forecast 2024-2029

Chart on Brazil - Market size and forecast 2024-2029 ($ million)
Data Table on Brazil - Market size and forecast 2024-2029 ($ million)
Chart on Brazil - Year-over-year growth 2024-2029 (%)
Data Table on Brazil - Year-over-year growth 2024-2029 (%)

11.7.2 Argentina - Market size and forecast 2024-2029

Chart on Argentina - Market size and forecast 2024-2029 ($ million)
Data Table on Argentina - Market size and forecast 2024-2029 ($ million)
Chart on Argentina - Year-over-year growth 2024-2029 (%)
Data Table on Argentina - Year-over-year growth 2024-2029 (%)

11.7.3 Colombia - Market size and forecast 2024-2029

Chart on Colombia - Market size and forecast 2024-2029 ($ million)
Data Table on Colombia - Market size and forecast 2024-2029 ($ million)
Chart on Colombia - Year-over-year growth 2024-2029 (%)
Data Table on Colombia - Year-over-year growth 2024-2029 (%)

11.8 Market opportunity by geography

Market opportunity by geography ($ million)
Data Tables on Market opportunity by geography ($ million)

12. Drivers, Challenges, and Opportunity

12.1 Market drivers

Enhanced decision making and operational efficiency
Significant cost reduction and optimization
Improved supplier management and risk mitigation

12.2 Market challenges

Data security, privacy, and evolving regulatory landscapes
Implementation complexity and integration with legacy systems
Widening talent gap and shortage of AI-proficient professionals

12.3 Impact of drivers and challenges

Impact of drivers and challenges in 2024 and 2029

12.4 Market opportunities

Enhanced efficiency and cost reduction through automation
Proactive risk management and enhanced supply chain resilience
Strategic decision-making powered by data-driven insights

13. Competitive Landscape

13.1 Overview

13.2

Overview on criticality of inputs and factors of differentiation

13.3 Landscape disruption

Overview on factors of disruption

13.4 Industry risks

Impact of key risks on business

14. Competitive Analysis

14.1 Companies profiled

Companies covered

14.2 Company ranking index

14.3 Market positioning of companies

Matrix on companies position and classification

14.4 Basware Corp.

Basware Corp. - Overview
Basware Corp. - Product / Service
Basware Corp. - Key offerings
SWOT

14.5 Coupa Software Inc.

Coupa Software Inc. - Overview
Coupa Software Inc. - Product / Service
Coupa Software Inc. - Key offerings
SWOT

14.6 GEP

GEP - Overview
GEP - Product / Service
GEP - Key offerings
SWOT

14.7 H2O.ai Inc.

H2O.ai Inc. - Overview
H2O.ai Inc. - Product / Service
H2O.ai Inc. - Key offerings
SWOT

14.8 Intel Corp.

Intel Corp. - Overview
Intel Corp. - Business segments
Intel Corp. - Key news
Intel Corp. - Key offerings
Intel Corp. - Segment focus
SWOT

14.9 IBM Corp.

IBM Corp. - Overview
IBM Corp. - Business segments
IBM Corp. - Key news
IBM Corp. - Key offerings
IBM Corp. - Segment focus
SWOT

14.10 Ivalua Inc.

Ivalua Inc. - Overview
Ivalua Inc. - Product / Service
Ivalua Inc. - Key offerings
SWOT

14.11 Microsoft Corp.

Microsoft Corp. - Overview
Microsoft Corp. - Business segments
Microsoft Corp. - Key news
Microsoft Corp. - Key offerings
Microsoft Corp. - Segment focus
SWOT

14.12 NVIDIA Corp.

NVIDIA Corp. - Overview
NVIDIA Corp. - Business segments
NVIDIA Corp. - Key news
NVIDIA Corp. - Key offerings
NVIDIA Corp. - Segment focus
SWOT

14.13 Oracle Corp.

Oracle Corp. - Overview
Oracle Corp. - Business segments
Oracle Corp. - Key news
Oracle Corp. - Key offerings
Oracle Corp. - Segment focus
SWOT

14.14 Proactis Holdings plc

Proactis Holdings plc - Overview
Proactis Holdings plc - Product / Service
Proactis Holdings plc - Key offerings
SWOT

14.15 SAP SE

SAP SE - Overview
SAP SE - Business segments
SAP SE - Key news
SAP SE - Key offerings
SAP SE - Segment focus
SWOT

14.16 TradeShift Inc.

TradeShift Inc. - Overview
TradeShift Inc. - Product / Service
TradeShift Inc. - Key offerings
SWOT

14.17 Xeeva Inc.

Xeeva Inc. - Overview
Xeeva Inc. - Product / Service
Xeeva Inc. - Key offerings
SWOT

14.18 Zycus Inc.

Zycus Inc. - Overview
Zycus Inc. - Product / Service
Zycus Inc. - Key offerings
SWOT

15. Appendix

15.1 Scope of the report

Market definition
Objectives
Notes and caveats

15.2 Inclusions and exclusions checklist

Inclusions checklist
Exclusions checklist

15.3 Currency conversion rates for US$

15.4 Research methodology

15.5 Data procurement

Information sources

15.6 Data validation

15.7 Validation techniques employed for market sizing

15.8 Data synthesis

15.9 360 degree market analysis

15.10 List of abbreviations

Research Methodology

Technavio presents a detailed picture of the market by way of study, synthesis, and summation of data from multiple sources. The analysts have presented the various facets of the market with a particular focus on identifying the key industry influencers. The data thus presented is comprehensive, reliable, and the result of extensive research, both primary and secondary.

INFORMATION SOURCES

Primary sources

  • Manufacturers and suppliers
  • Channel partners
  • Industry experts
  • Strategic decision makers

Secondary sources

  • Industry journals and periodicals
  • Government data
  • Financial reports of key industry players
  • Historical data
  • Press releases

DATA ANALYSIS

Data Synthesis

  • Collation of data
  • Estimation of key figures
  • Analysis of derived insights

Data Validation

  • Triangulation with data models
  • Reference against proprietary databases
  • Corroboration with industry experts

REPORT WRITING

Qualitative

  • Market drivers
  • Market challenges
  • Market trends
  • Five forces analysis

Quantitative

  • Market size and forecast
  • Market segmentation
  • Geographical insights
  • Competitive landscape

Interested in this report?

Get your sample now to see our research methodology and insights!

Download Now

Frequently Asked Questions

AI In Procurement market growth will increase by USD 5865.4 million during 2025-2029.

The AI In Procurement market is expected to grow at a CAGR of 27.9% during 2025-2029.

AI In Procurement market is segmented by Component (Software, Services) End-user (Manufacturing, Retail and e-commerce, Healthcare, Transportation and logistics, Others) Technology (Machine learning, Natural language processing, Predictive analytics, Computer vision, Robotic process automation)

Basware Corp., Clarifai Inc., Coupa Software Inc., GEP, H2O.ai Inc., Intel Corp., IBM Corp., Ivalua Inc., JAGGAER LLC, Microsoft Corp., NVIDIA Corp., Oracle Corp., Proactis Holdings plc, SAP SE, TradeShift Inc., Xeeva Inc., Zebra Technologies Corp., Zycus Inc. are a few of the key vendors in the AI In Procurement market.

North America will register the highest growth rate of 35.9% among the other regions. Therefore, the AI In Procurement market in North America is expected to garner significant business opportunities for the vendors during the forecast period.

US, Canada, Mexico, China, Japan, India, South Korea, Australia, Indonesia, Germany, UK, France, Italy, The Netherlands, Spain, UAE, South Africa, Israel, Saudi Arabia, Turkey, Brazil, Argentina, Colombia

  • Enhanced decision making and operational efficiency is the driving factor this market.

The AI In Procurement market vendors should focus on grabbing business opportunities from the Component segment as it accounted for the largest market share in the base year.