
AI In Real-time Analytics Market Size 2025-2029
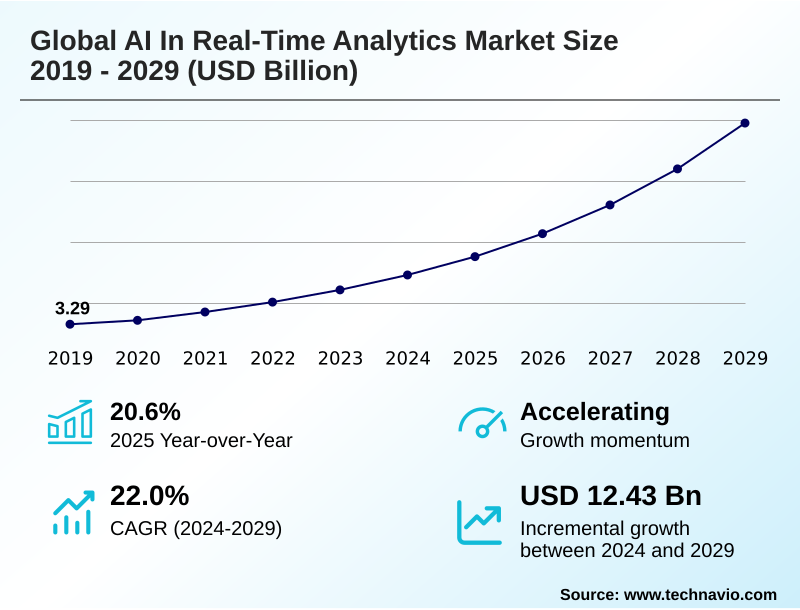
The ai in real-time analytics market size is valued to increase by USD 12.43 billion, at a CAGR of 22% from 2024 to 2029. Exponential growth of big data and proliferation of IoT devices will drive the ai in real-time analytics market.
Major Market Trends & Insights
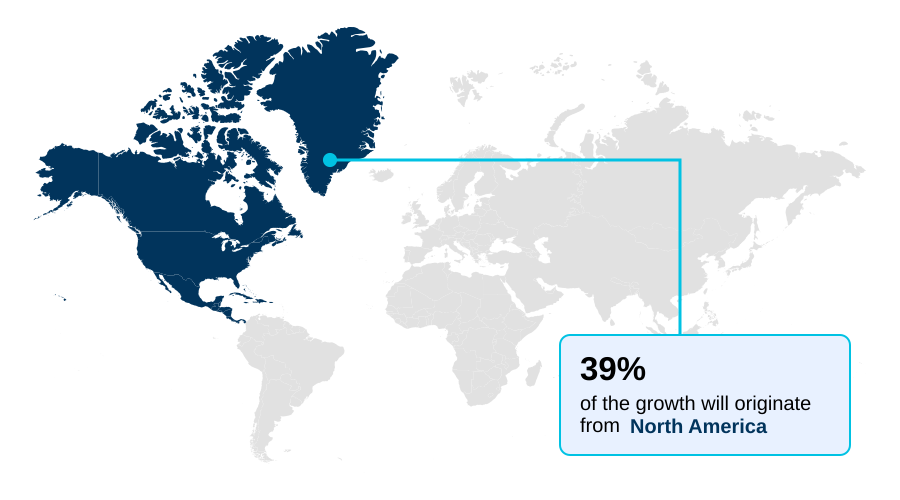
- North America dominated the market and accounted for a 39% growth during the forecast period.
- By Component - Solutions segment was valued at USD 3.82 billion in 2023
- By Deployment - Hybrid segment accounted for the largest market revenue share in 2023
Market Size & Forecast
- Market Opportunities: USD 16.45 billion
- Market Future Opportunities: USD 12.43 billion
- CAGR from 2024 to 2029 : 22%
Market Summary
- The AI in real-time analytics market is defined by a fundamental shift from historical batch processing to instantaneous, data-driven operational intelligence. This evolution is propelled by the massive influx of information from IoT devices and digital interactions, creating a need for systems that can provide immediate, actionable insights.
- Organizations are leveraging these capabilities for critical functions such as dynamic supply chain optimization, where real-time data analysis allows for immediate rerouting and inventory adjustments to mitigate disruptions. The integration of generative AI is making these tools more accessible through conversational interfaces, while the adoption of edge AI enables processing closer to the data source for minimal delay.
- However, this increased reliance on live data processing also introduces significant challenges related to data governance and security, demanding robust frameworks to ensure both compliance and trust in automated decision-making processes across various industries.
What will be the Size of the AI In Real-time Analytics Market during the forecast period?
Get Key Insights on Market Forecast (PDF) Get Free Sample
How is the AI In Real-time Analytics Market Segmented?
The ai in real-time analytics industry research report provides comprehensive data (region-wise segment analysis), with forecasts and estimates in "USD million" for the period 2025-2029, as well as historical data from 2019-2023 for the following segments.
- Component
- Solutions
- Services
- Deployment
- Hybrid
- Cloud-based
- On-premises
- Application
- Fraud detection and risk management
- Customer experience and personalization
- Predictive maintenance and asset monitoring
- Healthcare and patient monitoring
- Others
- Geography
- North America
- US
- Canada
- Mexico
- APAC
- China
- Japan
- India
- Europe
- Germany
- UK
- France
- Middle East and Africa
- Saudi Arabia
- UAE
- South Africa
- South America
- Brazil
- Argentina
- Colombia
- Rest of World (ROW)
- North America
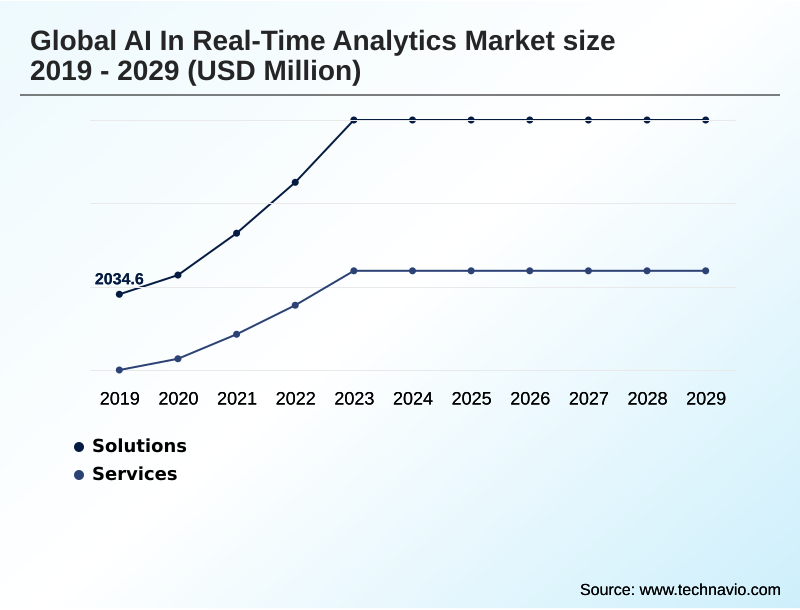
By Component Insights
The solutions segment is estimated to witness significant growth during the forecast period.
The solutions segment is the technological foundation for the AI in real-time analytics market, comprising real-time analytics platforms built on robust streaming data infrastructure. These systems leverage techniques like streaming analytics and complex event processing for real-time data processing.
The demand for such predictive analytics solutions is driven by the need for AI-driven decision making across industries. Applications range from industrial predictive maintenance to systems using sophisticated fraud detection models.
Integrating machine learning algorithms is critical, with sectors like finance relying on it for high-speed trading; for instance, a high percentage of equity market trades are now executed via algorithmic models.
The expansion of edge AI processing is also shaping the segment, pushing more analytical capabilities to the network periphery to support immediate action.
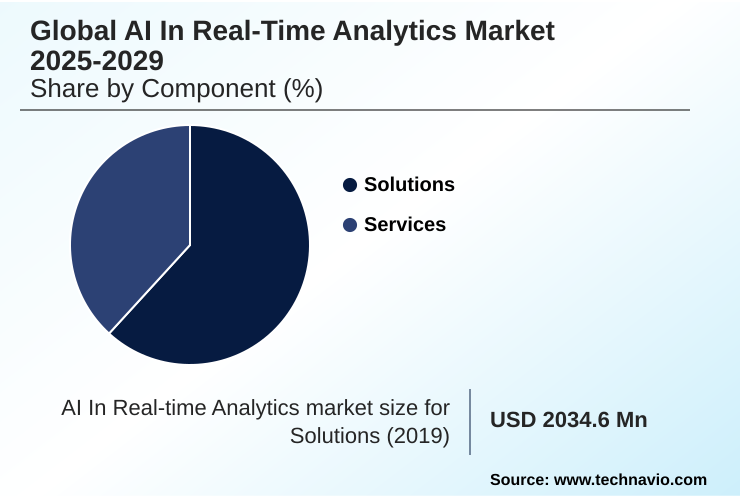
The Solutions segment was valued at USD 3.82 billion in 2023 and showed a gradual increase during the forecast period.
Regional Analysis
North America is estimated to contribute 39% to the growth of the global market during the forecast period.Technavio’s analysts have elaborately explained the regional trends and drivers that shape the market during the forecast period.
See How AI In Real-time Analytics Market Demand is Rising in North America Get Free Sample
The geographic landscape for AI in real-time analytics is diverse. North America leads with a 39% share of incremental growth, driven by mature infrastructure supporting sophisticated deep learning models and multimodal data analysis.
APAC, however, is the fastest-growing region at 23.3%, fueled by digitalization and government-led initiatives focused on AI in supply chain optimization.
Europe's market is uniquely shaped by its regulatory focus, creating strong demand for XAI compliance frameworks and explainable AI (XAI) to ensure transparency in customer behavior analytics.
This emphasis is promoting the adoption of generative BI tools and cloud-based analytics services that facilitate data stream analysis with natural language processing while adhering to strict governance.
Market Dynamics
Our researchers analyzed the data with 2024 as the base year, along with the key drivers, trends, and challenges. A holistic analysis of drivers will help companies refine their marketing strategies to gain a competitive advantage.
- Navigating the AI in real-time analytics market requires strategic choices, starting with the foundational decision between cloud vs on-premise AI analytics. The benefits of hybrid cloud analytics offer a balanced approach for many.
- In high-stakes industries, the focus is often on specialized applications like real-time analytics for fraud detection, where deep learning for stock trading and other algorithmic trading with AI models are becoming standard. Meanwhile, consumer-facing sectors prioritize understanding how AI improves customer experience, using generative AI for customer personalization.
- Technologically, success hinges on robust MLOps for streaming data models to manage real-time analytics for IoT data effectively. The rise of NLP for conversational BI platforms is democratizing access to insights. Operationally, companies are optimizing logistics with real-time AI and implementing AIOps for IT infrastructure to enhance efficiency, with some achieving gains more than double those of legacy systems.
- As these systems become more autonomous, building trustworthy AI with XAI is critical for regulatory compliance and addressing the challenges of real-time data privacy. This is especially true for sensitive applications such as real-time patient data analysis and AI-powered predictive asset monitoring.
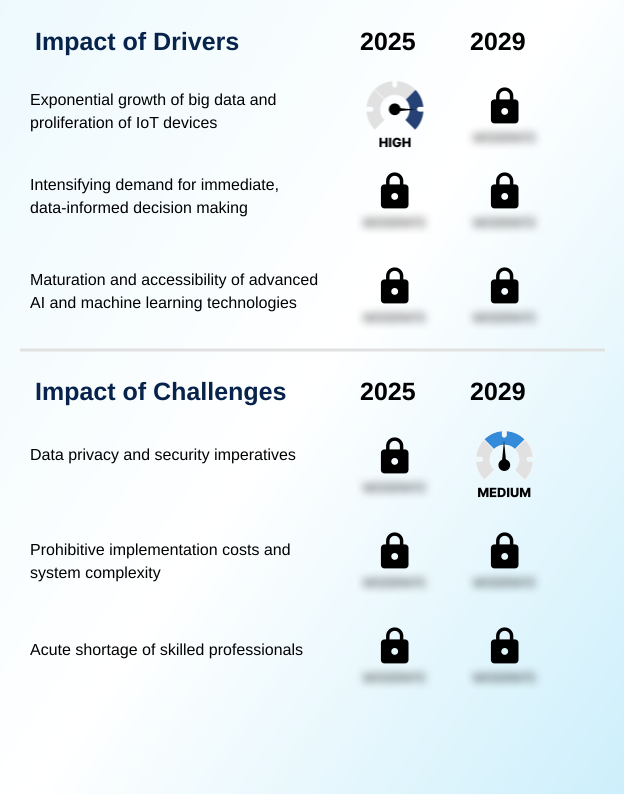
What are the key market drivers leading to the rise in the adoption of AI In Real-time Analytics Industry?
- The exponential growth of big data, fueled by the proliferation of IoT devices, is a key driver for the AI in real-time analytics market.
- Market growth is propelled by the demand for immediate, AI-driven insights from massive data volumes. The expansion of IoT data analytics generates continuous information streams, making advanced stream processing essential.
- This has led to the adoption of AIOps platforms for IT monitoring and dynamic pricing engines in retail. In finance, the imperative for real-time risk management is fueling the use of sophisticated algorithmic trading systems and behavioral biometrics for security.
- This move toward instantaneous decision-making is also seen in healthcare with real-time patient monitoring. The maturation of machine learning operations is making these powerful capabilities more accessible, enabling organizations to transform raw data into actionable intelligence without delay.
What are the market trends shaping the AI In Real-time Analytics Industry?
- The proliferation of edge AI for real-time analytics is an emerging market trend. This involves processing data locally on devices, enabling immediate decision-making with minimal latency.
- Key trends are redefining the market. The adoption of hybrid cloud architecture is enabling flexible on-premises AI deployment combined with cloud scalability. This supports the proliferation of edge AI, which facilitates immediate data processing locally. Concurrently, generative AI integration is transforming user interaction through conversational analytics and automated insight generation. This is making deep learning for forecasting more accessible.
- The critical need for transparency is driving the adoption of robust data governance frameworks and explainable AI, with projections showing 50% of large European firms will invest in compliance. Furthermore, mature MLOps for real-time AI practices are crucial for managing intelligent automation and multimodal data analysis pipelines.
What challenges does the AI In Real-time Analytics Industry face during its growth?
- Data privacy and security imperatives represent a key challenge affecting the growth of the AI in real-time analytics industry.
- Significant challenges temper market expansion. Ensuring data privacy during low-latency data processing is a primary concern, complicating deployments in sectors like AI in financial services. The high cost and complexity of implementation, coupled with the need for rigorous AI model lifecycle management, present a formidable barrier, with nearly 60% of CIOs reporting budget shortfalls.
- A critical shortage of talent skilled in time-series analysis, sentiment analysis, and computer vision analytics further inflates costs and delays projects. This skills gap hinders the effective use of AI-enhanced BI solutions and the development of sophisticated real-time marketing automation and AI-powered chatbots, limiting the potential ROI for many organizations.
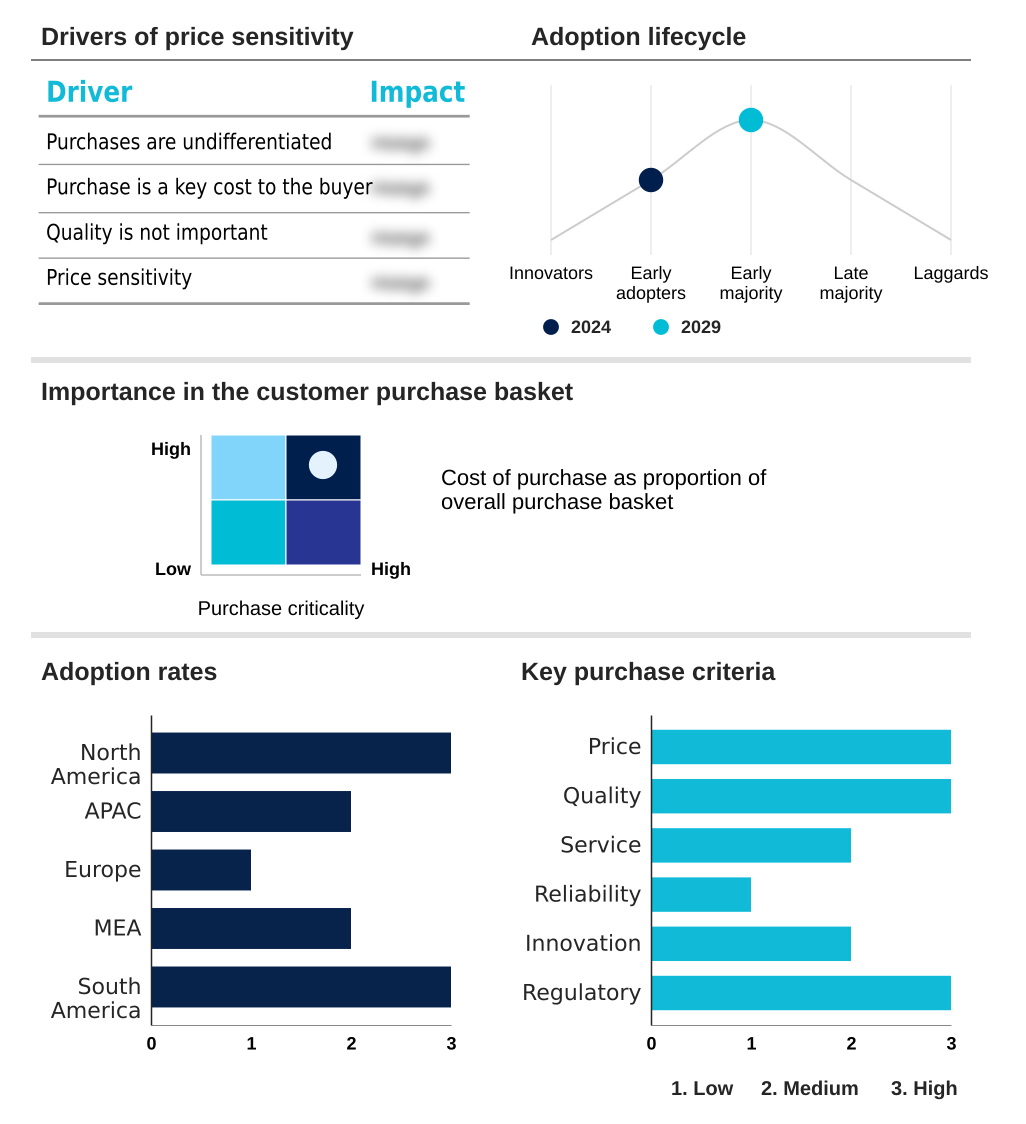
Exclusive Technavio Analysis on Customer Landscape
The ai in real-time analytics market forecasting report includes the adoption lifecycle of the market, covering from the innovator’s stage to the laggard’s stage. It focuses on adoption rates in different regions based on penetration. Furthermore, the ai in real-time analytics market report also includes key purchase criteria and drivers of price sensitivity to help companies evaluate and develop their market growth analysis strategies.
Customer Landscape of AI In Real-time Analytics Industry
Competitive Landscape
Companies are implementing various strategies, such as strategic alliances, ai in real-time analytics market forecast, partnerships, mergers and acquisitions, geographical expansion, and product/service launches, to enhance their presence in the industry.
Alibaba Group Holding Ltd. - Enables live data processing, predictive forecasting, and interactive visualization through an integrated suite of real-time analytics and AI services supporting scalable, data-driven decision-making.
The industry research and growth report includes detailed analyses of the competitive landscape of the market and information about key companies, including:
- Alibaba Group Holding Ltd.
- Amazon Web Services Inc.
- Anaconda Inc.
- C3.ai Inc.
- Capgemini Service SAS
- Cloudera Inc.
- Google LLC
- Hewlett Packard
- Infosys Ltd.
- IBM Corp.
- Microsoft Corp.
- NVIDIA Corp.
- Oracle Corp.
- Palantir Technologies Inc.
- Salesforce Inc.
- SAP SE
- SAS Institute Inc.
- Snowflake Inc.
- Splunk Inc.
- Wipro Ltd.
Qualitative and quantitative analysis of companies has been conducted to help clients understand the wider business environment as well as the strengths and weaknesses of key industry players. Data is qualitatively analyzed to categorize companies as pure play, category-focused, industry-focused, and diversified; it is quantitatively analyzed to categorize companies as dominant, leading, strong, tentative, and weak.
Recent Development and News in Ai in real-time analytics market
- In March 2025, Latent AI and Carahsoft Technology Corp. formed a partnership to enhance the adoption of edge AI solutions within the U.S. public sector.
- In February 2025, BioIntelliSense and care.ai partnered to integrate continuous biometric data with ambient intelligent monitoring for comprehensive patient health tracking.
- In early 2025, the European Union's AI Act began its phased application, establishing risk-based categories and compliance requirements for AI systems, including those used for real-time analytics.
- In May 2025, the United States government introduced the American AI Action Plan, a strategic initiative designed to accelerate innovation and expand national AI infrastructure.
Dive into Technavio’s robust research methodology, blending expert interviews, extensive data synthesis, and validated models for unparalleled AI In Real-time Analytics Market insights. See full methodology.
| Market Scope | |
|---|---|
| Page number | 305 |
| Base year | 2024 |
| Historic period | 2019-2023 |
| Forecast period | 2025-2029 |
| Growth momentum & CAGR | Accelerate at a CAGR of 22% |
| Market growth 2025-2029 | USD 12431.2 million |
| Market structure | Fragmented |
| YoY growth 2024-2025(%) | 20.6% |
| Key countries | US, Canada, Mexico, China, Japan, India, South Korea, Australia, Indonesia, Germany, UK, France, Italy, The Netherlands, Spain, Saudi Arabia, UAE, South Africa, Israel, Turkey, Brazil, Argentina and Colombia |
| Competitive landscape | Leading Companies, Market Positioning of Companies, Competitive Strategies, and Industry Risks |
Research Analyst Overview
- The AI in real-time analytics market is characterized by rapid innovation, where the ability to perform real-time data processing is becoming a core enterprise competency. Platforms are evolving to incorporate sophisticated machine learning algorithms and deep learning models for advanced predictive forecasting and real-time anomaly detection.
- The integration of generative AI integration and conversational analytics is a key trend, influencing boardroom decisions on technology budgeting as it promises to democratize data access. This shift is evident in applications ranging from industrial predictive maintenance and algorithmic trading systems to highly personalized customer journey personalization using sentiment analysis.
- In one documented case, a retailer's use of these technologies for dynamic pricing engines boosted sales by 15%. This underscores the tangible ROI driving adoption. Successful deployment, however, depends on robust data governance frameworks, effective MLOps for real-time AI, and a focus on explainable AI (XAI) to ensure trust and compliance.
What are the Key Data Covered in this AI In Real-time Analytics Market Research and Growth Report?
-
What is the expected growth of the AI In Real-time Analytics Market between 2025 and 2029?
-
USD 12.43 billion, at a CAGR of 22%
-
-
What segmentation does the market report cover?
-
The report is segmented by Component (Solutions, and Services), Deployment (Hybrid, Cloud-based, and On-Premises), Application (Fraud Detection and Risk Management, Customer Experience and Personalization, Predictive Maintenance and Asset Monitoring, Healthcare and Patient Monitoring, and Others) and Geography (North America, APAC, Europe, Middle East and Africa, South America)
-
-
Which regions are analyzed in the report?
-
North America, APAC, Europe, Middle East and Africa and South America
-
-
What are the key growth drivers and market challenges?
-
Exponential growth of big data and proliferation of IoT devices, Data privacy and security imperatives
-
-
Who are the major players in the AI In Real-time Analytics Market?
-
Alibaba Group Holding Ltd., Amazon Web Services Inc., Anaconda Inc., C3.ai Inc., Capgemini Service SAS, Cloudera Inc., Google LLC, Hewlett Packard, Infosys Ltd., IBM Corp., Microsoft Corp., NVIDIA Corp., Oracle Corp., Palantir Technologies Inc., Salesforce Inc., SAP SE, SAS Institute Inc., Snowflake Inc., Splunk Inc. and Wipro Ltd.
-
Market Research Insights
- The dynamics of the AI in real-time analytics market are shaped by the critical need for immediate, data-driven insights. Approximately 70% of organizations now classify real-time data as vital to their operations, moving beyond intuition-based decisions. This is evident in retail, where AI-enhanced BI solutions have boosted sales by as much as 15% through dynamic pricing and personalized recommendations.
- The adoption of AI-powered personalization engines and other predictive analytics solutions enables businesses to react swiftly to changing customer behaviors and market trends. The imperative for speed and accuracy in functions like real-time risk assessment is transforming this technology from a niche advantage into a core business necessity, driving significant investment and innovation.
We can help! Our analysts can customize this ai in real-time analytics market research report to meet your requirements.
 RIA -
RIA - 
