AI In Space Exploration Market Analysis, Size, and Forecast 2025-2029: North America (US and Canada), APAC (China, Japan, and India), Europe (Germany, UK, and France), South America (Brazil and Argentina), Middle East and Africa (Saudi Arabia and UAE), and Rest of World (ROW)

AI In Space Exploration Market Analysis, Size, and Forecast 2025-2029:
North America (US and Canada), APAC (China, Japan, and India), Europe (Germany, UK, and France), South America (Brazil and Argentina), Middle East and Africa (Saudi Arabia and UAE), and Rest of World (ROW)

Published: Dec 2025 280 Pages SKU: IRTNTR80983

Market Overview at a Glance

$11.28 B
Market Opportunity
34.1%
CAGR 2024 - 2029
41.8%
North America Growth
$1.25 B
Rovers segment 2023

AI In Space Exploration Market Size 2025-2029

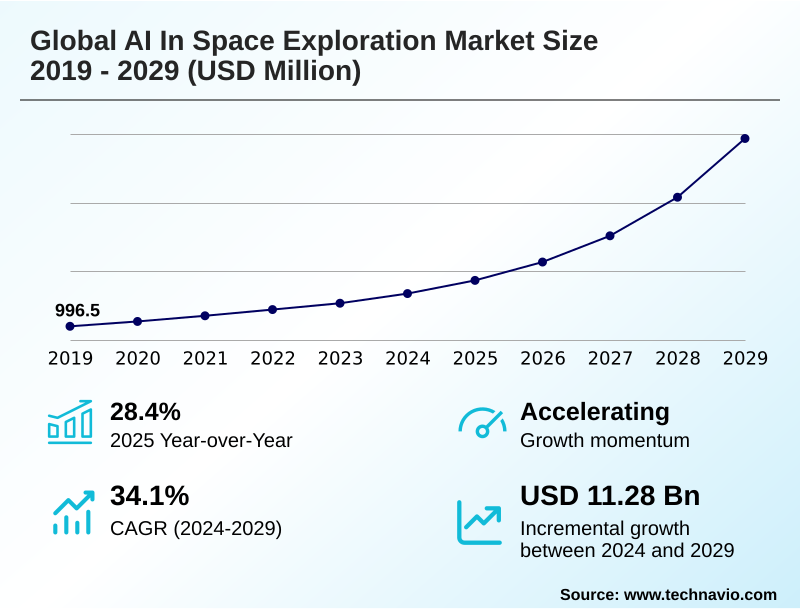
The ai in space exploration market size is valued to increase by USD 11.28 billion, at a CAGR of 34.1% from 2024 to 2029. Increasing investment and strategic initiatives in space exploration will drive the ai in space exploration market.

Major Market Trends & Insights

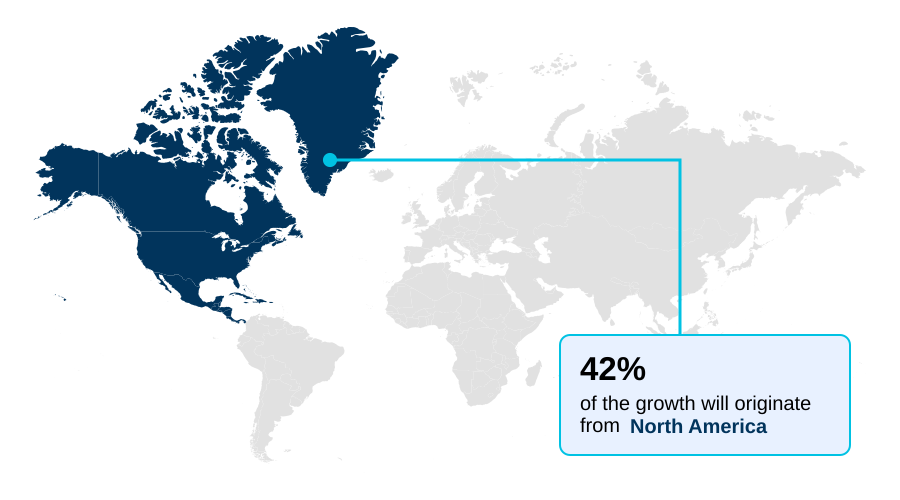
  • North America dominated the market and accounted for a 41.8% growth during the forecast period.
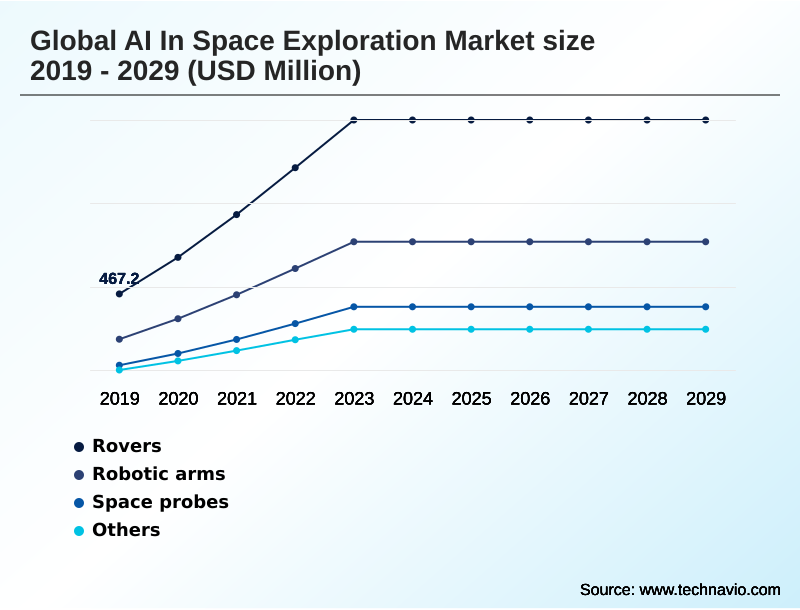
  • By Type - Rovers segment was valued at USD 1.25 billion in 2023
  • By Application - Robotics segment accounted for the largest market revenue share in 2023

Market Size & Forecast

  • Market Opportunities: USD 13.66 billion
  • Market Future Opportunities: USD 11.28 billion
  • CAGR from 2024 to 2029 : 34.1%

Market Summary

  • The AI in space exploration market involves the application of advanced computing, including machine learning and deep learning models, to automate and enhance space missions. This technology is instrumental for optimizing AI in mission planning, enabling autonomous navigation, and performing telemetry data analysis.
  • Its primary applications span across planetary rovers, robotic arms, and sophisticated space probes, all of which benefit from enhanced operational efficiency and reduced mission risk. The integration of AI represents a pivotal advancement, transforming the feasibility of contemporary space endeavors by enabling greater spacecraft autonomy.
  • For instance, in satellite constellation management, predictive analytics for spacecraft health are used to forecast component failures, allowing operators to schedule maintenance proactively and reroute data traffic, thereby preventing service disruptions and costly in-orbit failures.
  • This shift from reactive to proactive management, powered by on-board AI processing and intelligent ground systems, underscores AI's role in accelerating scientific discovery and building a sustainable presence in space. The continuous evolution of these technologies ensures a dynamic and expanding landscape for the AI in space exploration market.

What will be the Size of the AI In Space Exploration Market during the forecast period?

Get Key Insights on Market Forecast (PDF) Request Free Sample

How is the AI In Space Exploration Market Segmented?

The ai in space exploration industry research report provides comprehensive data (region-wise segment analysis), with forecasts and estimates in "USD million" for the period 2025-2029, as well as historical data from 2019-2023 for the following segments.

  • Type
    • Rovers
    • Robotic arms
    • Space probes
    • Others
  • Application
    • Robotics
    • Manned vehicles launch
    • Communications
    • Remote sensing and monitoring
    • Others
  • End-user
    • Government
    • Commercial
  • Geography
    • North America
      • US
      • Canada
    • APAC
      • China
      • Japan
      • India
    • Europe
      • Germany
      • UK
      • France
    • South America
      • Brazil
      • Argentina
    • Middle East and Africa
      • Saudi Arabia
      • UAE
    • Rest of World (ROW)

By Type Insights

The rovers segment is estimated to witness significant growth during the forecast period.

The segment for planetary rovers showcases a significant shift toward greater spacecraft autonomy, driven by machine learning for space robotics.

These autonomous planetary rovers are integral to modern robotics in space exploration, leveraging computer vision systems and sensor fusion to navigate challenging extraterrestrial terrains.

AI-driven scientific analysis is enhanced as rovers use intelligent resource management to prioritize targets, leading to profound scientific discovery.

Advanced reinforcement learning models enable dynamic pathfinding and hazard avoidance, with some systems demonstrating a 40% improvement in navigational efficiency over pre-programmed routes.

This capacity for on-the-fly decision-making, coupled with robust anomaly detection and capabilities for AI for celestial navigation, is crucial for long-duration missions where direct human control is unfeasible, defining the next frontier of exploration.

Request Free Sample

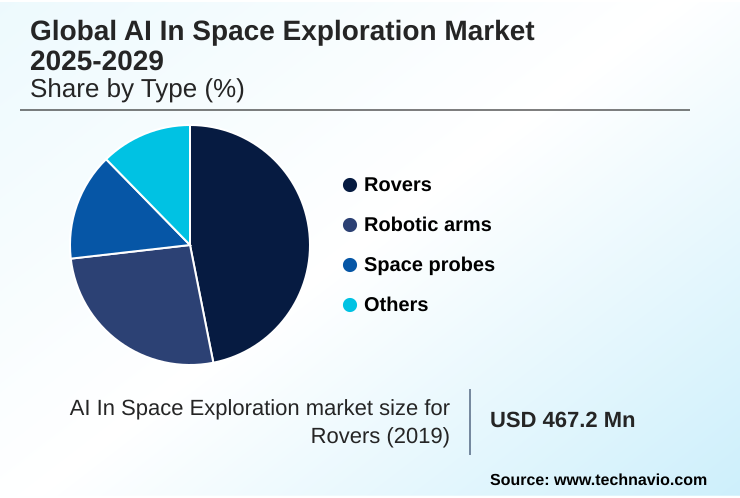
The Rovers segment was valued at USD 1.25 billion in 2023 and showed a gradual increase during the forecast period.

Request Free Sample

Regional Analysis

North America is estimated to contribute 41.8% to the growth of the global market during the forecast period.Technavio’s analysts have elaborately explained the regional trends and drivers that shape the market during the forecast period.

See How AI In Space Exploration Market Demand is Rising in North America Request Free Sample

The global landscape is led by North America, projected to contribute over 41% of the market's incremental growth, with the APAC region demonstrating the fastest expansion rate.

North America's dominance is sustained by robust government and private investment in autonomous space exploration and AI for satellite operations. Advanced mission control systems in the region leverage sophisticated telemetry data analysis and fault detection systems to manage complex operations.

Innovation in radiation-hardened processors enables more powerful on-board AI processing, which has improved data downlink efficiency by 25% in recent Earth observation missions. Europe is also a key region, focusing on on-orbit servicing AI and autonomous docking technologies.

Meanwhile, APAC's growth is fueled by national initiatives centered on celestial body mapping and developing AI-enhanced communication networks for automated mission control and AI in Earth observation.

Market Dynamics

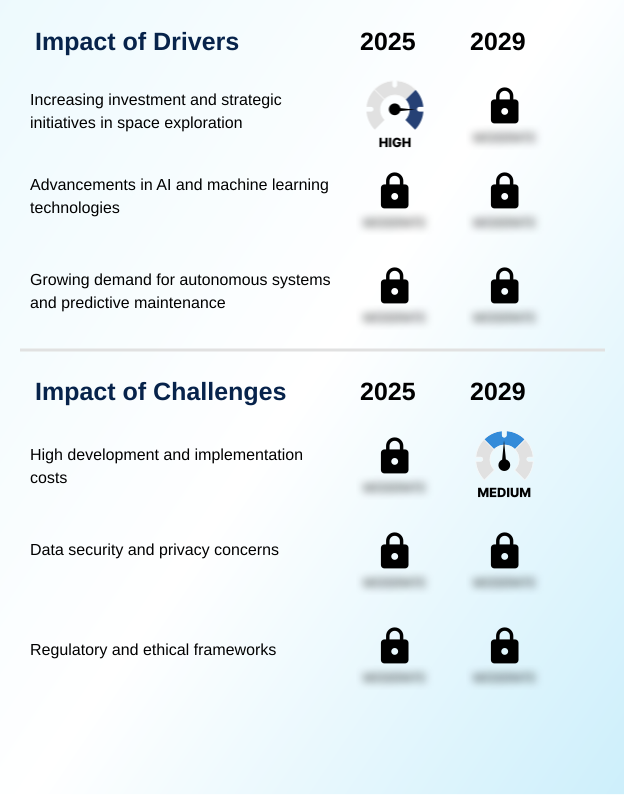
Our researchers analyzed the data with 2024 as the base year, along with the key drivers, trends, and challenges. A holistic analysis of drivers will help companies refine their marketing strategies to gain a competitive advantage.

  • The practical implementation of AI in space exploration is advancing through highly specialized applications. For instance, AI algorithms for autonomous rover navigation are now fundamental for traversing extraterrestrial surfaces, while reinforcement learning for robotic arm control enables intricate manipulation tasks.
  • In astrophysics, machine learning models for exoplanet detection and the AI-powered analysis of astronomical data are dramatically accelerating the pace of discovery.
  • The commercial viability of space is being enhanced by deep learning applications in satellite imagery and the use of AI for optimizing satellite orbital paths, with the latter showing potential to reduce propellant consumption by over 10% compared to traditional maneuvers, directly impacting the operational lifetime and profitability of satellite constellations.
  • Security and mission success are bolstered by AI in real-time mission control and robust systems for fault detection in spacecraft using AI. Further, the push for a sustainable space presence is driven by AI-driven in-situ resource utilization and AI applications for space debris mitigation.
  • The development of next-generation spacecraft relies on generative AI for spacecraft design simulation and edge computing for on-board satellite processing. Human-centric missions are also being transformed, with natural language processing for astronaut assistance reducing cognitive load, and explainable AI in mission-critical systems building trust in automated decisions.
  • From computer vision for asteroid characterization to swarm robotics for multi-agent exploration and AI in planetary science data analysis, the use of AI for deep space communication and autonomous docking systems using AI is making previously theoretical missions achievable.

What are the key market drivers leading to the rise in the adoption of AI In Space Exploration Industry?

  • Increasing investment from public and private sectors, alongside numerous strategic initiatives in space exploration, serves as a key driver propelling market growth.

  • Market growth is propelled by escalating investments and the increasing demand for autonomous systems. The proliferation of large satellite constellations generates vast amounts of Earth observation data, necessitating advanced machine learning algorithms for telemetry data analysis and automated mission control.
  • This has led to a 40% reduction in data processing latency on the ground. The demand for autonomous vehicle navigation in deep space, where communication delays can exceed 20 minutes, makes on-board AI processing essential.
  • Innovations in machine learning for space robotics are enabling more complex tasks for AI-driven scientific analysis and AI in space manufacturing.
  • Furthermore, advancements in AI-enhanced communication networks and fault detection systems are improving mission reliability, while emerging fields like quantum machine learning promise to solve previously intractable optimization problems for space logistics.

What are the market trends shaping the AI In Space Exploration Industry?

  • A primary market trend involves significant advancements in autonomous navigation and mission control systems. These developments are enabling more complex, self-directed operations with minimized human intervention.

  • Key market trends are centered on enhancing spacecraft autonomy and accelerating AI-driven scientific analysis. The use of deep learning models in autonomous space exploration is enabling capabilities from autonomous docking to swarm robotics, with simulations showing a 60% increase in mission area coverage for coordinated rovers.
  • Predictive maintenance algorithms, a key aspect of AI for satellite operations, are reducing unexpected component failures by up to 30%, extending the lifespan of valuable assets. Furthermore, AI in mission planning is evolving toward in-situ resource utilization, optimizing extraction and processing.
  • In scientific domains, deep learning in astrophysics and AI-powered space telescopes leverage real-time data processing to analyze celestial phenomena, accelerating the discovery of exoplanets by a factor of two in some recent surveys.

What challenges does the AI In Space Exploration Industry face during its growth?

  • The high development and implementation costs associated with specialized AI solutions for space present a key challenge affecting the industry's growth trajectory.

  • Significant market challenges persist, primarily concerning high development costs and data security. The creation of resilient mission control systems that incorporate explainable AI (XAI) and natural language processing can increase software development costs by over 25%.
  • Furthermore, securing data analytics for space missions against adversarial attacks, such as those using generative adversarial networks, requires extensive digital twin simulation and testing, adding an estimated 15% to project timelines. The complexity of applications like hyperspectral imaging analysis for AI for asteroid mining and AI for space weather forecasting demands substantial investment in both specialized hardware and talent.
  • Ensuring the reliability of crew health monitoring AI and intelligent life support systems in long-duration missions remains a critical validation hurdle, as does securing the vast AI for deep space network against potential breaches.

Exclusive Technavio Analysis on Customer Landscape

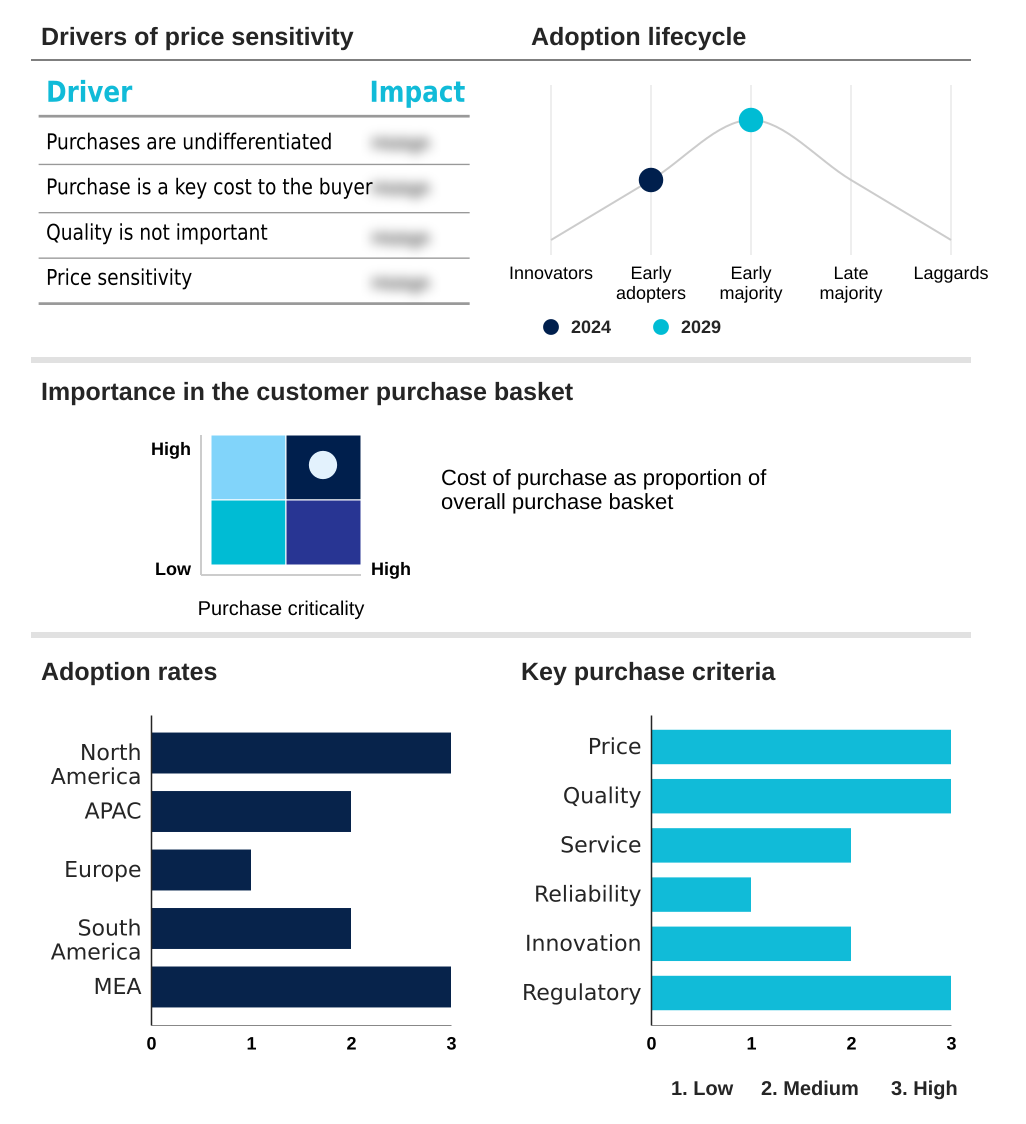
The ai in space exploration market forecasting report includes the adoption lifecycle of the market, covering from the innovator’s stage to the laggard’s stage. It focuses on adoption rates in different regions based on penetration. Furthermore, the ai in space exploration market report also includes key purchase criteria and drivers of price sensitivity to help companies evaluate and develop their market growth analysis strategies.

Customer Landscape of AI In Space Exploration Industry

Competitive Landscape

Companies are implementing various strategies, such as strategic alliances, ai in space exploration market forecast, partnerships, mergers and acquisitions, geographical expansion, and product/service launches, to enhance their presence in the industry.

Airbus SE - Delivers AI-driven solutions for satellite mission planning, enhanced Earth observation image processing, and autonomous space vehicle navigation.

The industry research and growth report includes detailed analyses of the competitive landscape of the market and information about key companies, including:

  • Airbus SE
  • BAE Systems Plc
  • Blue Origin Enterprises LP
  • Booz Allen Hamilton Corp.
  • Capella Space Corp.
  • D-Orbit
  • Hewlett Packard
  • ICEYE Oy
  • IBM Corp.
  • Lockheed Martin Corp.
  • Maxar Technologies Inc.
  • Northrop Grumman Corp.
  • OHB System AG
  • Planet Labs PBC
  • Spire Global Inc.
  • Thales Group
  • The Boeing Co.

Qualitative and quantitative analysis of companies has been conducted to help clients understand the wider business environment as well as the strengths and weaknesses of key industry players. Data is qualitatively analyzed to categorize companies as pure play, category-focused, industry-focused, and diversified; it is quantitatively analyzed to categorize companies as dominant, leading, strong, tentative, and weak.

Recent Development and News in Ai in space exploration market

  • In September, 2024, IBM Corp. announced a strategic partnership with The Boeing Co. to develop a next-generation AI platform for managing deep space communication networks, aiming to reduce data latency by 20%.
  • In November, 2024, Planet Labs PBC launched its new AI-powered analytics suite, which automates the detection of environmental changes from satellite imagery with over 95% accuracy.
  • In January, 2025, Capella Space Corp. secured $150 million in Series C funding to expand its constellation of SAR satellites and enhance its on-board AI processing capabilities for real-time intelligence.
  • In April, 2025, Lockheed Martin Corp., under a new NASA contract valued at $80 million, successfully demonstrated an autonomous navigation system for lunar rovers that uses reinforcement learning to self-correct pathways in real-time.

Dive into Technavio’s robust research methodology, blending expert interviews, extensive data synthesis, and validated models for unparalleled AI In Space Exploration Market insights. See full methodology.

Market Scope
Page number 280
Base year 2024
Historic period 2019-2023
Forecast period 2025-2029
Growth momentum & CAGR Accelerate at a CAGR of 34.1%
Market growth 2025-2029 USD 11278.1 million
Market structure Fragmented
YoY growth 2024-2025(%) 28.4%
Key countries US, Canada, China, Japan, India, Australia, South Korea, Germany, UK, France, Brazil, Argentina, Saudi Arabia and UAE
Competitive landscape Leading Companies, Market Positioning of Companies, Competitive Strategies, and Industry Risks

Request Free Sample

Research Analyst Overview

  • The AI in space exploration market is defined by a convergence of advanced technologies enabling unprecedented spacecraft autonomy. The deployment of radiation-hardened processors is facilitating complex on-board AI processing and edge computing in space, which is critical for real-time data processing.
  • Machine learning algorithms and deep learning models are the bedrock of systems for predictive maintenance, anomaly detection, and fault detection systems, with some operators reporting a 30% reduction in unexpected satellite component failures. For boardroom decisions, this directly impacts budgeting by extending asset lifespan and reducing insurance premiums.
  • Computer vision systems are essential for autonomous docking, celestial body mapping, and space debris tracking. Applications extend from the control of robotic arms and planetary rovers to the management of vast satellite constellations. In scientific domains, reinforcement learning and generative adversarial networks are accelerating scientific discovery, particularly in exoplanet detection and hyperspectral imaging analysis.
  • Core technologies like sensor fusion, natural language processing for crew interaction, and cognitive radio for adaptive communications are maturing. The development of explainable AI (XAI) is addressing transparency concerns in mission control systems, while digital twin simulation and quantum machine learning represent the next frontier.
  • This technological momentum, from swarm robotics to space situational awareness, is fundamentally reshaping mission capabilities and economic models.

What are the Key Data Covered in this AI In Space Exploration Market Research and Growth Report?

  • What is the expected growth of the AI In Space Exploration Market between 2025 and 2029?

    • USD 11.28 billion, at a CAGR of 34.1%

  • What segmentation does the market report cover?

    • The report is segmented by Type (Rovers, Robotic arms, Space probes, and Others), Application (Robotics, Manned vehicles launch, Communications, Remote sensing and monitoring, and Others), End-user (Government, and Commercial) and Geography (North America, APAC, Europe, South America, Middle East and Africa)

  • Which regions are analyzed in the report?

    • North America, APAC, Europe, South America and Middle East and Africa

  • What are the key growth drivers and market challenges?

    • Increasing investment and strategic initiatives in space exploration, High development and implementation costs

  • Who are the major players in the AI In Space Exploration Market?

    • Airbus SE, BAE Systems Plc, Blue Origin Enterprises LP, Booz Allen Hamilton Corp., Capella Space Corp., D-Orbit, Hewlett Packard, ICEYE Oy, IBM Corp., Lockheed Martin Corp., Maxar Technologies Inc., Northrop Grumman Corp., OHB System AG, Planet Labs PBC, Spire Global Inc., Thales Group and The Boeing Co.

Market Research Insights

  • The market is driven by AI in mission planning and automated mission control, where AI in spacecraft design and launch vehicle systems are reducing development cycles by over 40%. Autonomous space exploration is realized through machine learning for space robotics and autonomous vehicle navigation, crucial for autonomous planetary rovers.
  • AI for satellite operations and space traffic management enables on-orbit servicing AI and on-orbit manufacturing. Concurrently, AI-driven scientific analysis via AI-powered space telescopes and deep learning in astrophysics powers data analytics for space missions. AI in remote sensing and Earth observation is a key application. AI-enhanced communication networks and the AI for deep space network improve data throughput by 30%.
  • Future applications include intelligent resource management for AI for asteroid mining, predictive analytics for spacecraft, crew health monitoring AI, intelligent life support systems, and AI for space weather forecasting, all underpinning the next wave of robotics in space exploration and AI for celestial navigation.

We can help! Our analysts can customize this ai in space exploration market research report to meet your requirements.

Get in touch

1. Executive Summary

1.1 Market overview

Executive Summary - Chart on Market Overview
Executive Summary - Data Table on Market Overview
Executive Summary - Chart on Global Market Characteristics
Executive Summary - Chart on Market by Geography
Executive Summary - Chart on Market Segmentation by Type
Executive Summary - Chart on Market Segmentation by Application
Executive Summary - Chart on Market Segmentation by End-user
Executive Summary - Chart on Incremental Growth
Executive Summary - Data Table on Incremental Growth
Executive Summary - Chart on Company Market Positioning

2. Technavio Analysis

2.1 Analysis of price sensitivity, lifecycle, customer purchase basket, adoption rates, and purchase criteria

2.2 Criticality of inputs and Factors of differentiation

Chart on Overview on criticality of inputs and factors of differentiation

2.3 Factors of disruption

Chart on Overview on factors of disruption

2.4 Impact of drivers and challenges

Chart on Impact of drivers and challenges in 2024 and 2029

3. Market Landscape

3.1 Market ecosystem

Chart on Parent Market
Data Table on - Parent Market

3.2 Market characteristics

Chart on Market characteristics analysis

3.3 Value chain analysis

Chart on Value chain analysis

4. Market Sizing

4.1 Market definition

Data Table on Offerings of companies included in the market definition

4.2 Market segment analysis

Market segments

4.3 Market size 2024

4.4 Market outlook: Forecast for 2024-2029

Chart on Global - Market size and forecast 2024-2029 ($ million)
Data Table on Global - Market size and forecast 2024-2029 ($ million)
Chart on Global Market: Year-over-year growth 2024-2029 (%)
Data Table on Global Market: Year-over-year growth 2024-2029 (%)

5. Historic Market Size

5.1 Global AI In Space Exploration Market 2019 - 2023

Historic Market Size - Data Table on Global AI In Space Exploration Market 2019 - 2023 ($ million)

5.2 Type segment analysis 2019 - 2023

Historic Market Size - Type Segment 2019 - 2023 ($ million)

5.3 Application segment analysis 2019 - 2023

Historic Market Size - Application Segment 2019 - 2023 ($ million)

5.4 End-user segment analysis 2019 - 2023

Historic Market Size - End-user Segment 2019 - 2023 ($ million)

5.5 Geography segment analysis 2019 - 2023

Historic Market Size - Geography Segment 2019 - 2023 ($ million)

5.6 Country segment analysis 2019 - 2023

Historic Market Size - Country Segment 2019 - 2023 ($ million)

6. Five Forces Analysis

6.1 Five forces summary

Five forces analysis - Comparison between 2024 and 2029

6.2 Bargaining power of buyers

Bargaining power of buyers - Impact of key factors 2024 and 2029

6.3 Bargaining power of suppliers

Bargaining power of suppliers - Impact of key factors in 2024 and 2029

6.4 Threat of new entrants

Threat of new entrants - Impact of key factors in 2024 and 2029

6.5 Threat of substitutes

Threat of substitutes - Impact of key factors in 2024 and 2029

6.6 Threat of rivalry

Threat of rivalry - Impact of key factors in 2024 and 2029

6.7 Market condition

Chart on Market condition - Five forces 2024 and 2029

7. Market Segmentation by Type

7.1 Market segments

Chart on Type - Market share 2024-2029 (%)
Data Table on Type - Market share 2024-2029 (%)

7.2 Comparison by Type

Chart on Comparison by Type
Data Table on Comparison by Type

7.3 Rovers - Market size and forecast 2024-2029

Chart on Rovers - Market size and forecast 2024-2029 ($ million)
Data Table on Rovers - Market size and forecast 2024-2029 ($ million)
Chart on Rovers - Year-over-year growth 2024-2029 (%)
Data Table on Rovers - Year-over-year growth 2024-2029 (%)

7.4 Robotic arms - Market size and forecast 2024-2029

Chart on Robotic arms - Market size and forecast 2024-2029 ($ million)
Data Table on Robotic arms - Market size and forecast 2024-2029 ($ million)
Chart on Robotic arms - Year-over-year growth 2024-2029 (%)
Data Table on Robotic arms - Year-over-year growth 2024-2029 (%)

7.5 Space probes - Market size and forecast 2024-2029

Chart on Space probes - Market size and forecast 2024-2029 ($ million)
Data Table on Space probes - Market size and forecast 2024-2029 ($ million)
Chart on Space probes - Year-over-year growth 2024-2029 (%)
Data Table on Space probes - Year-over-year growth 2024-2029 (%)

7.6 Others - Market size and forecast 2024-2029

Chart on Others - Market size and forecast 2024-2029 ($ million)
Data Table on Others - Market size and forecast 2024-2029 ($ million)
Chart on Others - Year-over-year growth 2024-2029 (%)
Data Table on Others - Year-over-year growth 2024-2029 (%)

7.7 Market opportunity by Type

Market opportunity by Type ($ million)
Data Table on Market opportunity by Type ($ million)

8. Market Segmentation by Application

8.1 Market segments

Chart on Application - Market share 2024-2029 (%)
Data Table on Application - Market share 2024-2029 (%)

8.2 Comparison by Application

Chart on Comparison by Application
Data Table on Comparison by Application

8.3 Robotics - Market size and forecast 2024-2029

Chart on Robotics - Market size and forecast 2024-2029 ($ million)
Data Table on Robotics - Market size and forecast 2024-2029 ($ million)
Chart on Robotics - Year-over-year growth 2024-2029 (%)
Data Table on Robotics - Year-over-year growth 2024-2029 (%)

8.4 Manned vehicles launch - Market size and forecast 2024-2029

Chart on Manned vehicles launch - Market size and forecast 2024-2029 ($ million)
Data Table on Manned vehicles launch - Market size and forecast 2024-2029 ($ million)
Chart on Manned vehicles launch - Year-over-year growth 2024-2029 (%)
Data Table on Manned vehicles launch - Year-over-year growth 2024-2029 (%)

8.5 Communications - Market size and forecast 2024-2029

Chart on Communications - Market size and forecast 2024-2029 ($ million)
Data Table on Communications - Market size and forecast 2024-2029 ($ million)
Chart on Communications - Year-over-year growth 2024-2029 (%)
Data Table on Communications - Year-over-year growth 2024-2029 (%)

8.6 Remote sensing and monitoring - Market size and forecast 2024-2029

Chart on Remote sensing and monitoring - Market size and forecast 2024-2029 ($ million)
Data Table on Remote sensing and monitoring - Market size and forecast 2024-2029 ($ million)
Chart on Remote sensing and monitoring - Year-over-year growth 2024-2029 (%)
Data Table on Remote sensing and monitoring - Year-over-year growth 2024-2029 (%)

8.7 Others - Market size and forecast 2024-2029

Chart on Others - Market size and forecast 2024-2029 ($ million)
Data Table on Others - Market size and forecast 2024-2029 ($ million)
Chart on Others - Year-over-year growth 2024-2029 (%)
Data Table on Others - Year-over-year growth 2024-2029 (%)

8.8 Market opportunity by Application

Market opportunity by Application ($ million)
Data Table on Market opportunity by Application ($ million)

9. Market Segmentation by End-user

9.1 Market segments

Chart on End-user - Market share 2024-2029 (%)
Data Table on End-user - Market share 2024-2029 (%)

9.2 Comparison by End-user

Chart on Comparison by End-user
Data Table on Comparison by End-user

9.3 Government - Market size and forecast 2024-2029

Chart on Government - Market size and forecast 2024-2029 ($ million)
Data Table on Government - Market size and forecast 2024-2029 ($ million)
Chart on Government - Year-over-year growth 2024-2029 (%)
Data Table on Government - Year-over-year growth 2024-2029 (%)

9.4 Commercial - Market size and forecast 2024-2029

Chart on Commercial - Market size and forecast 2024-2029 ($ million)
Data Table on Commercial - Market size and forecast 2024-2029 ($ million)
Chart on Commercial - Year-over-year growth 2024-2029 (%)
Data Table on Commercial - Year-over-year growth 2024-2029 (%)

9.5 Market opportunity by End-user

Market opportunity by End-user ($ million)
Data Table on Market opportunity by End-user ($ million)

10. Customer Landscape

10.1 Customer landscape overview

Analysis of price sensitivity, lifecycle, customer purchase basket, adoption rates, and purchase criteria

11. Geographic Landscape

11.1 Geographic segmentation

Chart on Market share by geography 2024-2029 (%)
Data Table on Market share by geography 2024-2029 (%)

11.2 Geographic comparison

Chart on Geographic comparison
Data Table on Geographic comparison

11.3 North America - Market size and forecast 2024-2029

Chart on North America - Market size and forecast 2024-2029 ($ million)
Data Table on North America - Market size and forecast 2024-2029 ($ million)
Chart on North America - Year-over-year growth 2024-2029 (%)
Data Table on North America - Year-over-year growth 2024-2029 (%)
Chart on Regional Comparison - North America
Data Table on Regional Comparison - North America

11.3.1 US - Market size and forecast 2024-2029

Chart on US - Market size and forecast 2024-2029 ($ million)
Data Table on US - Market size and forecast 2024-2029 ($ million)
Chart on US - Year-over-year growth 2024-2029 (%)
Data Table on US - Year-over-year growth 2024-2029 (%)

11.3.2 Canada - Market size and forecast 2024-2029

Chart on Canada - Market size and forecast 2024-2029 ($ million)
Data Table on Canada - Market size and forecast 2024-2029 ($ million)
Chart on Canada - Year-over-year growth 2024-2029 (%)
Data Table on Canada - Year-over-year growth 2024-2029 (%)

11.4 APAC - Market size and forecast 2024-2029

Chart on APAC - Market size and forecast 2024-2029 ($ million)
Data Table on APAC - Market size and forecast 2024-2029 ($ million)
Chart on APAC - Year-over-year growth 2024-2029 (%)
Data Table on APAC - Year-over-year growth 2024-2029 (%)
Chart on Regional Comparison - APAC
Data Table on Regional Comparison - APAC

11.4.1 China - Market size and forecast 2024-2029

Chart on China - Market size and forecast 2024-2029 ($ million)
Data Table on China - Market size and forecast 2024-2029 ($ million)
Chart on China - Year-over-year growth 2024-2029 (%)
Data Table on China - Year-over-year growth 2024-2029 (%)

11.4.2 Japan - Market size and forecast 2024-2029

Chart on Japan - Market size and forecast 2024-2029 ($ million)
Data Table on Japan - Market size and forecast 2024-2029 ($ million)
Chart on Japan - Year-over-year growth 2024-2029 (%)
Data Table on Japan - Year-over-year growth 2024-2029 (%)

11.4.3 India - Market size and forecast 2024-2029

Chart on India - Market size and forecast 2024-2029 ($ million)
Data Table on India - Market size and forecast 2024-2029 ($ million)
Chart on India - Year-over-year growth 2024-2029 (%)
Data Table on India - Year-over-year growth 2024-2029 (%)

11.4.4 Australia - Market size and forecast 2024-2029

Chart on Australia - Market size and forecast 2024-2029 ($ million)
Data Table on Australia - Market size and forecast 2024-2029 ($ million)
Chart on Australia - Year-over-year growth 2024-2029 (%)
Data Table on Australia - Year-over-year growth 2024-2029 (%)

11.4.5 South Korea - Market size and forecast 2024-2029

Chart on South Korea - Market size and forecast 2024-2029 ($ million)
Data Table on South Korea - Market size and forecast 2024-2029 ($ million)
Chart on South Korea - Year-over-year growth 2024-2029 (%)
Data Table on South Korea - Year-over-year growth 2024-2029 (%)

11.5 Europe - Market size and forecast 2024-2029

Chart on Europe - Market size and forecast 2024-2029 ($ million)
Data Table on Europe - Market size and forecast 2024-2029 ($ million)
Chart on Europe - Year-over-year growth 2024-2029 (%)
Data Table on Europe - Year-over-year growth 2024-2029 (%)
Chart on Regional Comparison - Europe
Data Table on Regional Comparison - Europe

11.5.1 Germany - Market size and forecast 2024-2029

Chart on Germany - Market size and forecast 2024-2029 ($ million)
Data Table on Germany - Market size and forecast 2024-2029 ($ million)
Chart on Germany - Year-over-year growth 2024-2029 (%)
Data Table on Germany - Year-over-year growth 2024-2029 (%)

11.5.2 UK - Market size and forecast 2024-2029

Chart on UK - Market size and forecast 2024-2029 ($ million)
Data Table on UK - Market size and forecast 2024-2029 ($ million)
Chart on UK - Year-over-year growth 2024-2029 (%)
Data Table on UK - Year-over-year growth 2024-2029 (%)

11.5.3 France - Market size and forecast 2024-2029

Chart on France - Market size and forecast 2024-2029 ($ million)
Data Table on France - Market size and forecast 2024-2029 ($ million)
Chart on France - Year-over-year growth 2024-2029 (%)
Data Table on France - Year-over-year growth 2024-2029 (%)

11.6 South America - Market size and forecast 2024-2029

Chart on South America - Market size and forecast 2024-2029 ($ million)
Data Table on South America - Market size and forecast 2024-2029 ($ million)
Chart on South America - Year-over-year growth 2024-2029 (%)
Data Table on South America - Year-over-year growth 2024-2029 (%)
Chart on Regional Comparison - South America
Data Table on Regional Comparison - South America

11.6.1 Brazil - Market size and forecast 2024-2029

Chart on Brazil - Market size and forecast 2024-2029 ($ million)
Data Table on Brazil - Market size and forecast 2024-2029 ($ million)
Chart on Brazil - Year-over-year growth 2024-2029 (%)
Data Table on Brazil - Year-over-year growth 2024-2029 (%)

11.6.2 Argentina - Market size and forecast 2024-2029

Chart on Argentina - Market size and forecast 2024-2029 ($ million)
Data Table on Argentina - Market size and forecast 2024-2029 ($ million)
Chart on Argentina - Year-over-year growth 2024-2029 (%)
Data Table on Argentina - Year-over-year growth 2024-2029 (%)

11.7 Middle East and Africa - Market size and forecast 2024-2029

Chart on Middle East and Africa - Market size and forecast 2024-2029 ($ million)
Data Table on Middle East and Africa - Market size and forecast 2024-2029 ($ million)
Chart on Middle East and Africa - Year-over-year growth 2024-2029 (%)
Data Table on Middle East and Africa - Year-over-year growth 2024-2029 (%)
Chart on Regional Comparison - Middle East and Africa
Data Table on Regional Comparison - Middle East and Africa

11.7.1 Saudi Arabia - Market size and forecast 2024-2029

Chart on Saudi Arabia - Market size and forecast 2024-2029 ($ million)
Data Table on Saudi Arabia - Market size and forecast 2024-2029 ($ million)
Chart on Saudi Arabia - Year-over-year growth 2024-2029 (%)
Data Table on Saudi Arabia - Year-over-year growth 2024-2029 (%)

11.7.2 UAE - Market size and forecast 2024-2029

Chart on UAE - Market size and forecast 2024-2029 ($ million)
Data Table on UAE - Market size and forecast 2024-2029 ($ million)
Chart on UAE - Year-over-year growth 2024-2029 (%)
Data Table on UAE - Year-over-year growth 2024-2029 (%)

11.8 Market opportunity by geography

Market opportunity by geography ($ million)
Data Tables on Market opportunity by geography ($ million)

12. Drivers, Challenges, and Opportunity

12.1 Market drivers

Increasing investment and strategic initiatives in space exploration
Advancements in AI and machine learning technologies
Growing demand for autonomous systems and predictive maintenance

12.2 Market challenges

High development and implementation costs
Data security and privacy concerns
Regulatory and ethical frameworks

12.3 Impact of drivers and challenges

Impact of drivers and challenges in 2024 and 2029

12.4 Market opportunities

Advancements in autonomous navigation and mission control
AI-powered data analysis and scientific discovery
AI for in-situ resource utilization and space manufacturing

13. Competitive Landscape

13.1 Overview

13.2

Overview on criticality of inputs and factors of differentiation

13.3 Landscape disruption

Overview on factors of disruption

13.4 Industry risks

Impact of key risks on business

14. Competitive Analysis

14.1 Companies profiled

Companies covered

14.2 Company ranking index

14.3 Market positioning of companies

Matrix on companies position and classification

14.4 Airbus SE

Airbus SE - Overview
Airbus SE - Business segments
Airbus SE - Key news
Airbus SE - Key offerings
Airbus SE - Segment focus
SWOT

14.5 BAE Systems Plc

BAE Systems Plc - Overview
BAE Systems Plc - Business segments
BAE Systems Plc - Key news
BAE Systems Plc - Key offerings
BAE Systems Plc - Segment focus
SWOT

14.6 Blue Origin Enterprises LP

Blue Origin Enterprises LP - Overview
Blue Origin Enterprises LP - Product / Service
Blue Origin Enterprises LP - Key offerings
SWOT

14.7 Capella Space Corp.

Capella Space Corp. - Overview
Capella Space Corp. - Product / Service
Capella Space Corp. - Key offerings
SWOT

14.8 Hewlett Packard

Hewlett Packard - Overview
Hewlett Packard - Business segments
Hewlett Packard - Key news
Hewlett Packard - Key offerings
Hewlett Packard - Segment focus
SWOT

14.9 ICEYE Oy

ICEYE Oy - Overview
ICEYE Oy - Product / Service
ICEYE Oy - Key offerings
SWOT

14.10 IBM Corp.

IBM Corp. - Overview
IBM Corp. - Business segments
IBM Corp. - Key news
IBM Corp. - Key offerings
IBM Corp. - Segment focus
SWOT

14.11 Lockheed Martin Corp.

Lockheed Martin Corp. - Overview
Lockheed Martin Corp. - Business segments
Lockheed Martin Corp. - Key news
Lockheed Martin Corp. - Key offerings
Lockheed Martin Corp. - Segment focus
SWOT

14.12 Maxar Technologies Inc.

Maxar Technologies Inc. - Overview
Maxar Technologies Inc. - Product / Service
Maxar Technologies Inc. - Key news
Maxar Technologies Inc. - Key offerings
SWOT

14.13 Northrop Grumman Corp.

Northrop Grumman Corp. - Overview
Northrop Grumman Corp. - Business segments
Northrop Grumman Corp. - Key news
Northrop Grumman Corp. - Key offerings
Northrop Grumman Corp. - Segment focus
SWOT

14.14 OHB System AG

OHB System AG - Overview
OHB System AG - Product / Service
OHB System AG - Key offerings
SWOT

14.15 Planet Labs PBC

Planet Labs PBC - Overview
Planet Labs PBC - Product / Service
Planet Labs PBC - Key offerings
SWOT

14.16 Spire Global Inc.

Spire Global Inc. - Overview
Spire Global Inc. - Product / Service
Spire Global Inc. - Key offerings
SWOT

14.17 Thales Group

Thales Group - Overview
Thales Group - Business segments
Thales Group - Key news
Thales Group - Key offerings
Thales Group - Segment focus
SWOT

14.18 The Boeing Co.

The Boeing Co. - Overview
The Boeing Co. - Business segments
The Boeing Co. - Key news
The Boeing Co. - Key offerings
The Boeing Co. - Segment focus
SWOT

15. Appendix

15.1 Scope of the report

Market definition
Objectives
Notes and caveats

15.2 Inclusions and exclusions checklist

Inclusions checklist
Exclusions checklist

15.3 Currency conversion rates for US$

15.4 Research methodology

15.5 Data procurement

Information sources

15.6 Data validation

15.7 Validation techniques employed for market sizing

15.8 Data synthesis

15.9 360 degree market analysis

15.10 List of abbreviations

Research Methodology

Technavio presents a detailed picture of the market by way of study, synthesis, and summation of data from multiple sources. The analysts have presented the various facets of the market with a particular focus on identifying the key industry influencers. The data thus presented is comprehensive, reliable, and the result of extensive research, both primary and secondary.

INFORMATION SOURCES

Primary sources

  • Manufacturers and suppliers
  • Channel partners
  • Industry experts
  • Strategic decision makers

Secondary sources

  • Industry journals and periodicals
  • Government data
  • Financial reports of key industry players
  • Historical data
  • Press releases

DATA ANALYSIS

Data Synthesis

  • Collation of data
  • Estimation of key figures
  • Analysis of derived insights

Data Validation

  • Triangulation with data models
  • Reference against proprietary databases
  • Corroboration with industry experts

REPORT WRITING

Qualitative

  • Market drivers
  • Market challenges
  • Market trends
  • Five forces analysis

Quantitative

  • Market size and forecast
  • Market segmentation
  • Geographical insights
  • Competitive landscape

Interested in this report?

Get your sample now to see our research methodology and insights!

Download Now

Frequently Asked Questions

AI In Space Exploration market growth will increase by USD 11278.1 million during 2025-2029 .

The AI In Space Exploration market is expected to grow at a CAGR of 34.1% during 2025-2029 .

AI In Space Exploration market is segmented by Type (Rovers, Robotic arms, Space probes, Others) Application (Robotics, Manned vehicles launch, Communications, Remote sensing and monitoring, Others) End-user (Government, Commercial)

Airbus SE, BAE Systems Plc, Blue Origin Enterprises LP, Booz Allen Hamilton Corp., Capella Space Corp., D-Orbit, Hewlett Packard, ICEYE Oy, IBM Corp., Lockheed Martin Corp., Maxar Technologies Inc., Northrop Grumman Corp., OHB System AG, Planet Labs PBC, Spire Global Inc., Thales Group, The Boeing Co. are a few of the key vendors in the AI In Space Exploration market.

North America will register the highest growth rate of 41.8% among the other regions. Therefore, the AI In Space Exploration market in North America is expected to garner significant business opportunities for the vendors during the forecast period.

US, Canada, China, Japan, India, Australia, South Korea, Germany, UK, France, Brazil, Argentina, Saudi Arabia, UAE

  • Increasing investment and strategic initiatives in space exploration is the driving factor this market.

The AI In Space Exploration market vendors should focus on grabbing business opportunities from the Type segment as it accounted for the largest market share in the base year.