AI In Supply Chain Management Market Analysis, Size, and Forecast 2025-2029: North America (US, Canada, and Mexico), Europe (Germany, UK, and France), APAC (China, Japan, and India), South America (Brazil, Argentina, and Colombia), Middle East and Africa (UAE, Saudi Arabia, and South Africa), and Rest of World (ROW)

AI In Supply Chain Management Market Analysis, Size, and Forecast 2025-2029:
North America (US, Canada, and Mexico), Europe (Germany, UK, and France), APAC (China, Japan, and India), South America (Brazil, Argentina, and Colombia), Middle East and Africa (UAE, Saudi Arabia, and South Africa), and Rest of World (ROW) direct

Published: Dec 2025 300 Pages SKU: IRTNTR81115

Market Overview at a Glance

$19.41 B
Market Opportunity
25.4%
CAGR 2024 - 2029
32.6%
North America Growth
$4.36 B
Software segment 2023

AI In Supply Chain Management Market Size 2025-2029

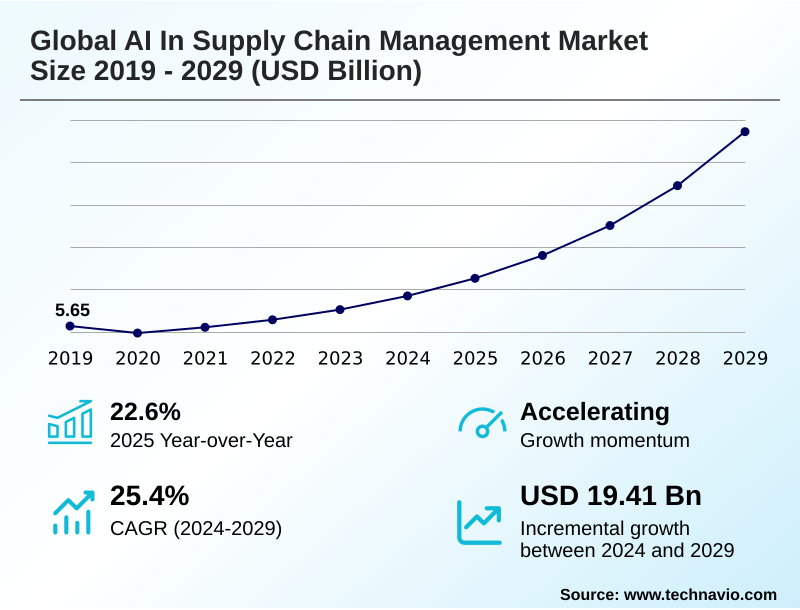
The ai in supply chain management market size is valued to increase by USD 19.41 billion, at a CAGR of 25.4% from 2024 to 2029. Increasing demand for enhanced visibility and transparency will drive the ai in supply chain management market.

Major Market Trends & Insights

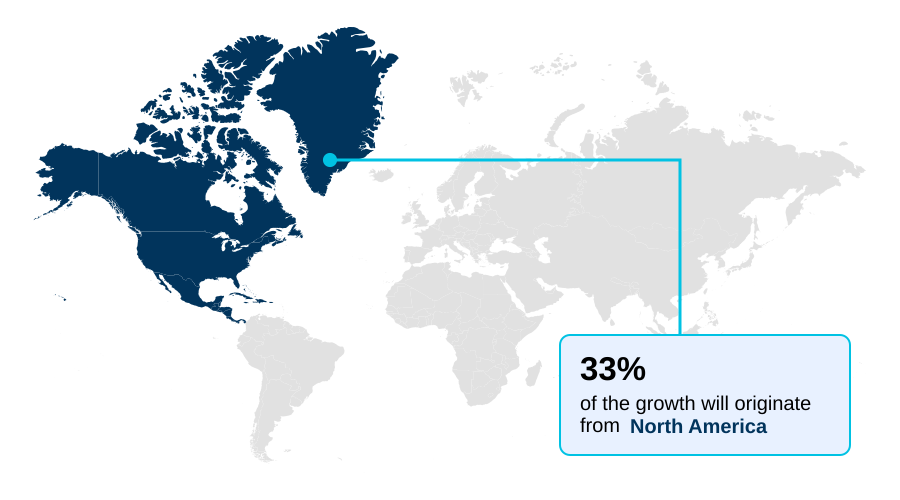
  • North America dominated the market and accounted for a 32.6% growth during the forecast period.
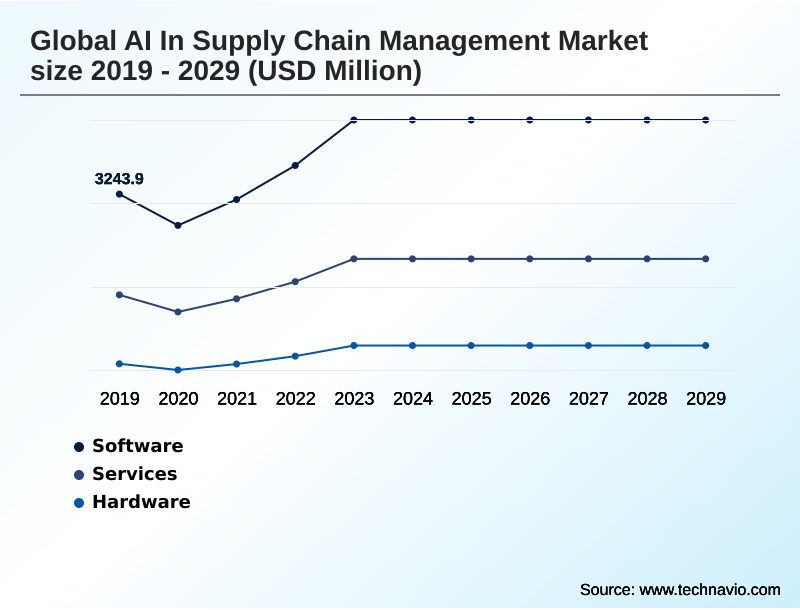
  • By Component - Software segment was valued at USD 4.36 billion in 2023
  • By Application - Demand planning and forecasting segment accounted for the largest market revenue share in 2023

Market Size & Forecast

  • Market Opportunities: USD 22.97 billion
  • Market Future Opportunities: USD 19.41 billion
  • CAGR from 2024 to 2029 : 25.4%

Market Summary

  • The AI in supply chain management market is undergoing a fundamental transformation, moving from traditional, reactive models to predictive, autonomous operational frameworks. This evolution is driven by the imperative for enhanced operational efficiency, cost reduction, and greater resilience in the face of global volatility.
  • Key technologies such as machine learning algorithms, predictive analytics, and generative AI are being integrated to automate complex processes and provide deeper data-driven insights. For example, a global consumer goods company can leverage AI-driven demand forecasting, which analyzes not just historical sales but also real-time market signals for more accurate inventory optimization. This prevents stockouts and reduces carrying costs.
  • However, adoption is not without challenges. Integrating disparate data sources and ensuring data security are significant hurdles. The pronounced talent gap for professionals skilled in both supply chain logistics and data science further constrains progress.
  • The proliferation of hyper-automation and intelligent warehousing solutions, powered by technologies like computer vision and autonomous mobile robots (AMRs), signals the market's trajectory toward creating highly efficient, self-optimizing, and transparent supply networks that offer a distinct competitive advantage.

What will be the Size of the AI In Supply Chain Management Market during the forecast period?

Get Key Insights on Market Forecast (PDF) Request Free Sample

How is the AI In Supply Chain Management Market Segmented?

The ai in supply chain management industry research report provides comprehensive data (region-wise segment analysis), with forecasts and estimates in "USD million" for the period 2025-2029, as well as historical data from 2019-2023 for the following segments.

  • Component
    • Software
    • Services
    • Hardware
  • Application
    • Demand planning and forecasting
    • Inventory management
    • Transportation management
    • Others
  • Deployment
    • Cloud-based
    • On-premises
    • Hybrid
  • Geography
    • North America
      • US
      • Canada
      • Mexico
    • Europe
      • Germany
      • UK
      • France
    • APAC
      • China
      • Japan
      • India
    • South America
      • Brazil
      • Argentina
      • Colombia
    • Middle East and Africa
      • UAE
      • Saudi Arabia
      • South Africa
    • Rest of World (ROW)

By Component Insights

The software segment is estimated to witness significant growth during the forecast period.

The software segment is the intelligence layer of the AI in supply chain management market, crucial for achieving end-to-end visibility. It encompasses solutions using machine learning algorithms and predictive analytics for autonomous decision making.

These platforms provide real-time visibility, enabling supply chain orchestration and intelligent automation. Capabilities extend to using natural language processing for unstructured data analysis and computer vision for quality checks, where implementations have reduced inspection errors by over 25%.

This cognitive automation transforms operations from reactive to proactive, providing a unified, strategic view. The market segmentation reveals software as the dominant component, driving the shift toward more resilient and data-driven supply networks through advanced computational analysis and process optimization.

Request Free Sample

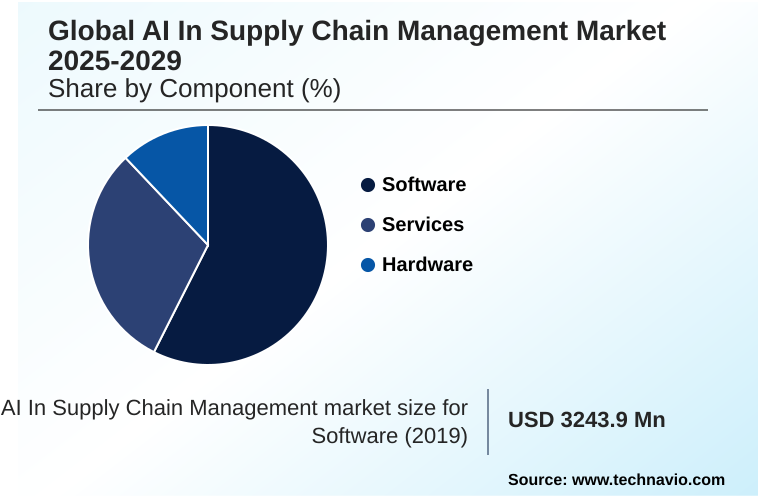
The Software segment was valued at USD 4.36 billion in 2023 and showed a gradual increase during the forecast period.

Request Free Sample

Regional Analysis

North America is estimated to contribute 32.6% to the growth of the global market during the forecast period.Technavio’s analysts have elaborately explained the regional trends and drivers that shape the market during the forecast period.

See How AI In Supply Chain Management Market Demand is Rising in North America Request Free Sample

North America leads the cognitive supply chain market, driven by mature infrastructure and high adoption rates, with the US accounting for over 27% of market value in 2024.

The region focuses on AI-driven demand forecasting and risk management to counter disruptions. In contrast, the APAC market, with a projected CAGR of 26.4%, is the fastest-growing region, leveraging AI for logistics and network optimization to manage vast e-commerce volumes.

European firms prioritize inventory optimization and predictive maintenance, with some achieving a 15% reduction in logistics costs through AI integration.

Across these regions, technologies like demand sensing and concurrent planning are becoming standard for building resilient operations, while predictive shipment tracking enhances customer satisfaction and operational control.

Market Dynamics

Our researchers analyzed the data with 2024 as the base year, along with the key drivers, trends, and challenges. A holistic analysis of drivers will help companies refine their marketing strategies to gain a competitive advantage.

  • The practical application of AI in supply chain management is rapidly expanding into specialized, high-impact areas. For instance, AI for last-mile delivery optimization is critical for e-commerce, directly addressing the most expensive part of the fulfillment journey. Beyond logistics, generative AI in network design allows companies to model and build more resilient supply routes from the ground up.
  • The use of predictive analytics for disruption is becoming a standard proactive measure, moving beyond simple alerts to offer actionable mitigation strategies. At the core of planning, machine learning for demand forecasting consistently outperforms traditional methods, with some companies seeing forecast accuracy improvements that are twice as effective at reducing stockouts.
  • The focus on cost control is evident in how AI is reducing logistics costs through better asset utilization and fuel management. Within facilities, AI in warehouse automation and the use of computer vision for quality control are increasing throughput and accuracy.
  • Other key applications include natural language processing in procurement for better contract analysis, the deployment of digital twins for supply chain simulation, and leveraging IoT data for predictive maintenance on critical equipment. Furthermore, AI for dynamic route optimization, optimizing inventory with prescriptive analytics, and hyper-automation in fulfillment centers are becoming widespread.
  • Strategic gains are also found in multi-echelon inventory optimization strategy, agentic AI for task orchestration, and AI-driven spend analytics savings. The goal of enhancing visibility with cognitive automation, improving resilience with risk sensing, and ensuring product integrity through AI applications in cold chain logistics highlights the technology's pervasive impact.
  • The connection between smart manufacturing and AI integration is creating a seamless flow of data from production to consumer.

What are the key market drivers leading to the rise in the adoption of AI In Supply Chain Management Industry?

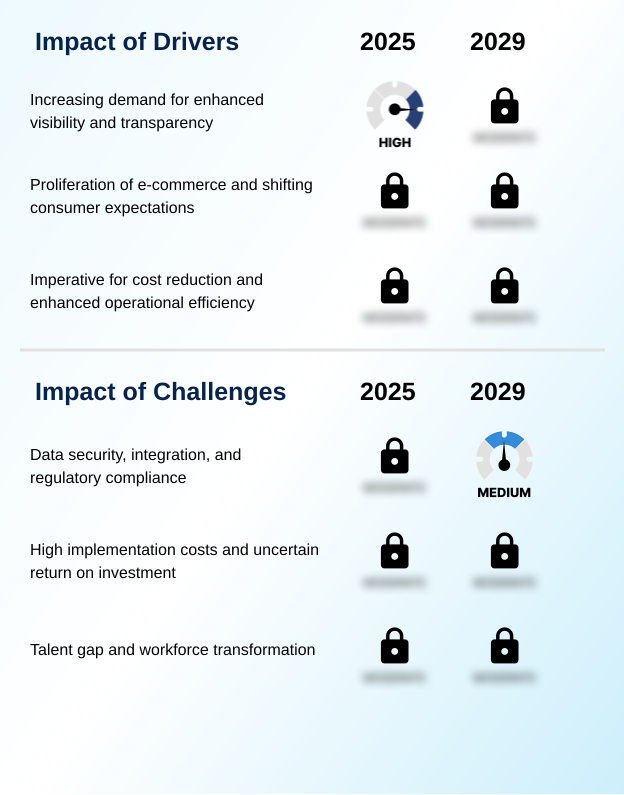
  • The increasing demand for enhanced visibility and transparency across the entire value chain is a primary driver for the accelerated adoption of AI in supply chain management.

  • Market drivers center on the need for enhanced supply chain resilience and efficiency. The adoption of digital transformation is accelerating, with companies leveraging generative AI to improve operational intelligence.
  • Intelligent warehousing, utilizing automated guided vehicles (AGVs) and prescriptive analytics, has demonstrated the ability to reduce inventory levels by up to 35%.
  • The use of digital twins for simulating network performance and edge computing for real-time decision-making is becoming more common. These technologies support advanced risk sensing, enabling organizations to proactively mitigate disruptions identified through AI analysis.
  • The imperative for cost reduction remains a powerful catalyst, as AI-driven optimization has been shown to lower transport costs by up to 30%, building a strong business case for investment.

What are the market trends shaping the AI In Supply Chain Management Industry?

  • The proliferation of generative AI in supply chain operations is a primary market trend. This technology is fundamentally altering strategic and operational paradigms beyond traditional analytics.

  • Key market trends are redefining operational efficiency. The use of autonomous mobile robots (AMRs) is surging, with some fulfillment centers increasing picking productivity by over 40%. Concurrently, the integration of data from IoT sensors, RFID tags, and GPS trackers is enabling sophisticated supply chain modeling and logistics orchestration. This trend supports smart manufacturing integration, where AI agents execute complex decisions.
  • In procurement automation, AI-powered business planning tools are delivering substantial savings, with early adopters reporting cost reductions of up to 10%. These advancements reflect a move toward hyper-automated environments where physical and digital processes are seamlessly interconnected, driving a new level of performance and resilience in supply chain operations.

What challenges does the AI In Supply Chain Management Industry face during its growth?

  • The multifaceted challenges of data security, complex systems integration, and evolving regulatory compliance represent a primary obstacle to widespread AI implementation in supply chain management.

  • Despite significant opportunities, market adoption faces notable challenges. The talent gap remains a primary constraint, with one analysis noting that only 35% of employees have received any AI-related training, hindering the effective use of tools for AI-enhanced demand planning and spend analytics.
  • High implementation costs and uncertain ROI also temper investment in advanced systems like agentic AI for autonomous fulfillment or platforms for multi-echelon inventory optimization. Furthermore, integrating these technologies for functions like intelligent fleet management and dynamic route optimization with fragmented legacy systems is a significant technical hurdle.
  • Successfully deploying hyper-automation requires a strategic approach to overcome these data integration and workforce transformation issues, which can otherwise stall progress and diminish returns.

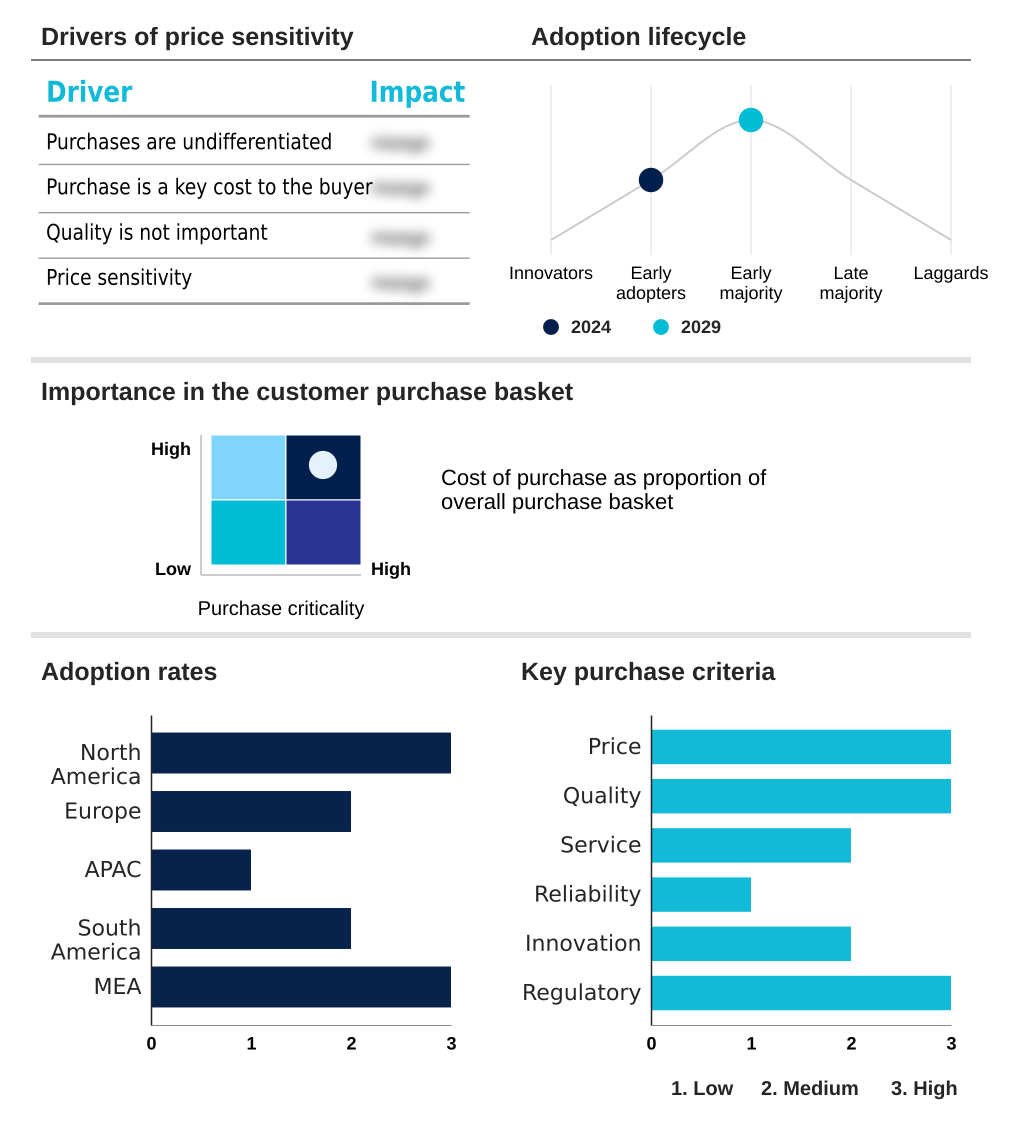
Exclusive Technavio Analysis on Customer Landscape

The ai in supply chain management market forecasting report includes the adoption lifecycle of the market, covering from the innovator’s stage to the laggard’s stage. It focuses on adoption rates in different regions based on penetration. Furthermore, the ai in supply chain management market report also includes key purchase criteria and drivers of price sensitivity to help companies evaluate and develop their market growth analysis strategies.

Customer Landscape of AI In Supply Chain Management Industry

Competitive Landscape

Companies are implementing various strategies, such as strategic alliances, ai in supply chain management market forecast, partnerships, mergers and acquisitions, geographical expansion, and product/service launches, to enhance their presence in the industry.

Alibaba Group Holding Ltd. - Provides AI-driven demand forecasting and intelligent logistics to enhance e-commerce supply chain performance.

The industry research and growth report includes detailed analyses of the competitive landscape of the market and information about key companies, including:

  • Alibaba Group Holding Ltd.
  • Amazon Web Services Inc.
  • Blue Yonder Group Inc.
  • Coupa Software Inc.
  • Descartes Systems Group Inc.
  • DHL International GmbH
  • E2open Parent Holdings Inc.
  • Fourkites Inc.
  • Google LLC
  • Infor Inc.
  • IBM Corp.
  • Kinaxis Inc.
  • Manhattan Associates Inc.
  • Microsoft Corp.
  • Oracle Corp.
  • Samsung SDS
  • SAP SE
  • Siemens AG

Qualitative and quantitative analysis of companies has been conducted to help clients understand the wider business environment as well as the strengths and weaknesses of key industry players. Data is qualitatively analyzed to categorize companies as pure play, category-focused, industry-focused, and diversified; it is quantitatively analyzed to categorize companies as dominant, leading, strong, tentative, and weak.

Recent Development and News in Ai in supply chain management market

  • In August 2024, technology leaders including Amazon Web Services Inc. and Microsoft Corp. made significant strides by integrating advanced AI into their supply chain management tools to improve decision-making.
  • In December 2024, Italy secured a major European High-Performance Computing Joint Undertaking project, IT4LIA AI Factory, to host a European AI supercomputer supporting strategic sectors like manufacturing supply chains.
  • In February 2025, the Colombian government approved its National Artificial Intelligence Policy, CONPES 4144, committing approximately $115.9 million through 2030 to foster AI research, development, and adoption in key economic sectors.
  • In March 2025, France's public investment bank, Bpifrance, announced a major initiative to mobilize substantial capital by 2029, aimed at supporting the entire AI value chain from startups to infrastructure.

Dive into Technavio’s robust research methodology, blending expert interviews, extensive data synthesis, and validated models for unparalleled AI In Supply Chain Management Market insights. See full methodology.

Market Scope
Page number 300
Base year 2024
Historic period 2019-2023
Forecast period 2025-2029
Growth momentum & CAGR Accelerate at a CAGR of 25.4%
Market growth 2025-2029 USD 19408.3 million
Market structure Fragmented
YoY growth 2024-2025(%) 22.6%
Key countries US, Canada, Mexico, Germany, UK, France, Italy, Spain, The Netherlands, China, Japan, India, South Korea, Australia, Indonesia, Brazil, Argentina, Colombia, UAE, Saudi Arabia, South Africa, Israel and Egypt
Competitive landscape Leading Companies, Market Positioning of Companies, Competitive Strategies, and Industry Risks

Request Free Sample

Research Analyst Overview

  • The AI in supply chain management market is characterized by intense innovation, with companies integrating a suite of advanced technologies to build intelligent, autonomous systems. Core components include machine learning algorithms for predictive analytics and generative AI for novel problem-solving. These are augmented by natural language processing for unstructured data insights and computer vision for automated inspections.
  • The physical layer is transformed by IoT sensors, RFID tags, and GPS trackers feeding data into systems that control autonomous mobile robots (AMRs) and automated guided vehicles (AGVs). This shift enables sophisticated demand forecasting, inventory optimization, and logistics and network optimization.
  • To manage volatility, firms are implementing robust risk management and predictive maintenance protocols, often powered by digital twins that simulate network behavior. The adoption of prescriptive analytics and agentic AI is driving a move toward hyper-automation, particularly in procurement automation and multi-echelon inventory optimization.
  • A key boardroom consideration is the investment in edge computing to reduce latency, as some firms have achieved a 15% reduction in logistics costs by deploying AI-driven spend analytics and real-time decision-making capabilities, demonstrating a clear return on investment.

What are the Key Data Covered in this AI In Supply Chain Management Market Research and Growth Report?

  • What is the expected growth of the AI In Supply Chain Management Market between 2025 and 2029?

    • USD 19.41 billion, at a CAGR of 25.4%

  • What segmentation does the market report cover?

    • The report is segmented by Component (Software, Services, and Hardware), Application (Demand planning and forecasting, Inventory management, Transportation management, and Others), Deployment (Cloud-based, On-premises, and Hybrid) and Geography (North America, Europe, APAC, South America, Middle East and Africa)

  • Which regions are analyzed in the report?

    • North America, Europe, APAC, South America and Middle East and Africa

  • What are the key growth drivers and market challenges?

    • Increasing demand for enhanced visibility and transparency, Data security, integration, and regulatory compliance

  • Who are the major players in the AI In Supply Chain Management Market?

    • Alibaba Group Holding Ltd., Amazon Web Services Inc., Blue Yonder Group Inc., Coupa Software Inc., Descartes Systems Group Inc., DHL International GmbH, E2open Parent Holdings Inc., Fourkites Inc., Google LLC, Infor Inc., IBM Corp., Kinaxis Inc., Manhattan Associates Inc., Microsoft Corp., Oracle Corp., Samsung SDS, SAP SE and Siemens AG

Market Research Insights

  • The market's digital transformation is creating a cognitive supply chain where intelligent automation delivers enhanced operational intelligence. This evolution enables end-to-end visibility and real-time visibility, allowing for superior supply chain orchestration and concurrent planning. By adopting AI-driven demand forecasting and demand sensing, firms are increasing forecast accuracy by over 10%.
  • Further efficiencies are gained through advanced logistics orchestration and predictive shipment tracking. Intelligent warehousing, driven by AI agents, is boosting productivity in autonomous fulfillment by up to 45%. This push for supply chain resilience is supported by sophisticated supply chain modeling and risk sensing.
  • AI-enhanced demand planning, dynamic route optimization, and intelligent fleet management are now central to smart manufacturing integration.

We can help! Our analysts can customize this ai in supply chain management market research report to meet your requirements.

Get in touch

1. Executive Summary

1.1 Market overview

Executive Summary - Chart on Market Overview
Executive Summary - Data Table on Market Overview
Executive Summary - Chart on Global Market Characteristics
Executive Summary - Chart on Market by Geography
Executive Summary - Chart on Market Segmentation by Component
Executive Summary - Chart on Market Segmentation by Application
Executive Summary - Chart on Market Segmentation by Deployment
Executive Summary - Chart on Incremental Growth
Executive Summary - Data Table on Incremental Growth
Executive Summary - Chart on Company Market Positioning

2. Technavio Analysis

2.1 Analysis of price sensitivity, lifecycle, customer purchase basket, adoption rates, and purchase criteria

2.2 Criticality of inputs and Factors of differentiation

Chart on Overview on criticality of inputs and factors of differentiation

2.3 Factors of disruption

Chart on Overview on factors of disruption

2.4 Impact of drivers and challenges

Chart on Impact of drivers and challenges in 2024 and 2029

3. Market Landscape

3.1 Market ecosystem

Chart on Parent Market
Data Table on - Parent Market

3.2 Market characteristics

Chart on Market characteristics analysis

3.3 Value chain analysis

Chart on Value chain analysis

4. Market Sizing

4.1 Market definition

Data Table on Offerings of companies included in the market definition

4.2 Market segment analysis

Market segments

4.3 Market size 2024

4.4 Market outlook: Forecast for 2024-2029

Chart on Global - Market size and forecast 2024-2029 ($ million)
Data Table on Global - Market size and forecast 2024-2029 ($ million)
Chart on Global Market: Year-over-year growth 2024-2029 (%)
Data Table on Global Market: Year-over-year growth 2024-2029 (%)

5. Historic Market Size

5.1 Global AI In Supply Chain Management Market 2019 - 2023

Historic Market Size - Data Table on Global AI In Supply Chain Management Market 2019 - 2023 ($ million)

5.2 Component segment analysis 2019 - 2023

Historic Market Size - Component Segment 2019 - 2023 ($ million)

5.3 Application segment analysis 2019 - 2023

Historic Market Size - Application Segment 2019 - 2023 ($ million)

5.4 Deployment segment analysis 2019 - 2023

Historic Market Size - Deployment Segment 2019 - 2023 ($ million)

5.5 Geography segment analysis 2019 - 2023

Historic Market Size - Geography Segment 2019 - 2023 ($ million)

5.6 Country segment analysis 2019 - 2023

Historic Market Size - Country Segment 2019 - 2023 ($ million)

6. Five Forces Analysis

6.1 Five forces summary

Five forces analysis - Comparison between 2024 and 2029

6.2 Bargaining power of buyers

Bargaining power of buyers - Impact of key factors 2024 and 2029

6.3 Bargaining power of suppliers

Bargaining power of suppliers - Impact of key factors in 2024 and 2029

6.4 Threat of new entrants

Threat of new entrants - Impact of key factors in 2024 and 2029

6.5 Threat of substitutes

Threat of substitutes - Impact of key factors in 2024 and 2029

6.6 Threat of rivalry

Threat of rivalry - Impact of key factors in 2024 and 2029

6.7 Market condition

Chart on Market condition - Five forces 2024 and 2029

7. Market Segmentation by Component

7.1 Market segments

Chart on Component - Market share 2024-2029 (%)
Data Table on Component - Market share 2024-2029 (%)

7.2 Comparison by Component

Chart on Comparison by Component
Data Table on Comparison by Component

7.3 Software - Market size and forecast 2024-2029

Chart on Software - Market size and forecast 2024-2029 ($ million)
Data Table on Software - Market size and forecast 2024-2029 ($ million)
Chart on Software - Year-over-year growth 2024-2029 (%)
Data Table on Software - Year-over-year growth 2024-2029 (%)

7.4 Services - Market size and forecast 2024-2029

Chart on Services - Market size and forecast 2024-2029 ($ million)
Data Table on Services - Market size and forecast 2024-2029 ($ million)
Chart on Services - Year-over-year growth 2024-2029 (%)
Data Table on Services - Year-over-year growth 2024-2029 (%)

7.5 Hardware - Market size and forecast 2024-2029

Chart on Hardware - Market size and forecast 2024-2029 ($ million)
Data Table on Hardware - Market size and forecast 2024-2029 ($ million)
Chart on Hardware - Year-over-year growth 2024-2029 (%)
Data Table on Hardware - Year-over-year growth 2024-2029 (%)

7.6 Market opportunity by Component

Market opportunity by Component ($ million)
Data Table on Market opportunity by Component ($ million)

8. Market Segmentation by Application

8.1 Market segments

Chart on Application - Market share 2024-2029 (%)
Data Table on Application - Market share 2024-2029 (%)

8.2 Comparison by Application

Chart on Comparison by Application
Data Table on Comparison by Application

8.3 Demand planning and forecasting - Market size and forecast 2024-2029

Chart on Demand planning and forecasting - Market size and forecast 2024-2029 ($ million)
Data Table on Demand planning and forecasting - Market size and forecast 2024-2029 ($ million)
Chart on Demand planning and forecasting - Year-over-year growth 2024-2029 (%)
Data Table on Demand planning and forecasting - Year-over-year growth 2024-2029 (%)

8.4 Inventory management - Market size and forecast 2024-2029

Chart on Inventory management - Market size and forecast 2024-2029 ($ million)
Data Table on Inventory management - Market size and forecast 2024-2029 ($ million)
Chart on Inventory management - Year-over-year growth 2024-2029 (%)
Data Table on Inventory management - Year-over-year growth 2024-2029 (%)

8.5 Transportation management - Market size and forecast 2024-2029

Chart on Transportation management - Market size and forecast 2024-2029 ($ million)
Data Table on Transportation management - Market size and forecast 2024-2029 ($ million)
Chart on Transportation management - Year-over-year growth 2024-2029 (%)
Data Table on Transportation management - Year-over-year growth 2024-2029 (%)

8.6 Others - Market size and forecast 2024-2029

Chart on Others - Market size and forecast 2024-2029 ($ million)
Data Table on Others - Market size and forecast 2024-2029 ($ million)
Chart on Others - Year-over-year growth 2024-2029 (%)
Data Table on Others - Year-over-year growth 2024-2029 (%)

8.7 Market opportunity by Application

Market opportunity by Application ($ million)
Data Table on Market opportunity by Application ($ million)

9. Market Segmentation by Deployment

9.1 Market segments

Chart on Deployment - Market share 2024-2029 (%)
Data Table on Deployment - Market share 2024-2029 (%)

9.2 Comparison by Deployment

Chart on Comparison by Deployment
Data Table on Comparison by Deployment

9.3 Cloud-based - Market size and forecast 2024-2029

Chart on Cloud-based - Market size and forecast 2024-2029 ($ million)
Data Table on Cloud-based - Market size and forecast 2024-2029 ($ million)
Chart on Cloud-based - Year-over-year growth 2024-2029 (%)
Data Table on Cloud-based - Year-over-year growth 2024-2029 (%)

9.4 On-premises - Market size and forecast 2024-2029

Chart on On-premises - Market size and forecast 2024-2029 ($ million)
Data Table on On-premises - Market size and forecast 2024-2029 ($ million)
Chart on On-premises - Year-over-year growth 2024-2029 (%)
Data Table on On-premises - Year-over-year growth 2024-2029 (%)

9.5 Hybrid - Market size and forecast 2024-2029

Chart on Hybrid - Market size and forecast 2024-2029 ($ million)
Data Table on Hybrid - Market size and forecast 2024-2029 ($ million)
Chart on Hybrid - Year-over-year growth 2024-2029 (%)
Data Table on Hybrid - Year-over-year growth 2024-2029 (%)

9.6 Market opportunity by Deployment

Market opportunity by Deployment ($ million)
Data Table on Market opportunity by Deployment ($ million)

10. Customer Landscape

10.1 Customer landscape overview

Analysis of price sensitivity, lifecycle, customer purchase basket, adoption rates, and purchase criteria

11. Geographic Landscape

11.1 Geographic segmentation

Chart on Market share by geography 2024-2029 (%)
Data Table on Market share by geography 2024-2029 (%)

11.2 Geographic comparison

Chart on Geographic comparison
Data Table on Geographic comparison

11.3 North America - Market size and forecast 2024-2029

Chart on North America - Market size and forecast 2024-2029 ($ million)
Data Table on North America - Market size and forecast 2024-2029 ($ million)
Chart on North America - Year-over-year growth 2024-2029 (%)
Data Table on North America - Year-over-year growth 2024-2029 (%)
Chart on Regional Comparison - North America
Data Table on Regional Comparison - North America

11.3.1 US - Market size and forecast 2024-2029

Chart on US - Market size and forecast 2024-2029 ($ million)
Data Table on US - Market size and forecast 2024-2029 ($ million)
Chart on US - Year-over-year growth 2024-2029 (%)
Data Table on US - Year-over-year growth 2024-2029 (%)

11.3.2 Canada - Market size and forecast 2024-2029

Chart on Canada - Market size and forecast 2024-2029 ($ million)
Data Table on Canada - Market size and forecast 2024-2029 ($ million)
Chart on Canada - Year-over-year growth 2024-2029 (%)
Data Table on Canada - Year-over-year growth 2024-2029 (%)

11.3.3 Mexico - Market size and forecast 2024-2029

Chart on Mexico - Market size and forecast 2024-2029 ($ million)
Data Table on Mexico - Market size and forecast 2024-2029 ($ million)
Chart on Mexico - Year-over-year growth 2024-2029 (%)
Data Table on Mexico - Year-over-year growth 2024-2029 (%)

11.4 Europe - Market size and forecast 2024-2029

Chart on Europe - Market size and forecast 2024-2029 ($ million)
Data Table on Europe - Market size and forecast 2024-2029 ($ million)
Chart on Europe - Year-over-year growth 2024-2029 (%)
Data Table on Europe - Year-over-year growth 2024-2029 (%)
Chart on Regional Comparison - Europe
Data Table on Regional Comparison - Europe

11.4.1 Germany - Market size and forecast 2024-2029

Chart on Germany - Market size and forecast 2024-2029 ($ million)
Data Table on Germany - Market size and forecast 2024-2029 ($ million)
Chart on Germany - Year-over-year growth 2024-2029 (%)
Data Table on Germany - Year-over-year growth 2024-2029 (%)

11.4.2 UK - Market size and forecast 2024-2029

Chart on UK - Market size and forecast 2024-2029 ($ million)
Data Table on UK - Market size and forecast 2024-2029 ($ million)
Chart on UK - Year-over-year growth 2024-2029 (%)
Data Table on UK - Year-over-year growth 2024-2029 (%)

11.4.3 France - Market size and forecast 2024-2029

Chart on France - Market size and forecast 2024-2029 ($ million)
Data Table on France - Market size and forecast 2024-2029 ($ million)
Chart on France - Year-over-year growth 2024-2029 (%)
Data Table on France - Year-over-year growth 2024-2029 (%)

11.4.4 Italy - Market size and forecast 2024-2029

Chart on Italy - Market size and forecast 2024-2029 ($ million)
Data Table on Italy - Market size and forecast 2024-2029 ($ million)
Chart on Italy - Year-over-year growth 2024-2029 (%)
Data Table on Italy - Year-over-year growth 2024-2029 (%)

11.4.5 Spain - Market size and forecast 2024-2029

Chart on Spain - Market size and forecast 2024-2029 ($ million)
Data Table on Spain - Market size and forecast 2024-2029 ($ million)
Chart on Spain - Year-over-year growth 2024-2029 (%)
Data Table on Spain - Year-over-year growth 2024-2029 (%)

11.4.6 The Netherlands - Market size and forecast 2024-2029

Chart on The Netherlands - Market size and forecast 2024-2029 ($ million)
Data Table on The Netherlands - Market size and forecast 2024-2029 ($ million)
Chart on The Netherlands - Year-over-year growth 2024-2029 (%)
Data Table on The Netherlands - Year-over-year growth 2024-2029 (%)

11.5 APAC - Market size and forecast 2024-2029

Chart on APAC - Market size and forecast 2024-2029 ($ million)
Data Table on APAC - Market size and forecast 2024-2029 ($ million)
Chart on APAC - Year-over-year growth 2024-2029 (%)
Data Table on APAC - Year-over-year growth 2024-2029 (%)
Chart on Regional Comparison - APAC
Data Table on Regional Comparison - APAC

11.5.1 China - Market size and forecast 2024-2029

Chart on China - Market size and forecast 2024-2029 ($ million)
Data Table on China - Market size and forecast 2024-2029 ($ million)
Chart on China - Year-over-year growth 2024-2029 (%)
Data Table on China - Year-over-year growth 2024-2029 (%)

11.5.2 Japan - Market size and forecast 2024-2029

Chart on Japan - Market size and forecast 2024-2029 ($ million)
Data Table on Japan - Market size and forecast 2024-2029 ($ million)
Chart on Japan - Year-over-year growth 2024-2029 (%)
Data Table on Japan - Year-over-year growth 2024-2029 (%)

11.5.3 India - Market size and forecast 2024-2029

Chart on India - Market size and forecast 2024-2029 ($ million)
Data Table on India - Market size and forecast 2024-2029 ($ million)
Chart on India - Year-over-year growth 2024-2029 (%)
Data Table on India - Year-over-year growth 2024-2029 (%)

11.5.4 South Korea - Market size and forecast 2024-2029

Chart on South Korea - Market size and forecast 2024-2029 ($ million)
Data Table on South Korea - Market size and forecast 2024-2029 ($ million)
Chart on South Korea - Year-over-year growth 2024-2029 (%)
Data Table on South Korea - Year-over-year growth 2024-2029 (%)

11.5.5 Australia - Market size and forecast 2024-2029

Chart on Australia - Market size and forecast 2024-2029 ($ million)
Data Table on Australia - Market size and forecast 2024-2029 ($ million)
Chart on Australia - Year-over-year growth 2024-2029 (%)
Data Table on Australia - Year-over-year growth 2024-2029 (%)

11.5.6 Indonesia - Market size and forecast 2024-2029

Chart on Indonesia - Market size and forecast 2024-2029 ($ million)
Data Table on Indonesia - Market size and forecast 2024-2029 ($ million)
Chart on Indonesia - Year-over-year growth 2024-2029 (%)
Data Table on Indonesia - Year-over-year growth 2024-2029 (%)

11.6 South America - Market size and forecast 2024-2029

Chart on South America - Market size and forecast 2024-2029 ($ million)
Data Table on South America - Market size and forecast 2024-2029 ($ million)
Chart on South America - Year-over-year growth 2024-2029 (%)
Data Table on South America - Year-over-year growth 2024-2029 (%)
Chart on Regional Comparison - South America
Data Table on Regional Comparison - South America

11.6.1 Brazil - Market size and forecast 2024-2029

Chart on Brazil - Market size and forecast 2024-2029 ($ million)
Data Table on Brazil - Market size and forecast 2024-2029 ($ million)
Chart on Brazil - Year-over-year growth 2024-2029 (%)
Data Table on Brazil - Year-over-year growth 2024-2029 (%)

11.6.2 Argentina - Market size and forecast 2024-2029

Chart on Argentina - Market size and forecast 2024-2029 ($ million)
Data Table on Argentina - Market size and forecast 2024-2029 ($ million)
Chart on Argentina - Year-over-year growth 2024-2029 (%)
Data Table on Argentina - Year-over-year growth 2024-2029 (%)

11.6.3 Colombia - Market size and forecast 2024-2029

Chart on Colombia - Market size and forecast 2024-2029 ($ million)
Data Table on Colombia - Market size and forecast 2024-2029 ($ million)
Chart on Colombia - Year-over-year growth 2024-2029 (%)
Data Table on Colombia - Year-over-year growth 2024-2029 (%)

11.7 Middle East and Africa - Market size and forecast 2024-2029

Chart on Middle East and Africa - Market size and forecast 2024-2029 ($ million)
Data Table on Middle East and Africa - Market size and forecast 2024-2029 ($ million)
Chart on Middle East and Africa - Year-over-year growth 2024-2029 (%)
Data Table on Middle East and Africa - Year-over-year growth 2024-2029 (%)
Chart on Regional Comparison - Middle East and Africa
Data Table on Regional Comparison - Middle East and Africa

11.7.1 UAE - Market size and forecast 2024-2029

Chart on UAE - Market size and forecast 2024-2029 ($ million)
Data Table on UAE - Market size and forecast 2024-2029 ($ million)
Chart on UAE - Year-over-year growth 2024-2029 (%)
Data Table on UAE - Year-over-year growth 2024-2029 (%)

11.7.2 Saudi Arabia - Market size and forecast 2024-2029

Chart on Saudi Arabia - Market size and forecast 2024-2029 ($ million)
Data Table on Saudi Arabia - Market size and forecast 2024-2029 ($ million)
Chart on Saudi Arabia - Year-over-year growth 2024-2029 (%)
Data Table on Saudi Arabia - Year-over-year growth 2024-2029 (%)

11.7.3 South Africa - Market size and forecast 2024-2029

Chart on South Africa - Market size and forecast 2024-2029 ($ million)
Data Table on South Africa - Market size and forecast 2024-2029 ($ million)
Chart on South Africa - Year-over-year growth 2024-2029 (%)
Data Table on South Africa - Year-over-year growth 2024-2029 (%)

11.7.4 Israel - Market size and forecast 2024-2029

Chart on Israel - Market size and forecast 2024-2029 ($ million)
Data Table on Israel - Market size and forecast 2024-2029 ($ million)
Chart on Israel - Year-over-year growth 2024-2029 (%)
Data Table on Israel - Year-over-year growth 2024-2029 (%)

11.7.5 Egypt - Market size and forecast 2024-2029

Chart on Egypt - Market size and forecast 2024-2029 ($ million)
Data Table on Egypt - Market size and forecast 2024-2029 ($ million)
Chart on Egypt - Year-over-year growth 2024-2029 (%)
Data Table on Egypt - Year-over-year growth 2024-2029 (%)

11.8 Market opportunity by geography

Market opportunity by geography ($ million)
Data Tables on Market opportunity by geography ($ million)

12. Drivers, Challenges, and Opportunity

12.1 Market drivers

Increasing demand for enhanced visibility and transparency
Proliferation of e-commerce and shifting consumer expectations
Imperative for cost reduction and enhanced operational efficiency

12.2 Market challenges

Data security, integration, and regulatory compliance
High implementation costs and uncertain return on investment
Talent gap and workforce transformation

12.3 Impact of drivers and challenges

Impact of drivers and challenges in 2024 and 2029

12.4 Market opportunities

Proliferation of generative AI in supply chain operations
Advanced predictive analytics for enhanced resilience and efficiency
Hyper-automation and rise of intelligent robotics

13. Competitive Landscape

13.1 Overview

13.2

Overview on criticality of inputs and factors of differentiation

13.3 Landscape disruption

Overview on factors of disruption

13.4 Industry risks

Impact of key risks on business

14. Competitive Analysis

14.1 Companies profiled

Companies covered

14.2 Company ranking index

14.3 Market positioning of companies

Matrix on companies position and classification

14.4 Alibaba Group Holding Ltd.

Alibaba Group Holding Ltd. - Overview
Alibaba Group Holding Ltd. - Business segments
Alibaba Group Holding Ltd. - Key news
Alibaba Group Holding Ltd. - Key offerings
Alibaba Group Holding Ltd. - Segment focus
SWOT

14.5 Amazon Web Services Inc.

Amazon Web Services Inc. - Overview
Amazon Web Services Inc. - Product / Service
Amazon Web Services Inc. - Key news
Amazon Web Services Inc. - Key offerings
SWOT

14.6 Blue Yonder Group Inc.

Blue Yonder Group Inc. - Overview
Blue Yonder Group Inc. - Product / Service
Blue Yonder Group Inc. - Key offerings
SWOT

14.7 Coupa Software Inc.

Coupa Software Inc. - Overview
Coupa Software Inc. - Product / Service
Coupa Software Inc. - Key offerings
SWOT

14.8 E2open Parent Holdings Inc.

E2open Parent Holdings Inc. - Overview
E2open Parent Holdings Inc. - Product / Service
E2open Parent Holdings Inc. - Key news
E2open Parent Holdings Inc. - Key offerings
SWOT

14.9 Fourkites Inc.

Fourkites Inc. - Overview
Fourkites Inc. - Product / Service
Fourkites Inc. - Key offerings
SWOT

14.10 Google LLC

Google LLC - Overview
Google LLC - Product / Service
Google LLC - Key offerings
SWOT

14.11 Infor Inc.

Infor Inc. - Overview
Infor Inc. - Product / Service
Infor Inc. - Key news
Infor Inc. - Key offerings
SWOT

14.12 IBM Corp.

IBM Corp. - Overview
IBM Corp. - Business segments
IBM Corp. - Key news
IBM Corp. - Key offerings
IBM Corp. - Segment focus
SWOT

14.13 Kinaxis Inc.

Kinaxis Inc. - Overview
Kinaxis Inc. - Product / Service
Kinaxis Inc. - Key news
Kinaxis Inc. - Key offerings
SWOT

14.14 Microsoft Corp.

Microsoft Corp. - Overview
Microsoft Corp. - Business segments
Microsoft Corp. - Key news
Microsoft Corp. - Key offerings
Microsoft Corp. - Segment focus
SWOT

14.15 Oracle Corp.

Oracle Corp. - Overview
Oracle Corp. - Business segments
Oracle Corp. - Key news
Oracle Corp. - Key offerings
Oracle Corp. - Segment focus
SWOT

14.16 Samsung SDS

Samsung SDS - Overview
Samsung SDS - Product / Service
Samsung SDS - Key offerings
SWOT

14.17 SAP SE

SAP SE - Overview
SAP SE - Business segments
SAP SE - Key news
SAP SE - Key offerings
SAP SE - Segment focus
SWOT

14.18 Siemens AG

Siemens AG - Overview
Siemens AG - Business segments
Siemens AG - Key news
Siemens AG - Key offerings
Siemens AG - Segment focus
SWOT

15. Appendix

15.1 Scope of the report

Market definition
Objectives
Notes and caveats

15.2 Inclusions and exclusions checklist

Inclusions checklist
Exclusions checklist

15.3 Currency conversion rates for US$

15.4 Research methodology

15.5 Data procurement

Information sources

15.6 Data validation

15.7 Validation techniques employed for market sizing

15.8 Data synthesis

15.9 360 degree market analysis

15.10 List of abbreviations

Research Methodology

Technavio presents a detailed picture of the market by way of study, synthesis, and summation of data from multiple sources. The analysts have presented the various facets of the market with a particular focus on identifying the key industry influencers. The data thus presented is comprehensive, reliable, and the result of extensive research, both primary and secondary.

INFORMATION SOURCES

Primary sources

  • Manufacturers and suppliers
  • Channel partners
  • Industry experts
  • Strategic decision makers

Secondary sources

  • Industry journals and periodicals
  • Government data
  • Financial reports of key industry players
  • Historical data
  • Press releases

DATA ANALYSIS

Data Synthesis

  • Collation of data
  • Estimation of key figures
  • Analysis of derived insights

Data Validation

  • Triangulation with data models
  • Reference against proprietary databases
  • Corroboration with industry experts

REPORT WRITING

Qualitative

  • Market drivers
  • Market challenges
  • Market trends
  • Five forces analysis

Quantitative

  • Market size and forecast
  • Market segmentation
  • Geographical insights
  • Competitive landscape

Interested in this report?

Get your sample now to see our research methodology and insights!

Download Now

Frequently Asked Questions

AI In Supply Chain Management market growth will increase by USD 19408.3 million during 2025-2029 .

The AI In Supply Chain Management market is expected to grow at a CAGR of 25.4% during 2025-2029 .

AI In Supply Chain Management market is segmented by Component (Software, Services, Hardware) Application (Demand planning and forecasting, Inventory management, Transportation management, Others) Deployment (Cloud-based, On-premises, Hybrid)

Alibaba Group Holding Ltd., Amazon Web Services Inc., Blue Yonder Group Inc., Coupa Software Inc., Descartes Systems Group Inc., DHL International GmbH, E2open Parent Holdings Inc., Fourkites Inc., Google LLC, Infor Inc., IBM Corp., Kinaxis Inc., Manhattan Associates Inc., Microsoft Corp., Oracle Corp., Samsung SDS, SAP SE, Siemens AG are a few of the key vendors in the AI In Supply Chain Management market.

North America will register the highest growth rate of 32.6% among the other regions. Therefore, the AI In Supply Chain Management market in North America is expected to garner significant business opportunities for the vendors during the forecast period.

US, Canada, Mexico, Germany, UK, France, Italy, Spain, The Netherlands, China, Japan, India, South Korea, Australia, Indonesia, Brazil, Argentina, Colombia, UAE, Saudi Arabia, South Africa, Israel, Egypt

  • Increasing demand for enhanced visibility and transparency is the driving factor this market.

The AI In Supply Chain Management market vendors should focus on grabbing business opportunities from the Component segment as it accounted for the largest market share in the base year.