AI In Transportation Market Analysis, Size, and Forecast 2026-2030: North America (US, Canada, and Mexico), Europe (Germany, UK, and France), APAC (China, Japan, and India), Middle East and Africa (Saudi Arabia, UAE, and South Africa), South America (Brazil and Argentina), and Rest of World (ROW)

AI In Transportation Market Analysis, Size, and Forecast 2026-2030:
North America (US, Canada, and Mexico), Europe (Germany, UK, and France), APAC (China, Japan, and India), Middle East and Africa (Saudi Arabia, UAE, and South Africa), South America (Brazil and Argentina), and Rest of World (ROW)

Published: Apr 2026 314 Pages SKU: IRTNTR80725

Market Overview at a Glance

$6.68 B
Market Opportunity
19.9%
CAGR 2025 - 2030
41.4%
North America Growth
$1.97 B
Hardware segment 2024

AI In Transportation Market Size 2026-2030

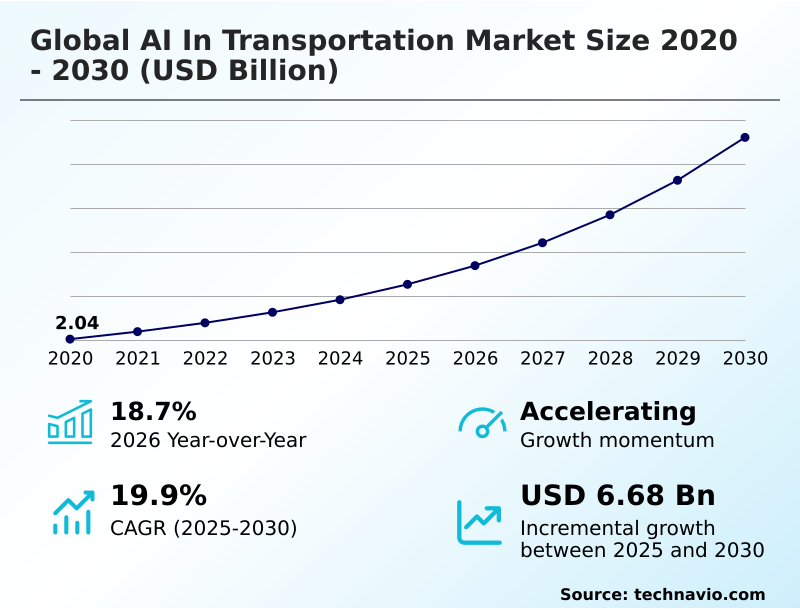
The ai in transportation market size is valued to increase by USD 6.68 billion, at a CAGR of 19.9% from 2025 to 2030. Escalating urban congestion and mandate for enhanced traffic flow efficiency will drive the ai in transportation market.

Major Market Trends & Insights

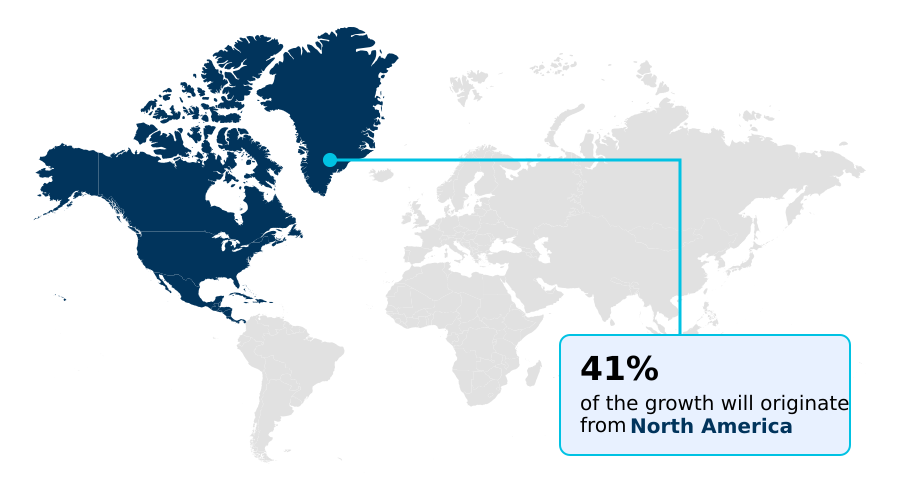
  • North America dominated the market and accounted for a 41.4% growth during the forecast period.
  • By Component - Hardware segment was valued at USD 1.97 billion in 2024
  • By Application - Autonomous vehicles segment accounted for the largest market revenue share in 2024

Market Size & Forecast

  • Market Opportunities: USD 9.17 billion
  • Market Future Opportunities: USD 6.68 billion
  • CAGR from 2025 to 2030 : 19.9%

Market Summary

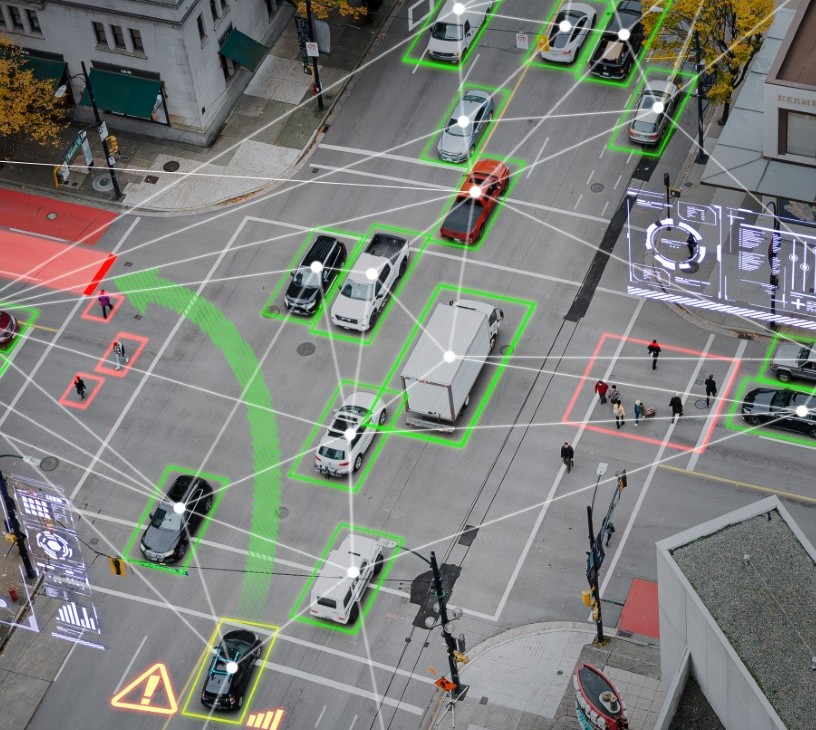
  • The AI in transportation market is fundamentally reshaping mobility and logistics through advanced computational intelligence. This transformation is driven by the escalating need for safer, more efficient, and sustainable transport networks.
  • Key applications include autonomous vehicles that use sensor fusion and machine learning to navigate complex environments, intelligent traffic management systems that alleviate urban congestion, and AI-powered logistics platforms that optimize global supply chains.
  • For instance, a freight company can leverage AI to analyze real-time traffic, weather, and delivery schedules, automatically rerouting its entire fleet to minimize fuel consumption and ensure on-time arrivals. While the potential benefits are immense, the industry also navigates significant challenges, including evolving regulatory frameworks, ensuring data privacy, and the high capital investment required for infrastructure modernization.
  • The continued advancement of technologies like deep learning and computer vision promises to unlock new capabilities, from predictive maintenance that prevents vehicle downtime to personalized mobility services that enhance the passenger experience. This technological evolution is fostering a dynamic ecosystem where innovation in algorithms and hardware is paramount for competitive advantage and operational excellence.

What will be the Size of the AI In Transportation Market during the forecast period?

Get Key Insights on Market Forecast (PDF) Get Free Sample

How is the AI In Transportation Market Segmented?

The ai in transportation industry research report provides comprehensive data (region-wise segment analysis), with forecasts and estimates in "USD million" for the period 2026-2030, as well as historical data from 2020-2024 for the following segments.

  • Component
    • Hardware
    • Software
    • Services
  • Application
    • Autonomous vehicles
    • Traffic management
    • Freight management
    • Predictive maintenance
    • Others
  • Technology
    • Machine learning
    • Deep learning
    • Computer vision
    • Natural language processing
    • Context aware computing
  • Geography
    • North America
      • US
      • Canada
      • Mexico
    • Europe
      • Germany
      • UK
      • France
    • APAC
      • China
      • Japan
      • India
    • Middle East and Africa
      • Saudi Arabia
      • UAE
      • South Africa
    • South America
      • Brazil
      • Argentina
    • Rest of World (ROW)

By Component Insights

The hardware segment is estimated to witness significant growth during the forecast period.

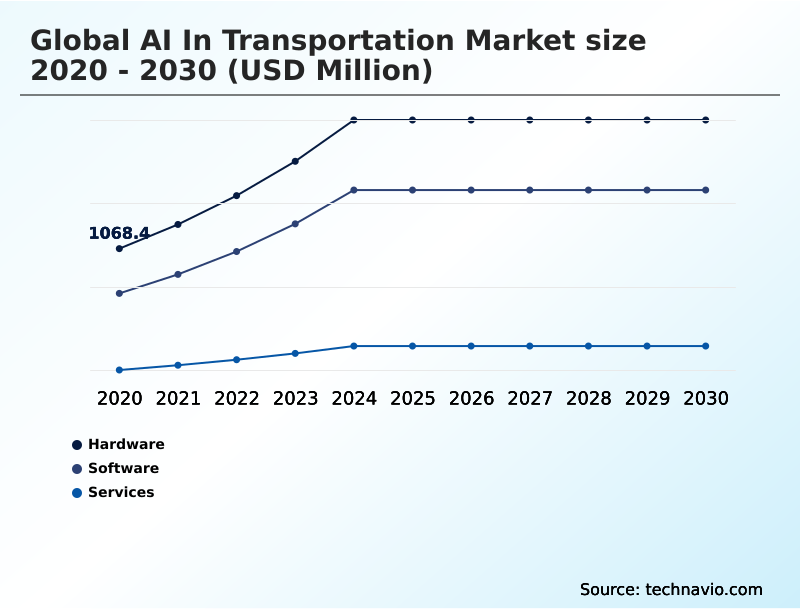
The hardware segment serves as the physical backbone for the global AI in transportation market 2026-2030, enabling complex operations from logistics fulfillment to enhanced road safety.

This includes high-performance computing units essential for deep learning and computer vision tasks, alongside a suite of sensors for environmental perception.

The increasing demand to mitigate urban congestion and improve traffic flow efficiency drives innovation in edge computing devices, which process data locally to reduce latency for critical applications like autonomous navigation systems.

As the industry advances, the focus shifts toward specialized processors that support real-time predictive maintenance and reduce human error.

These integrated systems are foundational to developing solutions that address complex supply chain solutions, with component-level processing speeds improving by over 20% in recent designs.

Get Free Sample

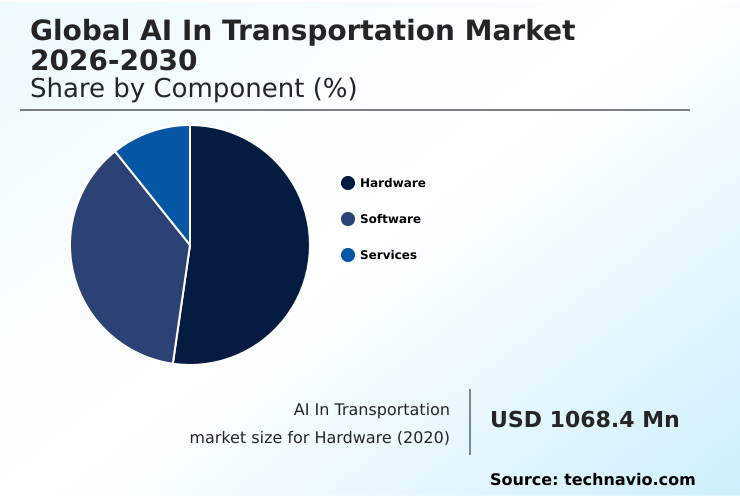
The Hardware segment was valued at USD 1.97 billion in 2024 and showed a gradual increase during the forecast period.

Get Free Sample

Regional Analysis

North America is estimated to contribute 41.4% to the growth of the global market during the forecast period.Technavio’s analysts have elaborately explained the regional trends and drivers that shape the market during the forecast period.

See How AI In Transportation Market Demand is Rising in North America Get Free Sample

The global AI in transportation market 2026-2030 is geographically diverse, with North America leading, contributing over 41% of incremental growth, driven by advanced R&D in connected car platforms and mobility as a service.

The region's leadership is built on sophisticated machine learning applications and robust telematics networks. Europe follows, with a strong focus on regulatory frameworks supporting public transit optimization and rail automation.

Meanwhile, APAC is the fastest-growing region, aggressively implementing smart city infrastructure and V2X communications to manage urban expansion. In these smart cities, AI-powered route optimization has demonstrated the ability to improve traffic flow by nearly 25%.

This global expansion relies on technologies like sensor fusion, digital twins for simulation, and natural language processing for user interfaces, addressing both commercial and passenger-focused asset lifecycle optimization.

Market Dynamics

Our researchers analyzed the data with 2025 as the base year, along with the key drivers, trends, and challenges. A holistic analysis of drivers will help companies refine their marketing strategies to gain a competitive advantage.

  • The evolution of the global AI in transportation market 2026-2030 is marked by a wide array of specialized applications designed to enhance safety and efficiency. The implementation of AI for real-time traffic control and dynamic traffic signal optimization is critical for reducing urban congestion with AI.
  • In logistics, deep learning in autonomous trucking and AI algorithms for demand forecasting are revolutionizing how goods are moved, while intelligent speed assistance systems and automated freight platooning efficiency promise further gains. Safety remains a paramount concern, addressed by technologies like V2X for intersection safety, computer vision for pedestrian detection, and robust AI-based fleet safety monitoring.
  • Driver drowsiness detection systems are becoming standard in commercial fleets, contributing to a significant reduction in fatigue-related incidents compared to vehicles without such monitoring. The scope of innovation extends to predictive maintenance for rail networks, where digital twin for vehicle simulation helps anticipate failures.
  • On the consumer side, natural language processing for infotainment is improving the in-vehicle experience, while AI in public transit scheduling and last-mile delivery drone coordination are reshaping urban mobility. Even administrative functions like managing supply chain with AI and deploying AI-powered toll collection systems are becoming more intelligent and automated.

What are the key market drivers leading to the rise in the adoption of AI In Transportation Industry?

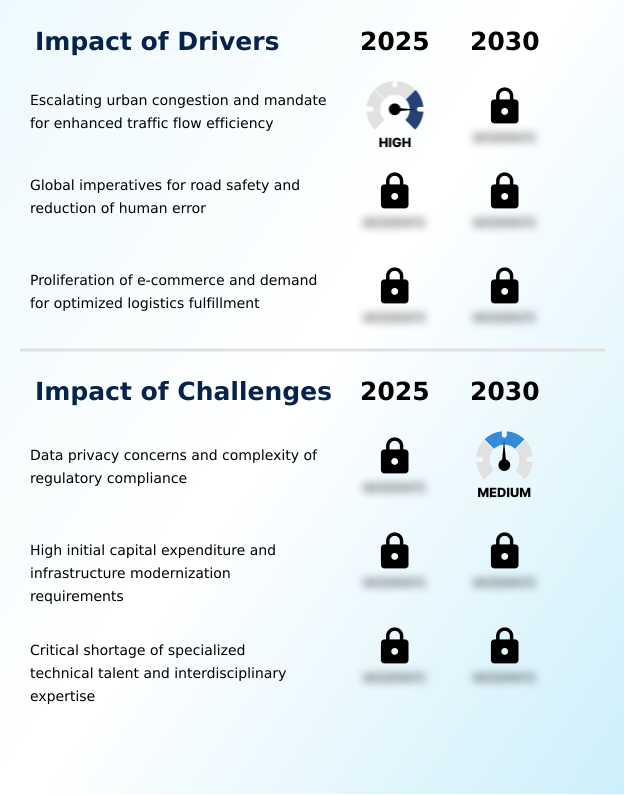
  • Escalating urban congestion and the mandate for enhanced traffic flow efficiency are key drivers propelling market growth.

  • The primary drivers for the global AI in transportation market 2026-2030 are the pressing needs for efficiency, safety, and sustainability.
  • Intelligent traffic management systems are being deployed globally to combat urban density, leveraging path planning algorithms to improve vehicle flow by over 20%.
  • The push for enhanced safety is fueling the adoption of driver monitoring systems, which use real-time data processing to detect and alert for fatigue.
  • In public and commercial sectors, robotic process automation and automated traffic enforcement are streamlining operations and ensuring compliance, while transport planning software helps design smarter, more resilient networks.
  • The growth of e-commerce necessitates advanced smart mobility solutions and connected operations platforms to manage logistics.
  • This is driving investment in on-demand transit and intelligent transport systems, with a clear focus on mobility risk management and the efficiency gains from technologies like rail automation.

What are the market trends shaping the AI In Transportation Industry?

  • The integration of autonomous navigation systems and advanced driver-assistance functionalities is emerging as a significant trend. This development is shaping the future of mobility and vehicle automation.

  • Key trends shaping the global AI in transportation market 2026-2030 center on increasing autonomy and operational intelligence. The proliferation of advanced driver assistance systems that incorporate automated emergency braking is a critical step toward broader adoption of autonomous trucking and driverless ride-hailing services. These systems directly address safety, with some achieving a 40% reduction in specific types of collisions.
  • In parallel, logistics optimization is being revolutionized by AI-powered freight management, where demand forecasting models have improved accuracy by up to 25%. This enables more efficient fleet management and last-mile delivery. The convergence of these trends is facilitated by an autonomous freight network and V2X (Vehicle-to-Everything) communication, creating a connected ecosystem where passenger information systems provide real-time, dynamic updates.

What challenges does the AI In Transportation Industry face during its growth?

  • Data privacy concerns and the complexity of regulatory compliance present a key challenge affecting industry growth.

  • Navigating the challenges of the global AI in transportation market 2026-2030 requires addressing complex technical and operational hurdles. The need for high-quality data annotation to train reliable models is a significant bottleneck, with costs increasing project budgets by up to 30% in some cases.
  • Developing a robust AI-native operating system demands significant high-performance computing resources and a high degree of interdisciplinary expertise, a resource for which demand outstrips supply by nearly five to one. Furthermore, ensuring situational awareness in diverse conditions is a constant challenge, alongside managing data privacy concerns which necessitate advanced data anonymization techniques.
  • The substantial cost of infrastructure modernization and regulatory compliance adds another layer of complexity. Firms must balance these challenges with the push for innovation in operational analytics, predictive analytics, and automated haulage to maintain a competitive edge.

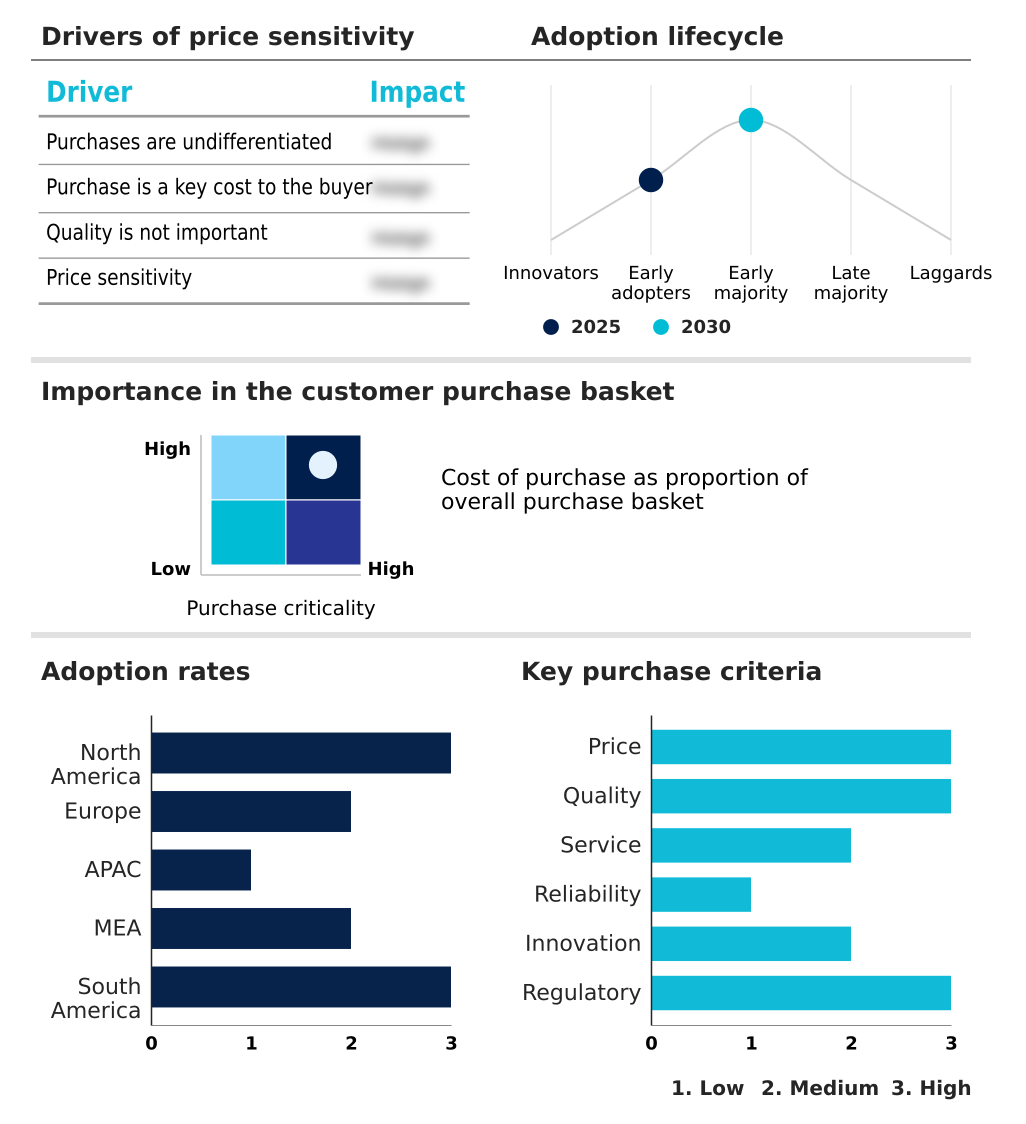
Exclusive Technavio Analysis on Customer Landscape

The ai in transportation market forecasting report includes the adoption lifecycle of the market, covering from the innovator’s stage to the laggard’s stage. It focuses on adoption rates in different regions based on penetration. Furthermore, the ai in transportation market report also includes key purchase criteria and drivers of price sensitivity to help companies evaluate and develop their market growth analysis strategies.

Customer Landscape of AI In Transportation Industry

Competitive Landscape

Companies are implementing various strategies, such as strategic alliances, ai in transportation market forecast, partnerships, mergers and acquisitions, geographical expansion, and product/service launches, to enhance their presence in the industry.

Derq Inc. - The company offers AI in transportation through intelligent transportation systems that use computer vision and predictive analytics to monitor road users, optimize traffic flow, and prevent collisions using real-time data insights.

The industry research and growth report includes detailed analyses of the competitive landscape of the market and information about key companies, including:

  • Derq Inc.
  • Descartes Systems Group Inc.
  • Einride AB
  • Geotab Inc.
  • Hayden AI Technologies Inc.
  • Hitachi Ltd.
  • Motive Technologies Inc.
  • NetraDyne Inc.
  • Nuro Inc.
  • PlusAI Inc.
  • PTV Planung Transport Verkehr
  • Samba Holdings Inc.
  • Samsara Inc.
  • Siemens AG
  • Tesla Inc.
  • Transporeon GmbH
  • Via Transportation Inc.
  • Waabi
  • Waymo LLC

Qualitative and quantitative analysis of companies has been conducted to help clients understand the wider business environment as well as the strengths and weaknesses of key industry players. Data is qualitatively analyzed to categorize companies as pure play, category-focused, industry-focused, and diversified; it is quantitatively analyzed to categorize companies as dominant, leading, strong, tentative, and weak.

Recent Development and News in Ai in transportation market

  • In April 2025, The European Commission ratified the Pan-European Autonomous Mobility Act, establishing a unified regulatory framework for Level 4 and Level 5 autonomous systems across all member states to streamline cross-border deployment.
  • In February 2025, Waymo LLC announced a significant software update for its Waymo Driver technology, enhancing its performance in adverse weather conditions and complex urban environments based on data from millions of driven miles.
  • In November 2024, Einride AB secured a new funding round to accelerate the deployment of its autonomous electric trucks and charging infrastructure across key logistics corridors in North America and Europe.
  • In September 2024, Siemens AG partnered with a major US city to implement its AI-powered traffic management platform, which aims to reduce urban congestion and improve traffic flow during peak hours.

Dive into Technavio’s robust research methodology, blending expert interviews, extensive data synthesis, and validated models for unparalleled AI In Transportation Market insights. See full methodology.

Market Scope
Page number 314
Base year 2025
Historic period 2020-2024
Forecast period 2026-2030
Growth momentum & CAGR Accelerate at a CAGR of 19.9%
Market growth 2026-2030 USD 6681.4 million
Market structure Fragmented
YoY growth 2025-2026(%) 18.7%
Key countries US, Canada, Mexico, Germany, UK, France, Italy, Spain, The Netherlands, China, Japan, India, South Korea, Australia, Indonesia, Saudi Arabia, UAE, South Africa, Israel, Turkey, Brazil, Argentina and Chile
Competitive landscape Leading Companies, Market Positioning of Companies, Competitive Strategies, and Industry Risks

Request Free Sample

Research Analyst Overview

  • The global AI in transportation market 2026-2030 is defined by the convergence of high-performance computing, sophisticated path planning algorithms, and real-time data processing. Core technologies such as machine learning and deep learning form the basis for systems that deliver situational awareness and operational analytics, enabling applications from autonomous trucking to automated haulage.
  • The integration of sensor fusion platforms with computer vision and telematics allows for precise environmental interpretation, crucial for collision avoidance and advanced driver assistance systems. This technological synergy is driving a shift toward proactive operational strategies, exemplified by predictive maintenance and predictive analytics, which have been shown to reduce unplanned asset downtime by over 30%.
  • Furthermore, innovations in natural language processing and facial recognition are enhancing user interaction and security. The development of AI-native operating systems and digital twins supports scalable solutions for fleet management, freight management, and logistics optimization, while V2X communications and edge computing provide the low-latency connectivity required for smart mobility and intelligent traffic management.
  • Success hinges on mastering these interconnected technologies, including data annotation and robotic process automation, to deliver reliable and efficient transportation solutions.

What are the Key Data Covered in this AI In Transportation Market Research and Growth Report?

  • What is the expected growth of the AI In Transportation Market between 2026 and 2030?

    • USD 6.68 billion, at a CAGR of 19.9%

  • What segmentation does the market report cover?

    • The report is segmented by Component (Hardware, Software, and Services), Application (Autonomous vehicles, Traffic management, Freight management, Predictive maintenance, and Others), Technology (Machine learning, Deep learning, Computer vision, Natural language processing, and Context aware computing) and Geography (North America, Europe, APAC, Middle East and Africa, South America)

  • Which regions are analyzed in the report?

    • North America, Europe, APAC, Middle East and Africa and South America

  • What are the key growth drivers and market challenges?

    • Escalating urban congestion and mandate for enhanced traffic flow efficiency, Data privacy concerns and complexity of regulatory compliance

  • Who are the major players in the AI In Transportation Market?

    • Derq Inc., Descartes Systems Group Inc., Einride AB, Geotab Inc., Hayden AI Technologies Inc., Hitachi Ltd., Motive Technologies Inc., NetraDyne Inc., Nuro Inc., PlusAI Inc., PTV Planung Transport Verkehr, Samba Holdings Inc., Samsara Inc., Siemens AG, Tesla Inc., Transporeon GmbH, Via Transportation Inc., Waabi and Waymo LLC

Market Research Insights

  • The market's dynamic landscape is shaped by the tangible efficiencies AI delivers, with implementations of connected car platforms showing a significant reduction in operational costs. Firms leveraging mobility as a service models report higher asset utilization rates compared to traditional transport fleets.
  • The strategic deployment for public transit optimization in smart city infrastructure is reducing commute times by over 15% in pilot programs. Furthermore, a focus on asset lifecycle optimization through AI has decreased maintenance expenditures by up to 30% for early adopters.
  • This quantifiable return on investment is accelerating the integration of AI-driven last-mile delivery orchestration and other advanced supply chain solutions.

We can help! Our analysts can customize this ai in transportation market research report to meet your requirements.

Get in touch

1. Executive Summary

1.1 Market overview

Executive Summary - Chart on Market Overview
Executive Summary - Data Table on Market Overview
Executive Summary - Chart on Global Market Characteristics
Executive Summary - Chart on Market by Geography
Executive Summary - Chart on Market Segmentation by Component
Executive Summary - Chart on Market Segmentation by Application
Executive Summary - Chart on Market Segmentation by Technology
Executive Summary - Chart on Incremental Growth
Executive Summary - Data Table on Incremental Growth
Executive Summary - Chart on Company Market Positioning

2. Technavio Analysis

2.1 Analysis of price sensitivity, lifecycle, customer purchase basket, adoption rates, and purchase criteria

2.2 Criticality of inputs and Factors of differentiation

Chart on Overview on criticality of inputs and factors of differentiation

2.3 Factors of disruption

Chart on Overview on factors of disruption

2.4 Impact of drivers and challenges

Chart on Impact of drivers and challenges in 2025 and 2030

3. Market Landscape

3.1 Market ecosystem

Chart on Parent Market
Data Table on - Parent Market

3.2 Market characteristics

Chart on Market characteristics analysis

3.3 Value chain analysis

Chart on Value chain analysis

4. Market Sizing

4.1 Market definition

Data Table on Offerings of companies included in the market definition

4.2 Market segment analysis

Market segments

4.3 Market size 2025

4.4 Market outlook: Forecast for 2025-2030

Chart on Global - Market size and forecast 2025-2030 ($ million)
Data Table on Global - Market size and forecast 2025-2030 ($ million)
Chart on Global Market: Year-over-year growth 2025-2030 (%)
Data Table on Global Market: Year-over-year growth 2025-2030 (%)

5. Historic Market Size

5.1 Global AI In Transportation Market 2020 - 2024

Historic Market Size - Data Table on Global AI In Transportation Market 2020 - 2024 ($ million)

5.2 Component segment analysis 2020 - 2024

Historic Market Size - Component Segment 2020 - 2024 ($ million)

5.3 Application segment analysis 2020 - 2024

Historic Market Size - Application Segment 2020 - 2024 ($ million)

5.4 Technology segment analysis 2020 - 2024

Historic Market Size - Technology Segment 2020 - 2024 ($ million)

5.5 Geography segment analysis 2020 - 2024

Historic Market Size - Geography Segment 2020 - 2024 ($ million)

5.6 Country segment analysis 2020 - 2024

Historic Market Size - Country Segment 2020 - 2024 ($ million)

6. Qualitative Analysis

6.1 Impact of geopolitical conflicts on global AI in transportation market

7. Five Forces Analysis

7.1 Five forces summary

Five forces analysis - Comparison between 2025 and 2030

7.2 Bargaining power of buyers

Bargaining power of buyers - Impact of key factors 2025 and 2030

7.3 Bargaining power of suppliers

Bargaining power of suppliers - Impact of key factors in 2025 and 2030

7.4 Threat of new entrants

Threat of new entrants - Impact of key factors in 2025 and 2030

7.5 Threat of substitutes

Threat of substitutes - Impact of key factors in 2025 and 2030

7.6 Threat of rivalry

Threat of rivalry - Impact of key factors in 2025 and 2030

7.7 Market condition

Chart on Market condition - Five forces 2025 and 2030

8. Market Segmentation by Component

8.1 Market segments

Chart on Component - Market share 2025-2030 (%)
Data Table on Component - Market share 2025-2030 (%)

8.2 Comparison by Component

Chart on Comparison by Component
Data Table on Comparison by Component

8.3 Hardware - Market size and forecast 2025-2030

Chart on Hardware - Market size and forecast 2025-2030 ($ million)
Data Table on Hardware - Market size and forecast 2025-2030 ($ million)
Chart on Hardware - Year-over-year growth 2025-2030 (%)
Data Table on Hardware - Year-over-year growth 2025-2030 (%)

8.4 Software - Market size and forecast 2025-2030

Chart on Software - Market size and forecast 2025-2030 ($ million)
Data Table on Software - Market size and forecast 2025-2030 ($ million)
Chart on Software - Year-over-year growth 2025-2030 (%)
Data Table on Software - Year-over-year growth 2025-2030 (%)

8.5 Services - Market size and forecast 2025-2030

Chart on Services - Market size and forecast 2025-2030 ($ million)
Data Table on Services - Market size and forecast 2025-2030 ($ million)
Chart on Services - Year-over-year growth 2025-2030 (%)
Data Table on Services - Year-over-year growth 2025-2030 (%)

8.6 Market opportunity by Component

Market opportunity by Component ($ million)
Data Table on Market opportunity by Component ($ million)

9. Market Segmentation by Application

9.1 Market segments

Chart on Application - Market share 2025-2030 (%)
Data Table on Application - Market share 2025-2030 (%)

9.2 Comparison by Application

Chart on Comparison by Application
Data Table on Comparison by Application

9.3 Autonomous vehicles - Market size and forecast 2025-2030

Chart on Autonomous vehicles - Market size and forecast 2025-2030 ($ million)
Data Table on Autonomous vehicles - Market size and forecast 2025-2030 ($ million)
Chart on Autonomous vehicles - Year-over-year growth 2025-2030 (%)
Data Table on Autonomous vehicles - Year-over-year growth 2025-2030 (%)

9.4 Traffic management - Market size and forecast 2025-2030

Chart on Traffic management - Market size and forecast 2025-2030 ($ million)
Data Table on Traffic management - Market size and forecast 2025-2030 ($ million)
Chart on Traffic management - Year-over-year growth 2025-2030 (%)
Data Table on Traffic management - Year-over-year growth 2025-2030 (%)

9.5 Freight management - Market size and forecast 2025-2030

Chart on Freight management - Market size and forecast 2025-2030 ($ million)
Data Table on Freight management - Market size and forecast 2025-2030 ($ million)
Chart on Freight management - Year-over-year growth 2025-2030 (%)
Data Table on Freight management - Year-over-year growth 2025-2030 (%)

9.6 Predictive maintenance - Market size and forecast 2025-2030

Chart on Predictive maintenance - Market size and forecast 2025-2030 ($ million)
Data Table on Predictive maintenance - Market size and forecast 2025-2030 ($ million)
Chart on Predictive maintenance - Year-over-year growth 2025-2030 (%)
Data Table on Predictive maintenance - Year-over-year growth 2025-2030 (%)

9.7 Others - Market size and forecast 2025-2030

Chart on Others - Market size and forecast 2025-2030 ($ million)
Data Table on Others - Market size and forecast 2025-2030 ($ million)
Chart on Others - Year-over-year growth 2025-2030 (%)
Data Table on Others - Year-over-year growth 2025-2030 (%)

9.8 Market opportunity by Application

Market opportunity by Application ($ million)
Data Table on Market opportunity by Application ($ million)

10. Market Segmentation by Technology

10.1 Market segments

Chart on Technology - Market share 2025-2030 (%)
Data Table on Technology - Market share 2025-2030 (%)

10.2 Comparison by Technology

Chart on Comparison by Technology
Data Table on Comparison by Technology

10.3 Machine learning - Market size and forecast 2025-2030

Chart on Machine learning - Market size and forecast 2025-2030 ($ million)
Data Table on Machine learning - Market size and forecast 2025-2030 ($ million)
Chart on Machine learning - Year-over-year growth 2025-2030 (%)
Data Table on Machine learning - Year-over-year growth 2025-2030 (%)

10.4 Deep learning - Market size and forecast 2025-2030

Chart on Deep learning - Market size and forecast 2025-2030 ($ million)
Data Table on Deep learning - Market size and forecast 2025-2030 ($ million)
Chart on Deep learning - Year-over-year growth 2025-2030 (%)
Data Table on Deep learning - Year-over-year growth 2025-2030 (%)

10.5 Computer vision - Market size and forecast 2025-2030

Chart on Computer vision - Market size and forecast 2025-2030 ($ million)
Data Table on Computer vision - Market size and forecast 2025-2030 ($ million)
Chart on Computer vision - Year-over-year growth 2025-2030 (%)
Data Table on Computer vision - Year-over-year growth 2025-2030 (%)

10.6 Natural language processing - Market size and forecast 2025-2030

Chart on Natural language processing - Market size and forecast 2025-2030 ($ million)
Data Table on Natural language processing - Market size and forecast 2025-2030 ($ million)
Chart on Natural language processing - Year-over-year growth 2025-2030 (%)
Data Table on Natural language processing - Year-over-year growth 2025-2030 (%)

10.7 Context aware computing - Market size and forecast 2025-2030

Chart on Context aware computing - Market size and forecast 2025-2030 ($ million)
Data Table on Context aware computing - Market size and forecast 2025-2030 ($ million)
Chart on Context aware computing - Year-over-year growth 2025-2030 (%)
Data Table on Context aware computing - Year-over-year growth 2025-2030 (%)

10.8 Market opportunity by Technology

Market opportunity by Technology ($ million)
Data Table on Market opportunity by Technology ($ million)

11. Customer Landscape

11.1 Customer landscape overview

Analysis of price sensitivity, lifecycle, customer purchase basket, adoption rates, and purchase criteria

12. Geographic Landscape

12.1 Geographic segmentation

Chart on Market share by geography 2025-2030 (%)
Data Table on Market share by geography 2025-2030 (%)

12.2 Geographic comparison

Chart on Geographic comparison
Data Table on Geographic comparison

12.3 North America - Market size and forecast 2025-2030

Chart on North America - Market size and forecast 2025-2030 ($ million)
Data Table on North America - Market size and forecast 2025-2030 ($ million)
Chart on North America - Year-over-year growth 2025-2030 (%)
Data Table on North America - Year-over-year growth 2025-2030 (%)
Chart on Regional Comparison - North America
Data Table on Regional Comparison - North America

12.3.1 US - Market size and forecast 2025-2030

Chart on US - Market size and forecast 2025-2030 ($ million)
Data Table on US - Market size and forecast 2025-2030 ($ million)
Chart on US - Year-over-year growth 2025-2030 (%)
Data Table on US - Year-over-year growth 2025-2030 (%)

12.3.2 Canada - Market size and forecast 2025-2030

Chart on Canada - Market size and forecast 2025-2030 ($ million)
Data Table on Canada - Market size and forecast 2025-2030 ($ million)
Chart on Canada - Year-over-year growth 2025-2030 (%)
Data Table on Canada - Year-over-year growth 2025-2030 (%)

12.3.3 Mexico - Market size and forecast 2025-2030

Chart on Mexico - Market size and forecast 2025-2030 ($ million)
Data Table on Mexico - Market size and forecast 2025-2030 ($ million)
Chart on Mexico - Year-over-year growth 2025-2030 (%)
Data Table on Mexico - Year-over-year growth 2025-2030 (%)

12.4 Europe - Market size and forecast 2025-2030

Chart on Europe - Market size and forecast 2025-2030 ($ million)
Data Table on Europe - Market size and forecast 2025-2030 ($ million)
Chart on Europe - Year-over-year growth 2025-2030 (%)
Data Table on Europe - Year-over-year growth 2025-2030 (%)
Chart on Regional Comparison - Europe
Data Table on Regional Comparison - Europe

12.4.1 Germany - Market size and forecast 2025-2030

Chart on Germany - Market size and forecast 2025-2030 ($ million)
Data Table on Germany - Market size and forecast 2025-2030 ($ million)
Chart on Germany - Year-over-year growth 2025-2030 (%)
Data Table on Germany - Year-over-year growth 2025-2030 (%)

12.4.2 UK - Market size and forecast 2025-2030

Chart on UK - Market size and forecast 2025-2030 ($ million)
Data Table on UK - Market size and forecast 2025-2030 ($ million)
Chart on UK - Year-over-year growth 2025-2030 (%)
Data Table on UK - Year-over-year growth 2025-2030 (%)

12.4.3 France - Market size and forecast 2025-2030

Chart on France - Market size and forecast 2025-2030 ($ million)
Data Table on France - Market size and forecast 2025-2030 ($ million)
Chart on France - Year-over-year growth 2025-2030 (%)
Data Table on France - Year-over-year growth 2025-2030 (%)

12.4.4 Italy - Market size and forecast 2025-2030

Chart on Italy - Market size and forecast 2025-2030 ($ million)
Data Table on Italy - Market size and forecast 2025-2030 ($ million)
Chart on Italy - Year-over-year growth 2025-2030 (%)
Data Table on Italy - Year-over-year growth 2025-2030 (%)

12.4.5 Spain - Market size and forecast 2025-2030

Chart on Spain - Market size and forecast 2025-2030 ($ million)
Data Table on Spain - Market size and forecast 2025-2030 ($ million)
Chart on Spain - Year-over-year growth 2025-2030 (%)
Data Table on Spain - Year-over-year growth 2025-2030 (%)

12.4.6 The Netherlands - Market size and forecast 2025-2030

Chart on The Netherlands - Market size and forecast 2025-2030 ($ million)
Data Table on The Netherlands - Market size and forecast 2025-2030 ($ million)
Chart on The Netherlands - Year-over-year growth 2025-2030 (%)
Data Table on The Netherlands - Year-over-year growth 2025-2030 (%)

12.5 APAC - Market size and forecast 2025-2030

Chart on APAC - Market size and forecast 2025-2030 ($ million)
Data Table on APAC - Market size and forecast 2025-2030 ($ million)
Chart on APAC - Year-over-year growth 2025-2030 (%)
Data Table on APAC - Year-over-year growth 2025-2030 (%)
Chart on Regional Comparison - APAC
Data Table on Regional Comparison - APAC

12.5.1 China - Market size and forecast 2025-2030

Chart on China - Market size and forecast 2025-2030 ($ million)
Data Table on China - Market size and forecast 2025-2030 ($ million)
Chart on China - Year-over-year growth 2025-2030 (%)
Data Table on China - Year-over-year growth 2025-2030 (%)

12.5.2 Japan - Market size and forecast 2025-2030

Chart on Japan - Market size and forecast 2025-2030 ($ million)
Data Table on Japan - Market size and forecast 2025-2030 ($ million)
Chart on Japan - Year-over-year growth 2025-2030 (%)
Data Table on Japan - Year-over-year growth 2025-2030 (%)

12.5.3 India - Market size and forecast 2025-2030

Chart on India - Market size and forecast 2025-2030 ($ million)
Data Table on India - Market size and forecast 2025-2030 ($ million)
Chart on India - Year-over-year growth 2025-2030 (%)
Data Table on India - Year-over-year growth 2025-2030 (%)

12.5.4 South Korea - Market size and forecast 2025-2030

Chart on South Korea - Market size and forecast 2025-2030 ($ million)
Data Table on South Korea - Market size and forecast 2025-2030 ($ million)
Chart on South Korea - Year-over-year growth 2025-2030 (%)
Data Table on South Korea - Year-over-year growth 2025-2030 (%)

12.5.5 Australia - Market size and forecast 2025-2030

Chart on Australia - Market size and forecast 2025-2030 ($ million)
Data Table on Australia - Market size and forecast 2025-2030 ($ million)
Chart on Australia - Year-over-year growth 2025-2030 (%)
Data Table on Australia - Year-over-year growth 2025-2030 (%)

12.5.6 Indonesia - Market size and forecast 2025-2030

Chart on Indonesia - Market size and forecast 2025-2030 ($ million)
Data Table on Indonesia - Market size and forecast 2025-2030 ($ million)
Chart on Indonesia - Year-over-year growth 2025-2030 (%)
Data Table on Indonesia - Year-over-year growth 2025-2030 (%)

12.6 Middle East and Africa - Market size and forecast 2025-2030

Chart on Middle East and Africa - Market size and forecast 2025-2030 ($ million)
Data Table on Middle East and Africa - Market size and forecast 2025-2030 ($ million)
Chart on Middle East and Africa - Year-over-year growth 2025-2030 (%)
Data Table on Middle East and Africa - Year-over-year growth 2025-2030 (%)
Chart on Regional Comparison - Middle East and Africa
Data Table on Regional Comparison - Middle East and Africa

12.6.1 Saudi Arabia - Market size and forecast 2025-2030

Chart on Saudi Arabia - Market size and forecast 2025-2030 ($ million)
Data Table on Saudi Arabia - Market size and forecast 2025-2030 ($ million)
Chart on Saudi Arabia - Year-over-year growth 2025-2030 (%)
Data Table on Saudi Arabia - Year-over-year growth 2025-2030 (%)

12.6.2 UAE - Market size and forecast 2025-2030

Chart on UAE - Market size and forecast 2025-2030 ($ million)
Data Table on UAE - Market size and forecast 2025-2030 ($ million)
Chart on UAE - Year-over-year growth 2025-2030 (%)
Data Table on UAE - Year-over-year growth 2025-2030 (%)

12.6.3 South Africa - Market size and forecast 2025-2030

Chart on South Africa - Market size and forecast 2025-2030 ($ million)
Data Table on South Africa - Market size and forecast 2025-2030 ($ million)
Chart on South Africa - Year-over-year growth 2025-2030 (%)
Data Table on South Africa - Year-over-year growth 2025-2030 (%)

12.6.4 Israel - Market size and forecast 2025-2030

Chart on Israel - Market size and forecast 2025-2030 ($ million)
Data Table on Israel - Market size and forecast 2025-2030 ($ million)
Chart on Israel - Year-over-year growth 2025-2030 (%)
Data Table on Israel - Year-over-year growth 2025-2030 (%)

12.6.5 Turkey - Market size and forecast 2025-2030

Chart on Turkey - Market size and forecast 2025-2030 ($ million)
Data Table on Turkey - Market size and forecast 2025-2030 ($ million)
Chart on Turkey - Year-over-year growth 2025-2030 (%)
Data Table on Turkey - Year-over-year growth 2025-2030 (%)

12.7 South America - Market size and forecast 2025-2030

Chart on South America - Market size and forecast 2025-2030 ($ million)
Data Table on South America - Market size and forecast 2025-2030 ($ million)
Chart on South America - Year-over-year growth 2025-2030 (%)
Data Table on South America - Year-over-year growth 2025-2030 (%)
Chart on Regional Comparison - South America
Data Table on Regional Comparison - South America

12.7.1 Brazil - Market size and forecast 2025-2030

Chart on Brazil - Market size and forecast 2025-2030 ($ million)
Data Table on Brazil - Market size and forecast 2025-2030 ($ million)
Chart on Brazil - Year-over-year growth 2025-2030 (%)
Data Table on Brazil - Year-over-year growth 2025-2030 (%)

12.7.2 Argentina - Market size and forecast 2025-2030

Chart on Argentina - Market size and forecast 2025-2030 ($ million)
Data Table on Argentina - Market size and forecast 2025-2030 ($ million)
Chart on Argentina - Year-over-year growth 2025-2030 (%)
Data Table on Argentina - Year-over-year growth 2025-2030 (%)

12.7.3 Chile - Market size and forecast 2025-2030

Chart on Chile - Market size and forecast 2025-2030 ($ million)
Data Table on Chile - Market size and forecast 2025-2030 ($ million)
Chart on Chile - Year-over-year growth 2025-2030 (%)
Data Table on Chile - Year-over-year growth 2025-2030 (%)

12.8 Market opportunity by geography

Market opportunity by geography ($ million)
Data Tables on Market opportunity by geography ($ million)

13. Drivers, Challenges, and Opportunity

13.1 Market drivers

Escalating urban congestion and mandate for enhanced traffic flow efficiency
Global imperatives for road safety and reduction of human error
Proliferation of e-commerce and demand for optimized logistics fulfillment

13.2 Market challenges

Data privacy concerns and complexity of regulatory compliance
High initial capital expenditure and infrastructure modernization requirements
Critical shortage of specialized technical talent and interdisciplinary expertise

13.3 Impact of drivers and challenges

Impact of drivers and challenges in 2025 and 2030

13.4 Market opportunities

Autonomous navigation systems and advanced driver assistance integration
Predictive maintenance and asset lifecycle optimization
Convergence of real-time intelligent traffic management and edge computing

14. Competitive Landscape

14.1 Overview

14.2

Overview on criticality of inputs and factors of differentiation

14.3 Landscape disruption

Overview on factors of disruption

14.4 Industry risks

Impact of key risks on business

15. Competitive Analysis

15.1 Companies profiled

Companies covered

15.2 Company ranking index

15.3 Market positioning of companies

Matrix on companies position and classification

15.4 Derq Inc.

Derq Inc. - Overview
Derq Inc. - Product / Service
Derq Inc. - Key offerings
SWOT

15.5 Descartes Systems Group Inc.

Descartes Systems Group Inc. - Overview
Descartes Systems Group Inc. - Business segments
Descartes Systems Group Inc. - Key offerings
Descartes Systems Group Inc. - Segment focus
SWOT

15.6 Geotab Inc.

Geotab Inc. - Overview
Geotab Inc. - Product / Service
Geotab Inc. - Key offerings
SWOT

15.7 Hayden AI Technologies Inc.

Hayden AI Technologies Inc. - Overview
Hayden AI Technologies Inc. - Product / Service
Hayden AI Technologies Inc. - Key offerings
SWOT

15.8 Hitachi Ltd.

Hitachi Ltd. - Overview
Hitachi Ltd. - Business segments
Hitachi Ltd. - Key offerings
Hitachi Ltd. - Segment focus
SWOT

15.9 Motive Technologies Inc.

Motive Technologies Inc. - Overview
Motive Technologies Inc. - Product / Service
Motive Technologies Inc. - Key offerings
SWOT

15.10 PlusAI Inc.

PlusAI Inc. - Overview
PlusAI Inc. - Product / Service
PlusAI Inc. - Key offerings
SWOT

15.11 PTV Planung Transport Verkehr

PTV Planung Transport Verkehr - Overview
PTV Planung Transport Verkehr - Product / Service
PTV Planung Transport Verkehr - Key offerings
SWOT

15.12 Samba Holdings Inc.

Samba Holdings Inc. - Overview
Samba Holdings Inc. - Product / Service
Samba Holdings Inc. - Key offerings
SWOT

15.13 Samsara Inc.

Samsara Inc. - Overview
Samsara Inc. - Product / Service
Samsara Inc. - Key news
Samsara Inc. - Key offerings
SWOT

15.14 Siemens AG

Siemens AG - Overview
Siemens AG - Business segments
Siemens AG - Key news
Siemens AG - Key offerings
Siemens AG - Segment focus
SWOT

15.15 Tesla Inc.

Tesla Inc. - Overview
Tesla Inc. - Business segments
Tesla Inc. - Key news
Tesla Inc. - Key offerings
Tesla Inc. - Segment focus
SWOT

15.16 Transporeon GmbH

Transporeon GmbH - Overview
Transporeon GmbH - Product / Service
Transporeon GmbH - Key offerings
SWOT

15.17 Via Transportation Inc.

Via Transportation Inc. - Overview
Via Transportation Inc. - Product / Service
Via Transportation Inc. - Key offerings
SWOT

15.18 Waymo LLC

Waymo LLC - Overview
Waymo LLC - Product / Service
Waymo LLC - Key offerings
SWOT

16. Appendix

16.1 Scope of the report

Market definition
Objectives
Notes and caveats

16.2 Inclusions and exclusions checklist

Inclusions checklist
Exclusions checklist

16.3 Currency conversion rates for US$

16.4 Research methodology

16.5 Data procurement

Information sources

16.6 Data validation

16.7 Validation techniques employed for market sizing

16.8 Data synthesis

16.9 360 degree market analysis

16.10 List of abbreviations

Research Methodology

Technavio presents a detailed picture of the market by way of study, synthesis, and summation of data from multiple sources. The analysts have presented the various facets of the market with a particular focus on identifying the key industry influencers. The data thus presented is comprehensive, reliable, and the result of extensive research, both primary and secondary.

INFORMATION SOURCES

Primary sources

  • Manufacturers and suppliers
  • Channel partners
  • Industry experts
  • Strategic decision makers

Secondary sources

  • Industry journals and periodicals
  • Government data
  • Financial reports of key industry players
  • Historical data
  • Press releases

DATA ANALYSIS

Data Synthesis

  • Collation of data
  • Estimation of key figures
  • Analysis of derived insights

Data Validation

  • Triangulation with data models
  • Reference against proprietary databases
  • Corroboration with industry experts

REPORT WRITING

Qualitative

  • Market drivers
  • Market challenges
  • Market trends
  • Five forces analysis

Quantitative

  • Market size and forecast
  • Market segmentation
  • Geographical insights
  • Competitive landscape

Interested in this report?

Get your sample now to see our research methodology and insights!

Download Now

Frequently Asked Questions

AI In Transportation market growth will increase by USD 6681.4 million during 2026-2030.

The AI In Transportation market is expected to grow at a CAGR of 19.9% during 2026-2030.

AI In Transportation market is segmented by Component (Hardware, Software, Services) Application (Autonomous vehicles, Traffic management, Freight management, Predictive maintenance, Others) Technology (Machine learning, Deep learning, Computer vision, Natural language processing, Context aware computing)

Derq Inc., Descartes Systems Group Inc., Einride AB, Geotab Inc., Hayden AI Technologies Inc., Hitachi Ltd., Motive Technologies Inc., NetraDyne Inc., Nuro Inc., PlusAI Inc., PTV Planung Transport Verkehr, Samba Holdings Inc., Samsara Inc., Siemens AG, Tesla Inc., Transporeon GmbH, Via Transportation Inc., Waabi, Waymo LLC are a few of the key vendors in the AI In Transportation market.

North America will register the highest growth rate of 41.4% among the other regions. Therefore, the AI In Transportation market in North America is expected to garner significant business opportunities for the vendors during the forecast period.

US, Canada, Mexico, Germany, UK, France, Italy, Spain, The Netherlands, China, Japan, India, South Korea, Australia, Indonesia, Saudi Arabia, UAE, South Africa, Israel, Turkey, Brazil, Argentina, Chile

  • Escalating urban congestion and mandate for enhanced traffic flow efficiency is the driving factor this market.

The AI In Transportation market vendors should focus on grabbing business opportunities from the Component segment as it accounted for the largest market share in the base year.
RIA - Research AI Assistant
Ask RIA