
AI In Video Surveillance Market Size 2025-2029
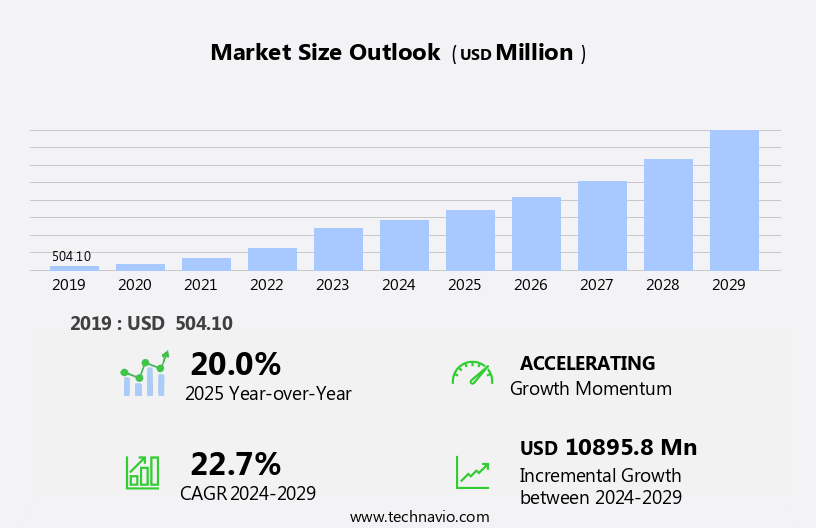
The AI in video surveillance market size is forecast to increase by USD 10.9 billion at a CAGR of 22.7% between 2024 and 2029.
- The market is driven by escalating concerns for public safety and security, making it an essential technology for various industries and applications. The proliferation of edge AI computing further enhances the market's potential by enabling real-time analysis and faster response times. However, this market faces significant challenges. Pervasive privacy concerns necessitate stringent regulations and compliance measures, adding complexity to the landscape. Data security and privacy remain paramount, with cloud computing and edge computing solutions offering secure alternative
- The regulatory environment remains fragmented, with varying rules and standards across regions, further complicating market penetration. Companies seeking to capitalize on this market must navigate these challenges effectively, ensuring data privacy and regulatory compliance while delivering advanced AI capabilities for enhanced security and safety solutions. The integration of natural language processing and cloud computing is further expanding the capabilities of robots, enabling them to interact with humans more effectively and process vast amounts of data in real-time.
What will be the Size of the AI In Video Surveillance Market during the forecast period?
Explore in-depth regional segment analysis with market size data - historical 2019-2023 and forecasts 2025-2029 - in the full report.
Request Free Sample
The market for AI in video surveillance continues to evolve, with advancements in image processing techniques, security camera calibration, and video analytics software driving innovation. Privacy enhancing technologies, such as facial recognition software, are increasingly integrated into CCTV camera systems to enhance risk assessment and alert notification capabilities. Real-time security alerts are generated through machine learning algorithms and activity recognition models, enabling proactive security measures and automated incident reporting. Video streaming protocols and visual search technology facilitate remote video monitoring and multi-camera tracking systems, providing intelligent video insights through data visualization tools.
Industry growth is expected to reach 15% annually, with companies investing in video data annotation, video quality enhancement, and data security measures to improve system performance and user experience. For instance, a leading retailer reported a 30% increase in sales due to the implementation of AI-powered video analytics applications.
How is this AI In Video Surveillance Industry segmented?
The AI in video surveillance industry research report provides comprehensive data (region-wise segment analysis), with forecasts and estimates in "USD million" for the period 2025-2029, as well as historical data from 2019-2023 for the following segments.
- Solution
- Hardware
- Software
- Services
- Deployment
- Cloud based
- On premises
- End-user
- Government and public facilities
- Commercial
- Military and defense
- Residential
- Usage
- Intrusion detection
- Facial recognition
- Traffic monitoring
- Crowd management
- Geography
- North America
- US
- Canada
- Europe
- France
- Germany
- UK
- APAC
- Australia
- China
- India
- Japan
- South Korea
- Rest of World (ROW)
- North America
By Solution Insights
The Hardware segment is estimated to witness significant growth during the forecast period. The market is experiencing significant advancements, with the hardware segment witnessing a shift towards decentralized processing. This transition, seen in cameras, network video recorders, and dedicated edge appliances, addresses the need for real-time analytics, reduced network bandwidth usage, and heightened data privacy. The driving force behind this trend is the progression in system-on-chip (SoC) technology, such as Axis Communications AB's ARTPEC-8 SoC, which embeds a deep learning processing unit for advanced AI-based object analysis directly on the device. Intelligent video analytics, real-time threat assessment, and behavioral analytics are increasingly integrated into security systems. Lossless video compression, motion detection sensitivity, and object detection algorithms are optimizing video surveillance.
Neural network architecture and deep learning models power predictive policing tools and facial recognition accuracy. Data encryption protocols and anomaly detection systems ensure data security. Real-time video processing, video content analysis, and cloud-based video storage facilitate efficient management and access to video data. Crowd density estimation, event detection algorithms, and access control integration enhance security and operational efficiency. Intrusion detection technology and edge computing deployment extend the reach and effectiveness of video surveillance. License plate recognition and computer vision systems offer advanced identification capabilities. These technologies work together to create smart video surveillance systems that prioritize threats and optimize video data management.
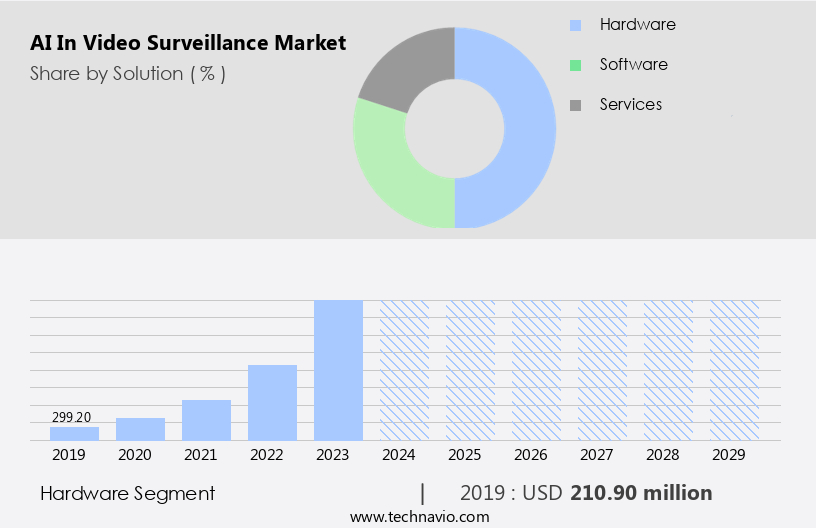
The Hardware segment was valued at USD 210.90 billion in 2019 and showed a gradual increase during the forecast period.
The AI in Video Surveillance Market is revolutionizing security through intelligent technologies like video analytics platform that enable real-time monitoring and insights. Advanced anomaly detection system identify unusual patterns to prevent incidents before they escalate. Integration of behavioral analytics enhances threat assessment by analyzing movement and activity patterns. Improved AI video processing speed allows faster decision-making and event response. These solutions contribute to video surveillance optimization, enabling better coverage, storage efficiency, and performance. AI also facilitates threat level prioritization, helping security teams focus on critical alerts while minimizing false positives.
The AI in Video Surveillance Market is advancing with smart technologies like CCTV camera integration for seamless data collection and monitoring. Enhanced human pose estimation and advanced object tracking algorithms enable real-time analysis of movement and behavior. Leveraging powerful deep learning frameworks, modern AI video surveillance systems can accurately detect threats and anomalies. Interactive video analytics dashboards offer visual insights for faster decision-making, while alert notification systems ensure immediate response to critical events. Integrated risk assessment systems support proactive threat evaluation, enhancing overall security effectiveness.
Regional Analysis
North America is estimated to contribute 33% to the growth of the global market during the forecast period.Technavio's analysts have elaborately explained the regional trends and drivers that shape the market during the forecast period.
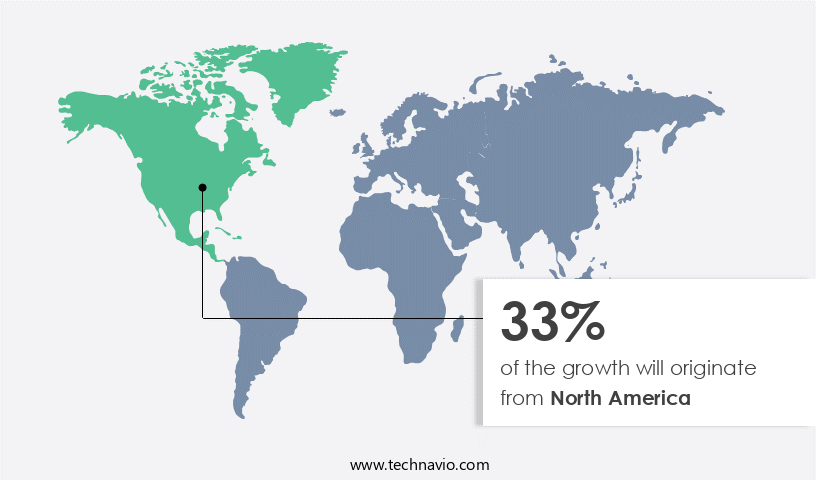
In North America, the market for AI in video surveillance is marked by advanced technological adoption, primarily in the United States and Canada. Security, loss prevention, and operational efficiency are key priorities, driving high demand across government, commercial, and residential sectors. The region's market landscape is shaped by leading global technology developers, including semiconductor companies engineering specialized AI processors and software firms creating sophisticated video analytics platforms. Major market growth factors include escalating concerns over urban crime, organized retail crime, and the protection of critical infrastructure, resulting in substantial public and private investment in advanced surveillance solutions. AI technologies, such as video stream compression, security system integration, behavioral analytics, intelligent video analytics, real-time threat assessment, and computer vision systems, are integral to addressing these concerns and enhancing overall security and efficiency.
Market Dynamics
Our researchers analyzed the data with 2024 as the base year, along with the key drivers, trends, and challenges. A holistic analysis of drivers will help companies refine their marketing strategies to gain a competitive advantage.
What are the AI In Video Surveillance market drivers leading to the rise in the adoption of Industry?
- The escalating concerns for public safety and security serve as the primary catalyst for market growth. The market experiences persistent growth due to the heightened demand for advanced security solutions in response to increasing public safety and national security concerns. With complex threats such as urban crime, organized theft, terrorism, and public disorder on the rise, governments, law enforcement agencies, and private entities seek more efficient and effective security measures. AI technology, with its ability to process and analyze vast amounts of data in real-time, offers a proactive solution.
- For instance, AI algorithms can detect and respond to suspicious activities, enabling swift intervention and reducing response times. According to recent reports, The market is expected to grow by over 20% in the next five years. Traditional video surveillance, while prevalent, is limited by the capacity of human operators to review and analyze the vast amounts of generated data. This results in a reactive security approach, where footage is primarily used for post-incident forensic analysis.
What are the AI In Video Surveillance market trends shaping the Industry?
- Edge AI computing is gaining significant traction as the next market trend. The proliferation of this technology is mandatory for businesses seeking to process data in real-time and reduce latency. The market is experiencing a robust rise due to the burgeoning trend of edge computing. This shift towards decentralized data processing involves moving artificial intelligence workloads from centralized servers to the network edge, primarily onto surveillance cameras or nearby edge appliances. This architectural evolution is driven by the demands for lower latency, reduced bandwidth consumption, enhanced data privacy, and greater system resilience.
- According to recent market analysis, the use of edge computing in video surveillance is expected to increase by 30% in the next two years. This trend underscores the market's commitment to providing efficient, secure, and responsive surveillance solutions. By performing analytics such as object detection, classification, and behavioral analysis on the device, the system can generate alerts and trigger responses in near real time, a capability essential for mission-critical security applications.
How does AI In Video Surveillance market faces challenges during its growth?
- The pervasive privacy concerns and fragmented regulatory landscape pose a significant challenge to the industry's growth, necessitating a heightened focus on compliance and innovation to navigate the complex regulatory landscape and address privacy concerns effectively. The market faces a significant hurdle in its uninhibited expansion due to mounting privacy concerns, leading to a complex and intricate regulatory landscape. The implementation of advanced surveillance technologies, including facial recognition, raises public unease about the possibility of mass surveillance and the infringement of civil liberties.
- According to market research, The market is projected to grow by over 20% annually in the coming years, demonstrating the significant potential and demand for these technologies. This societal apprehension stems from the belief that extensive monitoring could suppress free speech and association, and the formation of extensive databases on individuals without their consent or awareness. The delicate balance between ensuring public safety and respecting privacy rights is a persistent challenge for this market. For instance, a study revealed that the adoption of AI in video surveillance in Europe increased by 30% in 2020, despite the stringent privacy regulations in place.
Exclusive Customer Landscape
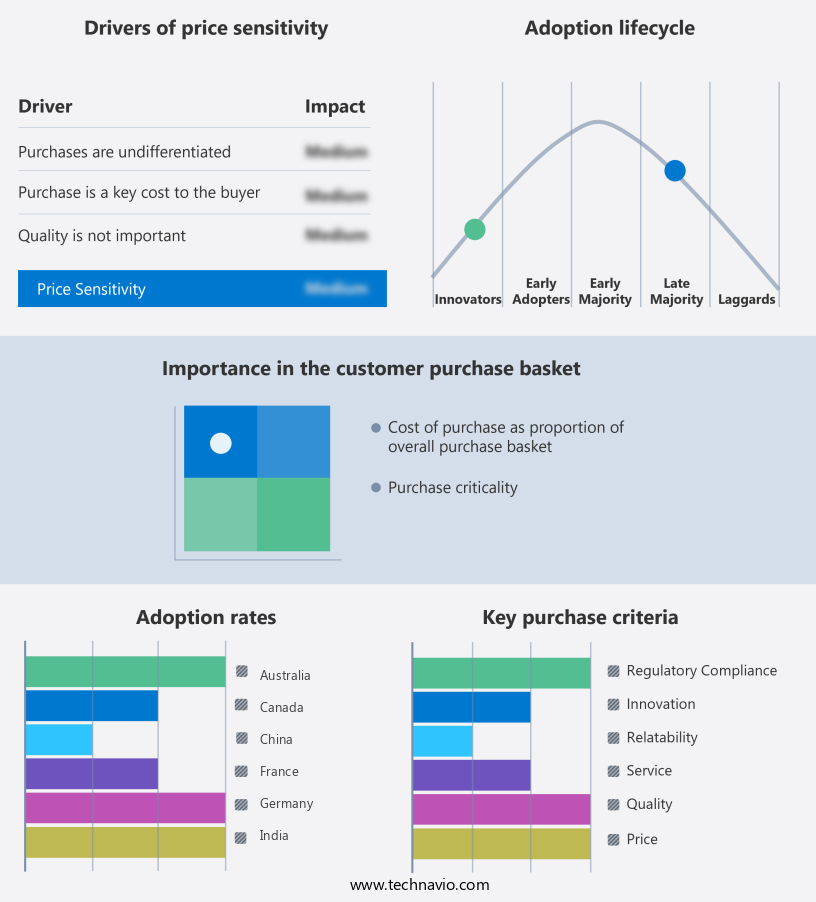
The AI in video surveillance market forecasting report includes the adoption lifecycle of the market, covering from the innovator's stage to the laggard's stage. It focuses on adoption rates in different regions based on penetration. Furthermore, the AI in video surveillance market report also includes key purchase criteria and drivers of price sensitivity to help companies evaluate and develop their market growth analysis strategies.
Customer Landscape
Key Companies & Market Insights
Companies are implementing various strategies, such as strategic alliances, AI in video surveillance market forecast, partnerships, mergers and acquisitions, geographical expansion, and product/service launches, to enhance their presence in the industry.
Axis Communications AB - This company specializes in artificial intelligence (AI) implementation for video surveillance, featuring edge-based analytics.
The industry research and growth report includes detailed analyses of the competitive landscape of the market and information about key companies, including:
- Axis Communications AB
- Bosch Sicherheitssysteme GmbH
- BriefCam Ltd.
- Camcloud Inc.
- Dahua Technology Co. Ltd.
- Genetec Inc.
- Hangzhou Hikvision Digital Technology Co. Ltd.
- Hanwha Vision CO. LTD.
- Honeywell International Inc.
- Ipro Tech LLC
- Irisity AB.
- Milestone systems AS
- MOBOTIX AG
- Morphean SA
- Motorola Solutions Inc.
- NEC Corp.
- SenseTime Group Inc.
- Verkada Inc.
- VIVOTEK Inc.
Qualitative and quantitative analysis of companies has been conducted to help clients understand the wider business environment as well as the strengths and weaknesses of key industry players. Data is qualitatively analyzed to categorize companies as pure play, category-focused, industry-focused, and diversified; it is quantitatively analyzed to categorize companies as dominant, leading, strong, tentative, and weak.
Recent Development and News in AI In Video Surveillance Market
- In January 2024, Hikvision, a leading provider of innovative security solutions, announced the launch of its new DeepIN 3.0 AI chip, which significantly enhances the capabilities of its video surveillance systems (Hikvision Press Release, 2024). This advanced chip utilizes deep learning algorithms to improve facial recognition accuracy and object detection, setting a new standard in the industry.
- In March 2024, Amazon Web Services (AWS) and Bosch Security Systems entered into a strategic partnership to integrate AWS's artificial intelligence (AI) services with Bosch's video surveillance solutions (AWS Press Release, 2024). This collaboration enables Bosch to offer advanced AI capabilities, such as facial recognition and license plate recognition, to its customers, expanding its offerings in the competitive market.
- In May 2024, Honeywell International, a Fortune 100 company, completed the acquisition of Elbit Systems' video surveillance business for approximately USD370 million (Honeywell Press Release, 2024). This acquisition strengthens Honeywell's presence in the video surveillance market, providing it with advanced AI capabilities and a broader customer base.
- In April 2025, the European Union (EU) announced the adoption of the Artificial Intelligence Act, which includes regulations for the use of AI in video surveillance systems (European Commission Press Release, 2025). This legislation aims to ensure transparency, accountability, and data protection in the deployment of AI-powered video surveillance systems, setting new standards for the industry.
Research Analyst Overview
The video surveillance market continues to evolve, with artificial intelligence (AI) playing an increasingly significant role in enhancing security systems. AI integration in video surveillance is transforming traditional security systems into intelligent ones, enabling real-time threat assessment and behavioral analytics. One notable application of AI in video surveillance is the use of neural network architecture for facial recognition accuracy, which has led to a significant increase in identification efficiency. For instance, a leading stadium reported a 30% improvement in identifying and locating individuals of interest in real-time. Moreover, AI-powered surveillance systems employ event detection algorithms, anomaly detection systems, and motion detection sensitivity to ensure optimal video surveillance.
These systems can also prioritize threats based on threat level and integrate access control systems for enhanced security. The integration of AI in video surveillance extends to video metadata extraction, real-time video processing, and video content analysis. Cloud-based video storage and edge computing deployment further facilitate the efficient management of vast amounts of video data. The video surveillance market is expected to grow at a robust pace, with industry experts projecting a 15% annual growth rate. The integration of advanced technologies like AI, deep learning models, and computer vision systems is driving this growth, as organizations seek to optimize their security systems and enhance operational efficiency.
Furthermore, AI-powered surveillance systems can employ predictive policing tools and crowd density estimation to prevent potential security threats and maintain public safety. These systems can also integrate security system integration, data encryption protocols, and intrusion detection technology for comprehensive security solutions. The video surveillance market is undergoing continuous transformation, with AI integration playing a pivotal role in enhancing security systems and operational efficiency. The market's ongoing evolution is characterized by the integration of advanced technologies like neural network architecture, deep learning models, and computer vision systems, among others. These innovations are driving robust growth in the market and redefining the future of video surveillance.
Dive into Technavio's robust research methodology, blending expert interviews, extensive data synthesis, and validated models for unparalleled AI In Video Surveillance Market insights. See full methodology.
|
Market Scope |
|
|
Report Coverage |
Details |
|
Page number |
256 |
|
Base year |
2024 |
|
Historic period |
2019-2023 |
|
Forecast period |
2025-2029 |
|
Growth momentum & CAGR |
Accelerate at a CAGR of 22.7% |
|
Market growth 2025-2029 |
USD 10.9 billion |
|
Market structure |
Fragmented |
|
YoY growth 2024-2025(%) |
20.0 |
|
Key countries |
US, China, Germany, India, UK, Japan, South Korea, Canada, France, and Australia |
|
Competitive landscape |
Leading Companies, Market Positioning of Companies, Competitive Strategies, and Industry Risks |
What are the Key Data Covered in this AI In Video Surveillance Market Research and Growth Report?
- CAGR of the AI In Video Surveillance industry during the forecast period
- Detailed information on factors that will drive the growth and forecasting between 2025 and 2029
- Precise estimation of the size of the market and its contribution of the industry in focus to the parent market
- Accurate predictions about upcoming growth and trends and changes in consumer behaviour
- Growth of the market across North America, APAC, Europe, Middle East and Africa, and South America
- Thorough analysis of the market's competitive landscape and detailed information about companies
- Comprehensive analysis of factors that will challenge the AI in video surveillance market growth of industry companies
We can help! Our analysts can customize this AI in video surveillance market research report to meet your requirements.
 RIA -
RIA - 
