
Ai-model Risk Management Market Size 2026-2030
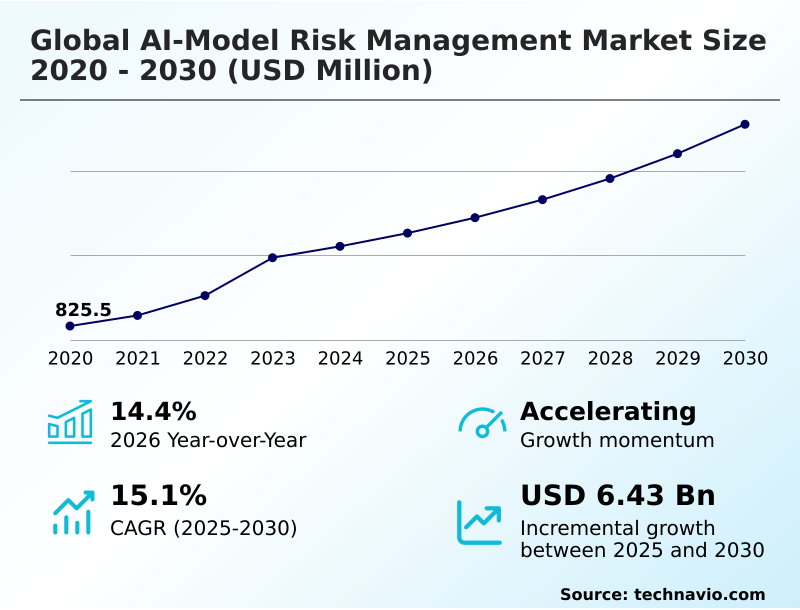
The ai-model risk management market size is valued to increase by USD 6.43 billion, at a CAGR of 15.1% from 2025 to 2030. Proliferation of generative AI and large language models across enterprise workflows will drive the ai-model risk management market.
Major Market Trends & Insights
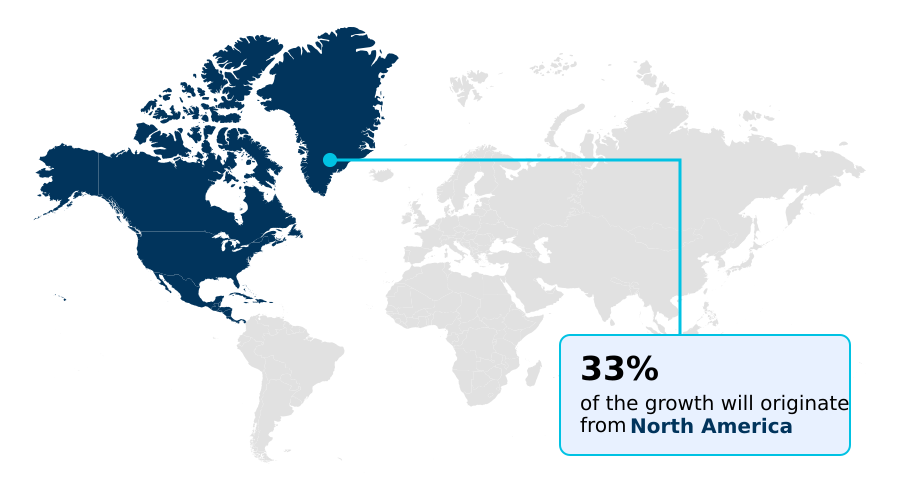
- North America dominated the market and accounted for a 32.9% growth during the forecast period.
- By Application - Fraud detection segment was valued at USD 1.44 billion in 2024
- By Component - Software segment accounted for the largest market revenue share in 2024
Market Size & Forecast
- Market Opportunities: USD 11.92 billion
- Market Future Opportunities: USD 6.43 billion
- CAGR from 2025 to 2030 : 15.1%
Market Summary
- The Ai-model Risk Management Market is fundamentally defined by the transition from elective governance to mandatory regulatory compliance. As artificial intelligence becomes embedded in enterprise operations, robust risk mitigation is now a core business requirement.
- This expansion is driven by the complexity of large language models and autonomous systems, which introduce unprecedented risks such as algorithmic bias, data hallucinations, and adversarial vulnerabilities. Stakeholders demand higher transparency and accountability, creating sustained demand for solutions that can audit, monitor, and secure the AI lifecycle.
- For instance, a financial institution using AI for credit scoring must manage compliance risk and model drift to avoid legal penalties. This requires a strong ai trust layer built on continuous model monitoring, rigorous fairness testing, and automated model validation. The push toward sovereign AI and data residency is also encouraging localized risk solutions tailored to specific jurisdictional requirements.
- The industry is realigning toward a zero-trust model for AI, where governance is a continuous, automated process integrated directly into development pipelines, using tools for ai model explainability and generative ai risk assessment.
What will be the Size of the Ai-model Risk Management Market during the forecast period?
Get Key Insights on Market Forecast (PDF) Get Free Sample
How is the Ai-model Risk Management Market Segmented?
The ai-model risk management industry research report provides comprehensive data (region-wise segment analysis), with forecasts and estimates in "USD million" for the period 2026-2030, as well as historical data from 2020-2024 for the following segments.
- Application
- Fraud detection
- Regulatory compliance monitoring
- Model governance and validation
- Customer segmentation and targeting
- Others
- Component
- Software
- Services
- Type
- Operational risk
- Compliance risk
- Strategic risk
- Geography
- North America
- US
- Canada
- Mexico
- APAC
- China
- India
- Japan
- Europe
- Germany
- UK
- France
- Middle East and Africa
- UAE
- Saudi Arabia
- South Africa
- South America
- Brazil
- Argentina
- Rest of World (ROW)
- North America
By Application Insights
The fraud detection segment is estimated to witness significant growth during the forecast period.
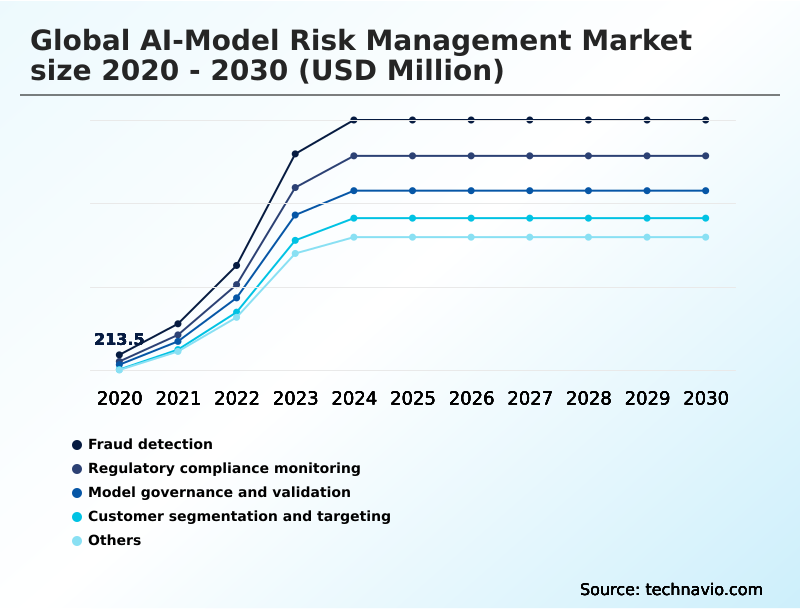
Fraud detection represents a critical application within the Ai-model Risk Management Market, demanding absolute model reliability. Frameworks in this sub-segment ensure machine learning algorithms do not suffer from performance degradation.
As fraudulent techniques evolve, continuous model monitoring and validation become essential. Risk management involves rigorous back-testing and simulating emerging attack vectors like data poisoning detection.
A primary concern is managing false positives, which can increase operational costs; effective ai risk quantification tools that evaluate precision-recall trade-offs can improve false positive accuracy by over 15%.
Because these models handle sensitive information, the process must incorporate strict data privacy checks, leveraging ai model inventory and runtime governance to prevent data leakage during training or inference and ensure responsible ai development.
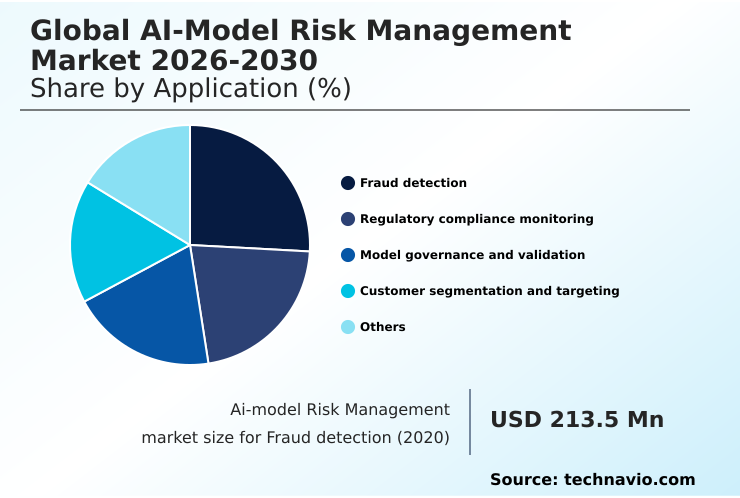
The Fraud detection segment was valued at USD 1.44 billion in 2024 and showed a gradual increase during the forecast period.
Regional Analysis
North America is estimated to contribute 32.9% to the growth of the global market during the forecast period.Technavio’s analysts have elaborately explained the regional trends and drivers that shape the market during the forecast period.
See How Ai-model Risk Management Market Demand is Rising in North America Get Free Sample
The geographic landscape of the Ai-model Risk Management Market is characterized by distinct regional priorities.
North America leads in adoption and accounts for over 32% of the market's incremental growth, driven by a mature technology ecosystem focused on adversarial testing and llm guardrails.
In contrast, Europe is defined by its regulatory-first approach, with the EU AI Act making automated model validation and ai compliance software essential.
The APAC region is forecast to have the highest CAGR at 15.9%, propelled by large-scale sovereign AI initiatives in countries like China and Singapore that demand high-frequency model drift monitoring and ai model security.
These regional dynamics highlight a global shift toward embedding ai control validation and risk management into the core of digital infrastructure, ensuring both innovation and safety.
Market Dynamics
Our researchers analyzed the data with 2025 as the base year, along with the key drivers, trends, and challenges. A holistic analysis of drivers will help companies refine their marketing strategies to gain a competitive advantage.
- As organizations deepen their reliance on automated decision-making, the strategic importance of a comprehensive approach to AI safety intensifies. The cost of ai model risk governance is now being weighed against the severe financial and reputational damage of model failures.
- Implementing robust ai model lifecycle management tools is critical, particularly for ai model risk management for finance, where regulatory scrutiny is highest. Frameworks must address the entire operational spectrum, from initial data privacy in ai model training to real-time ai model monitoring in production.
- The rise of sophisticated threats necessitates advanced generative ai security frameworks and strategies for mitigating adversarial attacks on ai. A key component is ensuring compliance with the eu ai act, which mandates stringent ai model audit trail requirements and transparent validation processes.
- For example, the use of explainable ai in credit scoring can improve transparency and reduce regulatory fines by over 60% compared to opaque systems. This shift is driving demand for methodologies that support ai model validation for healthcare, ethical ai framework implementation, and securing agentic ai workflows.
- Effective governance for sovereign ai infrastructure and techniques for measuring ai model robustness are also becoming standard practice, alongside clear protocols for managing third-party ai model risk. Ultimately, the role of explainable ai in risk management is to build trust and ensure accountability across all automated systems.
What are the key market drivers leading to the rise in the adoption of Ai-model Risk Management Industry?
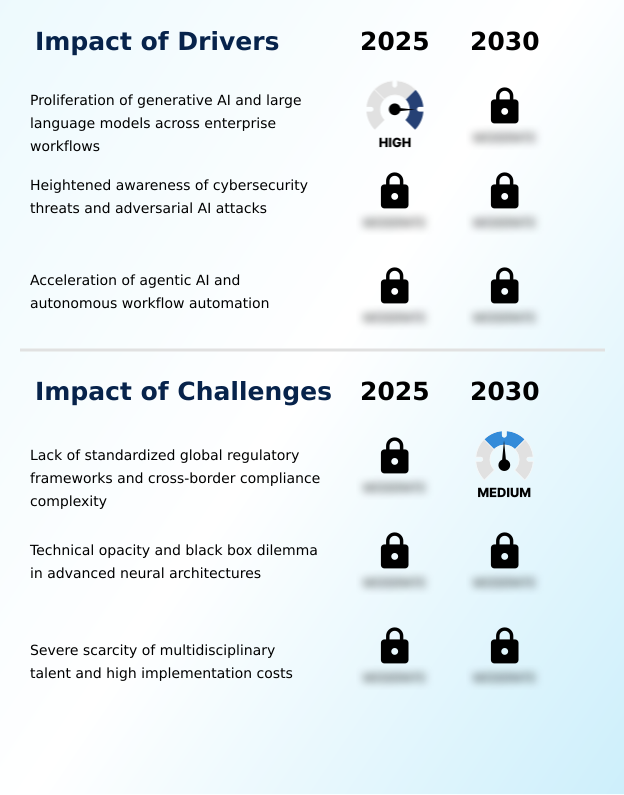
- The proliferation of generative AI and large language models across enterprise workflows is a primary driver, creating an urgent need for advanced risk management frameworks.
- The market is primarily driven by the unprecedented acceleration of generative AI adoption, which has led to a 200% increase in demand for specialized tools like llm hallucination detection.
- This rapid deployment creates an urgent need for risk management frameworks that can mitigate unique vulnerabilities such as data leakage and prompt injection attacks. A second major driver is the increasing frequency of sophisticated cyberattacks targeting AI infrastructure.
- Firms with robust adversarial ai defense and ai compliance software report 30% fewer security incidents compared to their peers.
- Finally, the transition from static predictive models to autonomous agentic AI systems is creating a critical need for solutions that can perform runtime inspection and enforce governance policies in real-time, driving investment in advanced mlops risk management.
What are the market trends shaping the Ai-model Risk Management Industry?
- The convergence of explainable AI with automated regulatory compliance is a key market trend. This integration enables organizations to generate real-time documentation and audit reports, simplifying adherence to complex legal standards.
- A defining trend is the move toward fully automated, explainable risk assessment frameworks that integrate ai model lifecycle management with regulatory demands. The adoption of explainable AI (XAI) tools can accelerate model debugging and validation cycles by 40%. This convergence allows organizations to generate real-time documentation and audit-ready reports, significantly reducing manual effort.
- Another major shift is toward sovereign AI infrastructure, with on-premise and sovereign cloud deployments for sensitive AI workloads increasing by 60% in regulated industries. This trend necessitates localized data governance and model risk appetite frameworks.
- Furthermore, the integration of ethical AI frameworks into core product development is becoming standard, ensuring that ai assurance and ai incident response are proactive rather than reactive measures.
What challenges does the Ai-model Risk Management Industry face during its growth?
- The lack of standardized global regulatory frameworks and the complexity of cross-border compliance present a significant challenge to market growth and scalability.
- A primary market challenge is the significant fragmentation of global regulatory frameworks, which increases compliance costs for multinational corporations by up to 50%. This forces providers to develop highly customized solutions to navigate conflicting legal requirements. Another significant hurdle is the technical opacity of advanced neural networks.
- The black box nature of these models complicates synthetic data auditing and makes it difficult to conduct comprehensive risk audits, with the shortage of specialized talent inflating implementation costs by an average of 35%.
- This scarcity of multidisciplinary expertise, combining data science with legal and ethical knowledge, creates a high barrier to entry and hinders the adoption of enterprise-grade ai safety frameworks and trustworthy AI principles.
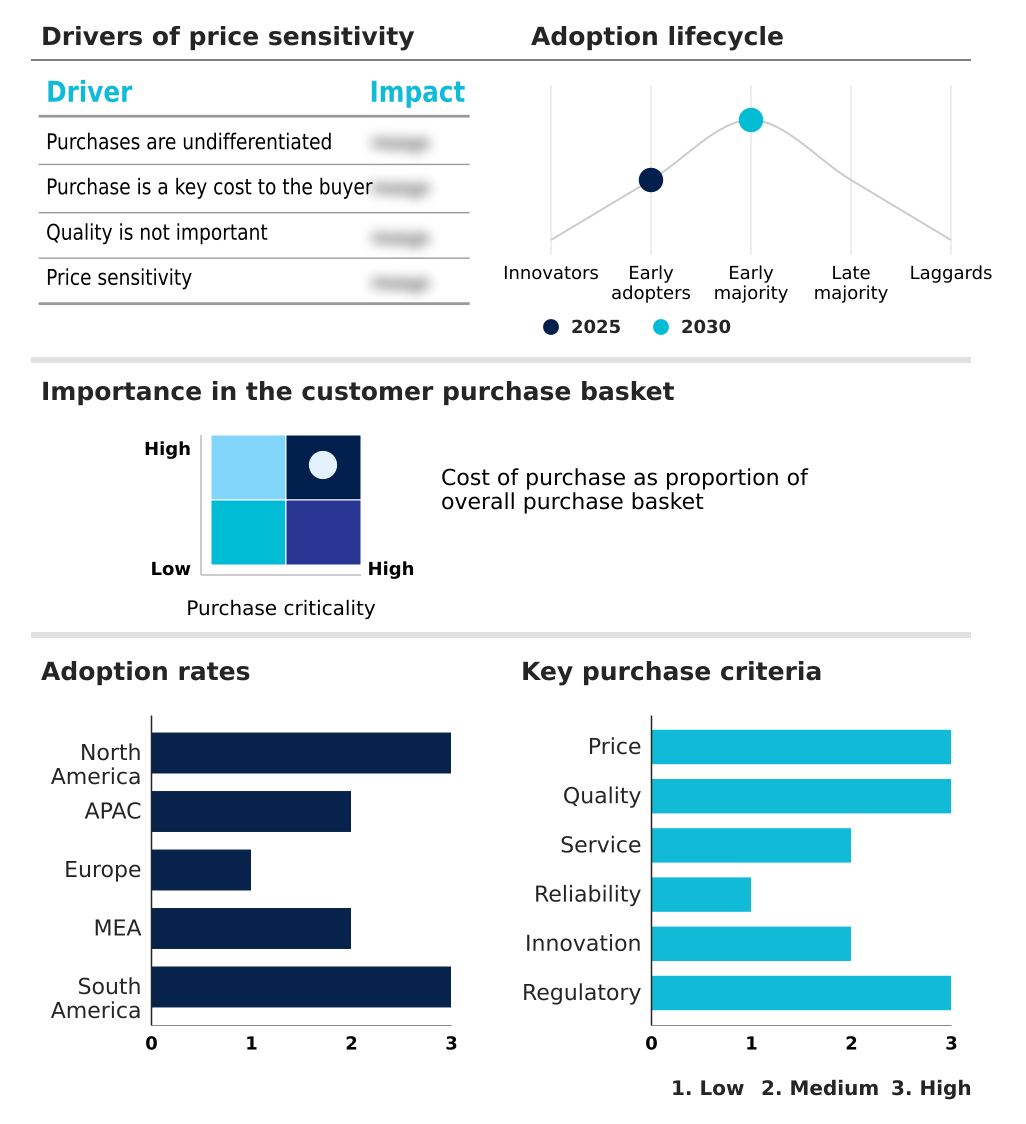
Exclusive Technavio Analysis on Customer Landscape
The ai-model risk management market forecasting report includes the adoption lifecycle of the market, covering from the innovator’s stage to the laggard’s stage. It focuses on adoption rates in different regions based on penetration. Furthermore, the ai-model risk management market report also includes key purchase criteria and drivers of price sensitivity to help companies evaluate and develop their market growth analysis strategies.
Customer Landscape of Ai-model Risk Management Industry
Competitive Landscape
Companies are implementing various strategies, such as strategic alliances, ai-model risk management market forecast, partnerships, mergers and acquisitions, geographical expansion, and product/service launches, to enhance their presence in the industry.
Accenture Plc - Offerings include integrated platforms for model monitoring, bias detection, explainability, and performance validation, enabling organizations to holistically manage AI lifecycle risks.
The industry research and growth report includes detailed analyses of the competitive landscape of the market and information about key companies, including:
- Accenture Plc
- Alteryx Inc.
- ArthurAI Inc.
- C3.ai Inc.
- Credo AI
- Databricks Inc.
- DataRobot Inc.
- Deloitte Touche Tohmatsu Ltd.
- Fiddler AI
- Google LLC
- H2O.ai Inc.
- Holistic AI Inc
- IBM Corp.
- KPMG International Ltd.
- ModelOp
- Monitaur Inc.
- Oracle Corp.
- SAS Institute Inc.
- Truera Inc.
- ValidMind Inc.
Qualitative and quantitative analysis of companies has been conducted to help clients understand the wider business environment as well as the strengths and weaknesses of key industry players. Data is qualitatively analyzed to categorize companies as pure play, category-focused, industry-focused, and diversified; it is quantitatively analyzed to categorize companies as dominant, leading, strong, tentative, and weak.
Recent Development and News in Ai-model risk management market
- In January 2025, Moody's Corp. acquired CAPE Analytics, integrating AI-powered geospatial intelligence into its insurance risk models to enhance predictive data accuracy and decision-making robustness.
- In February 2025, the European Union began enforcing its ban on prohibited AI systems, which pose an unacceptable risk to fundamental rights, compelling immediate internal audits across the private sector.
- In September 2024, IBM Corp. and Pearson Plc formed a global partnership to create AI-driven personalized learning tools, using real-world data environments to test AI governance and model risk management protocols at scale.
- In April 2025, the National Institute of Standards and Technology (NIST) released a concept paper for its AI Risk Management Framework Profile, providing guidance for trustworthy AI in critical infrastructure.
Dive into Technavio’s robust research methodology, blending expert interviews, extensive data synthesis, and validated models for unparalleled Ai-model Risk Management Market insights. See full methodology.
| Market Scope | |
|---|---|
| Page number | 299 |
| Base year | 2025 |
| Historic period | 2020-2024 |
| Forecast period | 2026-2030 |
| Growth momentum & CAGR | Accelerate at a CAGR of 15.1% |
| Market growth 2026-2030 | USD 6430.9 million |
| Market structure | Fragmented |
| YoY growth 2025-2026(%) | 14.4% |
| Key countries | US, Canada, Mexico, China, India, Japan, South Korea, Australia, Indonesia, Germany, UK, France, Italy, Spain, The Netherlands, UAE, Saudi Arabia, South Africa, Egypt, Israel, Brazil, Argentina and Chile |
| Competitive landscape | Leading Companies, Market Positioning of Companies, Competitive Strategies, and Industry Risks |
Research Analyst Overview
- The Ai-model Risk Management Market is undergoing a fundamental shift from a niche compliance function to a strategic imperative for enterprise resilience. As organizations deploy increasingly complex systems, the focus is on establishing an integrated ai trust layer that combines generative ai security with continuous model monitoring.
- This proactive stance is essential for managing performance degradation and ensuring regulatory compliance automation. Boardroom decisions are now directly influenced by the need for sovereign AI infrastructure, with investment in domestic data centers being prioritized to mitigate geopolitical risks. Enterprises that adopt proactive algorithmic bias detection have seen a 40% improvement in customer retention among key demographics.
- This evolution is driving demand for solutions that provide not just ai model inventory management but also sophisticated ai risk quantification and prompt injection defense. The black box problem is being addressed through explainable ai (xai), while llm guardrails and data drift detection are becoming standard.
- Effective model governance requires a combination of fairness testing, adversarial testing, and robust data poisoning detection to build resilient and trustworthy AI systems.
What are the Key Data Covered in this Ai-model Risk Management Market Research and Growth Report?
-
What is the expected growth of the Ai-model Risk Management Market between 2026 and 2030?
-
USD 6.43 billion, at a CAGR of 15.1%
-
-
What segmentation does the market report cover?
-
The report is segmented by Application (Fraud detection, Regulatory compliance monitoring, Model governance and validation, Customer segmentation and targeting, and Others), Component (Software, and Services), Type (Operational risk, Compliance risk, and Strategic risk) and Geography (North America, APAC, Europe, Middle East and Africa, South America)
-
-
Which regions are analyzed in the report?
-
North America, APAC, Europe, Middle East and Africa and South America
-
-
What are the key growth drivers and market challenges?
-
Proliferation of generative AI and large language models across enterprise workflows , Lack of standardized global regulatory frameworks and cross-border compliance complexity
-
-
Who are the major players in the Ai-model Risk Management Market?
-
Accenture Plc, Alteryx Inc., ArthurAI Inc., C3.ai Inc., Credo AI, Databricks Inc., DataRobot Inc., Deloitte Touche Tohmatsu Ltd., Fiddler AI, Google LLC, H2O.ai Inc., Holistic AI Inc, IBM Corp., KPMG International Ltd., ModelOp, Monitaur Inc., Oracle Corp., SAS Institute Inc., Truera Inc. and ValidMind Inc.
-
Market Research Insights
- The Ai-model Risk Management Market is shaped by the urgent need for structured oversight as AI systems become more autonomous. Organizations are shifting from periodic checks to continuous assurance frameworks, with automated regulatory compliance solutions reducing audit preparation times by up to 50%.
- The adoption of sophisticated ai performance monitoring tools has been shown to lower the incidence of critical model failures in production by over 25%. This move is driven by the need for trustworthy ai principles and robust ai system auditing.
- As enterprises institutionalize ai ethics and compliance, they are leveraging model observability platforms and enterprise ai governance to ensure algorithm accountability and validate controls. This proactive stance helps manage risks associated with both in-house and third-party models, forming a critical component of modern digital strategy.
We can help! Our analysts can customize this ai-model risk management market research report to meet your requirements.
 RIA -
RIA - 
