AI Orchestration Platform Market Analysis, Size, and Forecast 2025-2029: North America (US and Canada), APAC (China, India, and Japan), Europe (Germany, UK, and France), South America (Brazil and Argentina), Middle East and Africa (Saudi Arabia and UAE), and Rest of World (ROW)

AI Orchestration Platform Market Analysis, Size, and Forecast 2025-2029:
North America (US and Canada), APAC (China, India, and Japan), Europe (Germany, UK, and France), South America (Brazil and Argentina), Middle East and Africa (Saudi Arabia and UAE), and Rest of World (ROW)

Published: Dec 2025 266 Pages SKU: IRTNTR80989

Market Overview at a Glance

$15.74 B
Market Opportunity
31.7%
CAGR 2024 - 2029
41.4%
North America Growth
$2.89 B
Platforms segment 2023

AI Orchestration Platform Market Size 2025-2029

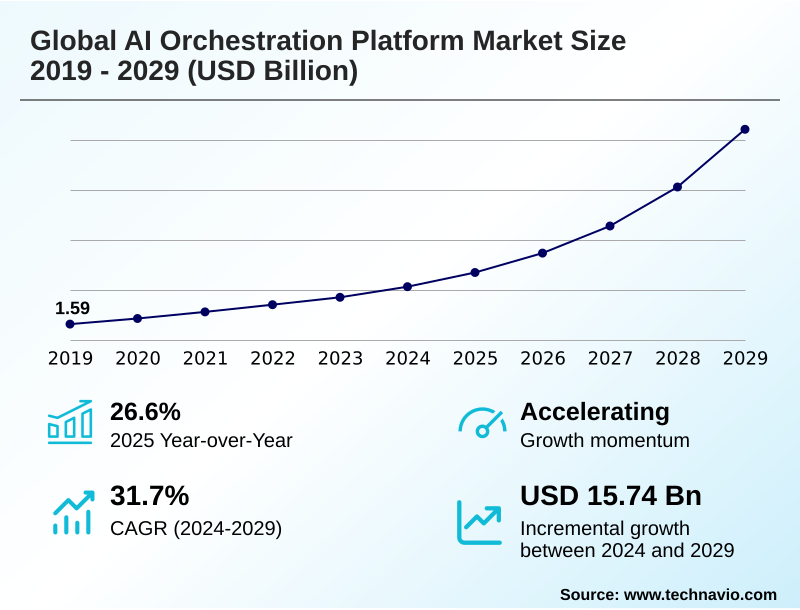
The ai orchestration platform market size is valued to increase by USD 15.74 billion, at a CAGR of 31.7% from 2024 to 2029. Increasing complexity and scale of AI models will drive the ai orchestration platform market.

Major Market Trends & Insights

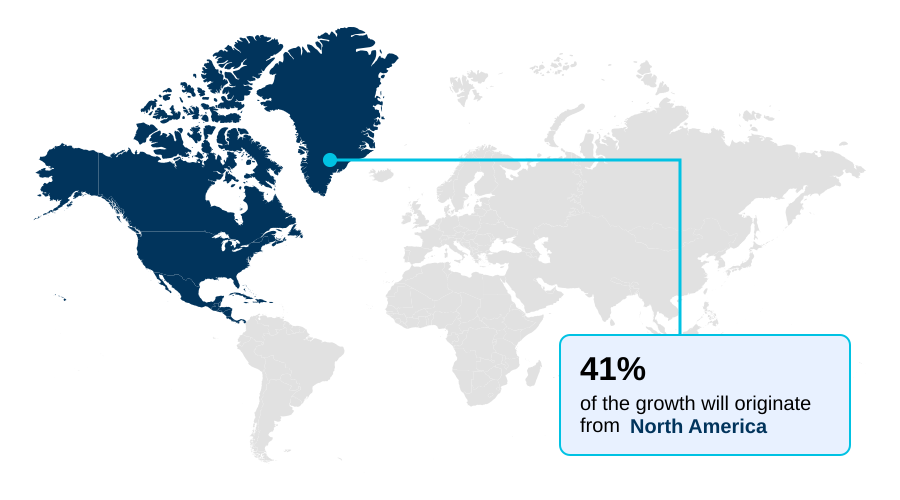
  • North America dominated the market and accounted for a 41.4% growth during the forecast period.
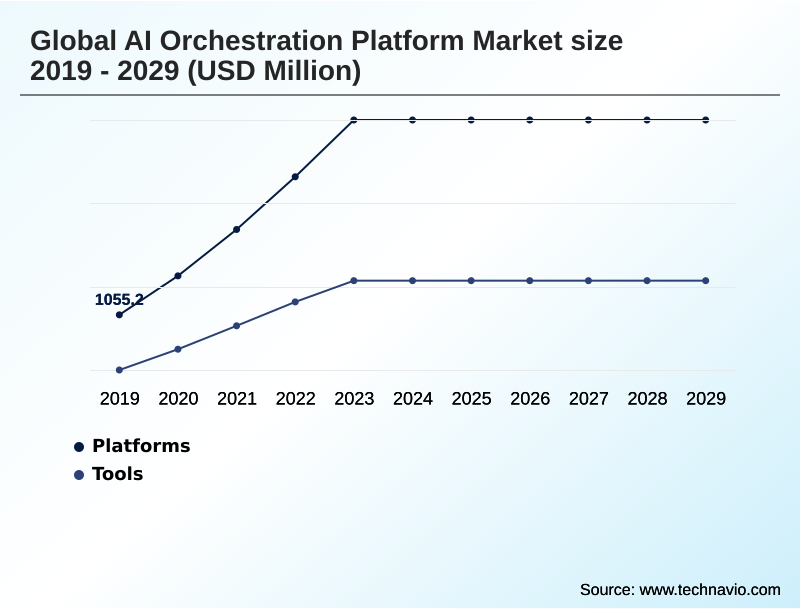
  • By Component - Platforms segment was valued at USD 2.89 billion in 2023
  • By Deployment - On-premises segment accounted for the largest market revenue share in 2023

Market Size & Forecast

  • Market Opportunities: USD 19.48 billion
  • Market Future Opportunities: USD 15.74 billion
  • CAGR from 2024 to 2029 : 31.7%

Market Summary

  • The AI orchestration platform market is expanding rapidly as organizations move beyond experimental AI projects to scalable, production-grade operations. This shift is driven by the need to manage the complexities of the modern machine learning lifecycle, from data ingestion and model training to deployment and continuous monitoring.
  • These platforms serve as the technological backbone for MLOps, enabling automated, reproducible, and auditable workflows that accelerate time-to-value and ensure model reliability. In the financial sector, for example, a bank deploying thousands of fraud detection models requires a robust system for AI orchestration for financial services.
  • The platform automates the retraining and deployment of models based on new transaction data, monitors for performance degradation or drift, and provides a complete audit trail for every prediction. This level of centralized model governance and compliance is impossible to achieve manually at scale and is essential for meeting strict regulatory requirements.
  • The emergence of generative AI has further intensified demand, creating a need for specialized orchestration to manage large language models, their intricate data pipelines, and their unique governance challenges, solidifying the market's critical role in enterprise technology stacks.

What will be the Size of the AI Orchestration Platform Market during the forecast period?

Get Key Insights on Market Forecast (PDF) Request Free Sample

How is the AI Orchestration Platform Market Segmented?

The ai orchestration platform industry research report provides comprehensive data (region-wise segment analysis), with forecasts and estimates in "USD million" for the period 2025-2029, as well as historical data from 2019-2023 for the following segments.

  • Component
    • Platforms
    • Tools
  • Deployment
    • On-premises
    • Cloud-based
  • Application
    • ML workflow
    • LLM agent
    • Data pipeline automation
    • AI workflow scheduling
    • Others
  • Geography
    • North America
      • US
      • Canada
    • APAC
      • China
      • India
      • Japan
    • Europe
      • Germany
      • UK
      • France
    • South America
      • Brazil
      • Argentina
    • Middle East and Africa
      • Saudi Arabia
      • UAE
    • Rest of World (ROW)

By Component Insights

The platforms segment is estimated to witness significant growth during the forecast period.

Core platforms form the foundational layer of the market, providing an integrated software suite that functions as a comprehensive infrastructure abstraction layer.

These solutions deliver a unified control plane for managing multi-stage AI workflows and complex model dependency issues inherent in state-of-the-art AI models.

Key functionalities include a centralized model registry and a unified feature store, which are essential for managing the lifecycle of assets.

As the industry moves toward intelligent process automation and LLMOps platform adoption, these systems incorporate advanced AIOps integration and robust model risk management capabilities.

Through model validation automation, these platforms can reduce deployment errors by over 35%, ensuring that containerized AI workloads are both reliable and compliant from development through production, enabling effective AI pipeline orchestration.

Request Free Sample

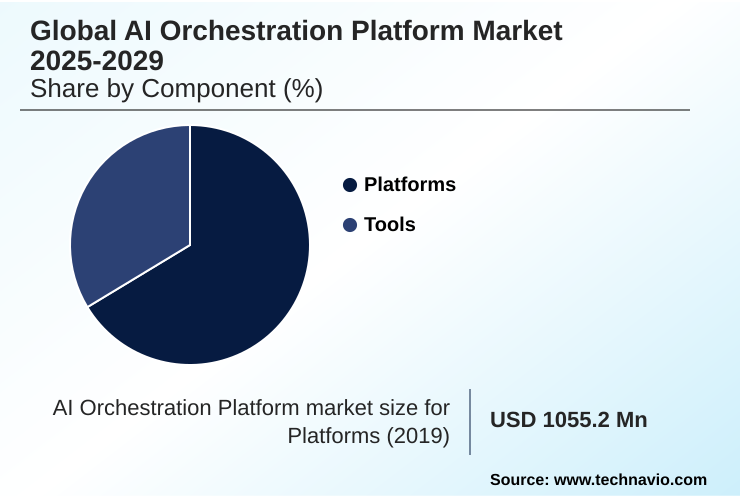
The Platforms segment was valued at USD 2.89 billion in 2023 and showed a gradual increase during the forecast period.

Request Free Sample

Regional Analysis

North America is estimated to contribute 41.4% to the growth of the global market during the forecast period.Technavio’s analysts have elaborately explained the regional trends and drivers that shape the market during the forecast period.

See How AI Orchestration Platform Market Demand is Rising in North America Request Free Sample

The geographic landscape is led by North America, which is projected to account for over 41% of the market's incremental growth, driven by mature enterprise adoption of production AI systems.

In this region, there is a strong focus on AI governance frameworks, end-to-end MLOps, and time-to-value acceleration. Companies prioritize solutions with robust algorithmic bias detection and immutable model versioning.

Concurrently, the APAC region is expanding rapidly, with a projected growth rate exceeding 33%, fueled by cloud-native adoption and a focus on technologies like serverless model inference and inference latency optimization.

Effective AI pipeline monitoring and AI model observability are becoming standard requirements across all leading regions to ensure system reliability and performance.

Market Dynamics

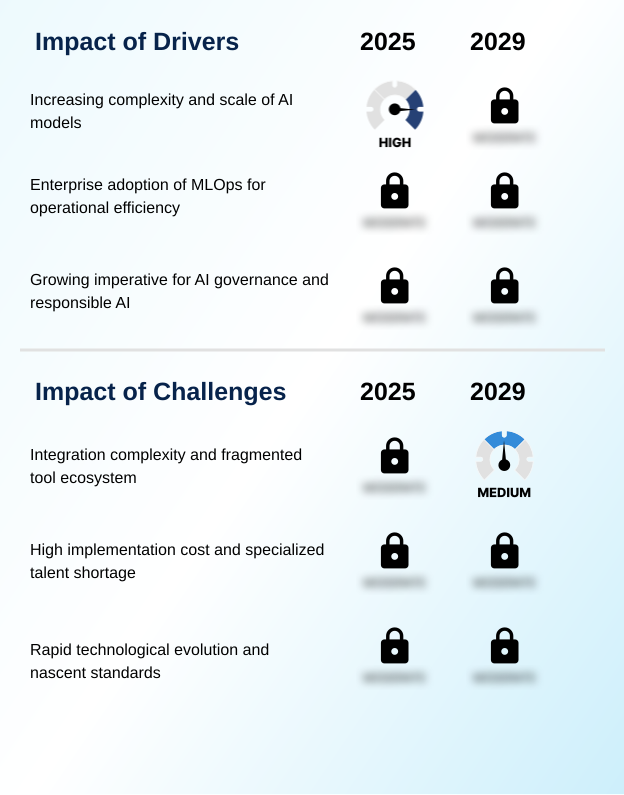
Our researchers analyzed the data with 2024 as the base year, along with the key drivers, trends, and challenges. A holistic analysis of drivers will help companies refine their marketing strategies to gain a competitive advantage.

  • The adoption of sophisticated AI orchestration platforms is accelerating as enterprises focus on enterprise MLOps for operational efficiency. A core objective is the end-to-end AI model lifecycle automation, which involves streamlining ML workflow with automation and implementing robust CI/CD integration for machine learning.
  • Organizations are actively automating AI model deployment pipelines and optimizing AI infrastructure with orchestration to achieve scalable operations. This includes managing GPU clusters for AI training and using a serverless AI model serving platform for efficient inference. A major focus is on AI orchestration for large language models, which requires orchestrating retrieval-augmented generation workflows and complex generative AI applications.
  • This has given rise to the need for LLM agent orchestration in enterprise settings. Centralized model governance and compliance is paramount, driving demand for automating AI governance and compliance and implementing AI orchestration for responsible AI principles. These AI model lifecycle management tools provide the necessary AI infrastructure resource management and AI workflow scheduling and management.
  • The market is also seeing specialization, with dedicated solutions for AI orchestration for financial services and AI orchestration in the healthcare sector. Data pipeline automation for machine learning is foundational, while hybrid cloud MLOps platform features enable multi-cloud AI workload portability and support for AI workload management for on-premises deployments.
  • Companies using these integrated systems often see regulatory reporting cycles shorten by more than half compared to those using fragmented, manual approaches.

What are the key market drivers leading to the rise in the adoption of AI Orchestration Platform Industry?

  • The increasing complexity and computational scale of modern artificial intelligence models serves as a primary market driver.

  • The drive for MLOps lifecycle automation is a primary market catalyst, enabling enterprise-grade AI deployment in high-stakes AI applications. Effective GPU resource management and computational resource allocation are critical for cost-effective model training and ensuring model reliability enhancement.
  • Organizations are adopting hybrid cloud AI orchestration and Kubernetes-based AI scheduling to create a scalable AI infrastructure that supports distributed training optimization. These platforms are instrumental for responsible AI implementation, providing auditable machine learning processes that are essential for governance.
  • The adoption of these systems improves resource utilization by up to 30% and reduces manual deployment errors by more than 50%, underscoring their value in complex operational environments.

What are the market trends shaping the AI Orchestration Platform Industry?

  • A defining market trend is the emergence of specialized LLMOps, which provides orchestration capabilities tailored to the unique lifecycle of generative AI and large language models.

  • A defining market trend is the rise of specialized capabilities for the generative AI lifecycle, leading to Data AI platform convergence. This shift supports complex foundation model operations through advanced prompt engineering pipelines and retrieval-augmented generation. The emergence of the autonomous agent framework, managed via workflow-as-code principles, enables sophisticated, multi-step task execution.
  • These innovations in a data-centric AI platform provide a collaborative development environment that also facilitates AI workload portability across different infrastructures. Such platforms improve real-time inference serving latency by over 40% while also handling batch processing optimization. Furthermore, advancements in AI supercomputer management enhance processing for both training and inference tasks, with some systems achieving 2x faster model training cycles.

What challenges does the AI Orchestration Platform Industry face during its growth?

  • Significant market growth is challenged by integration complexities that arise from a fragmented and diverse tool ecosystem.

  • A significant market challenge is achieving seamless AI workflow automation across fragmented toolsets, which complicates the implementation of reproducible AI pipelines and MLOps standardization. Although a multi-cloud control plane promises flexibility, integrating disparate systems for CI/CD for machine learning and automated data lineage remains complex and can increase initial setup costs by over 50%.
  • This fragmentation hinders the goals of achieving reduced manual overhead and consistent access control enforcement. Furthermore, implementing critical governance features like model drift monitoring, explainable AI integration, and regulatory audit trails requires significant engineering effort. This complexity is a barrier to adopting advanced practices like AI asset versioning and governance-as-code, with many firms reporting implementation timelines 40% longer than anticipated.

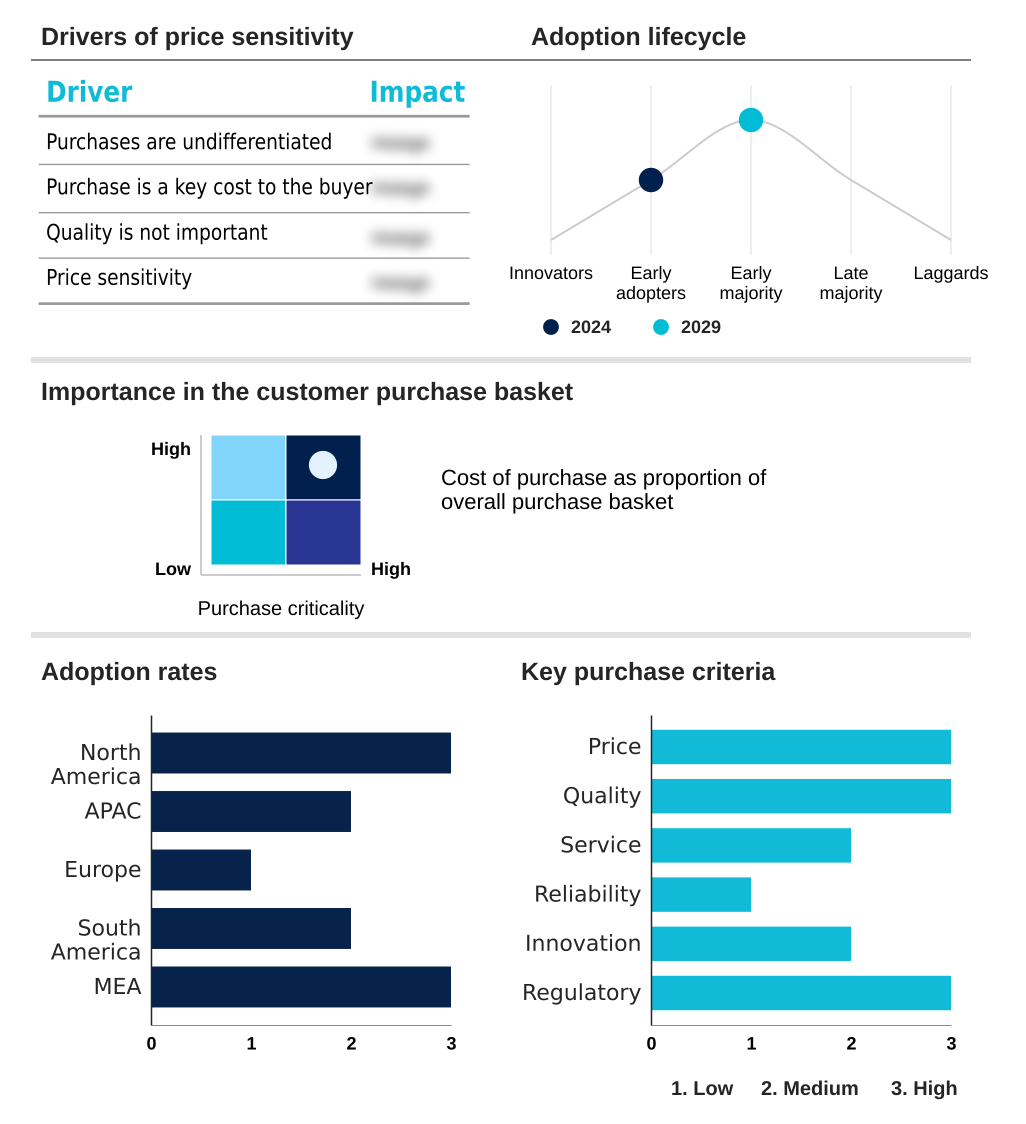
Exclusive Technavio Analysis on Customer Landscape

The ai orchestration platform market forecasting report includes the adoption lifecycle of the market, covering from the innovator’s stage to the laggard’s stage. It focuses on adoption rates in different regions based on penetration. Furthermore, the ai orchestration platform market report also includes key purchase criteria and drivers of price sensitivity to help companies evaluate and develop their market growth analysis strategies.

Customer Landscape of AI Orchestration Platform Industry

Competitive Landscape

Companies are implementing various strategies, such as strategic alliances, ai orchestration platform market forecast, partnerships, mergers and acquisitions, geographical expansion, and product/service launches, to enhance their presence in the industry.

Accenture PLC - Providing a unified software framework for automating the end-to-end AI model lifecycle, ensuring scalability, governance, and operational efficiency from development to production.

The industry research and growth report includes detailed analyses of the competitive landscape of the market and information about key companies, including:

  • Accenture PLC
  • ActiveEon SAS
  • Amazon.com Inc.
  • Apptio Inc.
  • BMC Software Inc.
  • Fujitsu Ltd.
  • Google LLC
  • HashiCorp Inc.
  • Hewlett Packard
  • IBM Corp.
  • Microsoft Corp.
  • New Relic Inc.
  • Oracle Corp.
  • Salesforce Inc.
  • SAP SE
  • ServiceNow Inc.
  • TIBCO Software Inc.
  • VMware Inc.
  • Wipro Ltd.

Qualitative and quantitative analysis of companies has been conducted to help clients understand the wider business environment as well as the strengths and weaknesses of key industry players. Data is qualitatively analyzed to categorize companies as pure play, category-focused, industry-focused, and diversified; it is quantitatively analyzed to categorize companies as dominant, leading, strong, tentative, and weak.

Recent Development and News in Ai orchestration platform market

  • In May, 2025, Nvidia announced its acquisition of Run.ai, a company specializing in orchestrating AI workloads and managing GPU resources across both on-premises data centers and cloud environments.
  • In February, 2025, GitLab announced a deeper native integration with DVC, an open-source data version control tool, reinforcing the convergence of software development and machine learning workflows.
  • In November, 2024, Amazon Web Services launched Agents for Amazon Bedrock, a managed service created specifically to orchestrate multi-step generative AI applications, enabling them to interact with enterprise data and APIs.
  • In September, 2024, Databricks announced its acquisition of MosaicML, a company specializing in technology to make the training of large-scale AI models more cost-effective and efficient.

Dive into Technavio’s robust research methodology, blending expert interviews, extensive data synthesis, and validated models for unparalleled AI Orchestration Platform Market insights. See full methodology.

Market Scope
Page number 266
Base year 2024
Historic period 2019-2023
Forecast period 2025-2029
Growth momentum & CAGR Accelerate at a CAGR of 31.7%
Market growth 2025-2029 USD 15742.3 million
Market structure Fragmented
YoY growth 2024-2025(%) 26.6%
Key countries US, Canada, China, India, Japan, South Korea, Australia, Germany, UK, France, Brazil, Argentina, Saudi Arabia and UAE
Competitive landscape Leading Companies, Market Positioning of Companies, Competitive Strategies, and Industry Risks

Request Free Sample

Research Analyst Overview

  • The AI orchestration market is defined by a push toward comprehensive MLOps lifecycle automation and AI workflow automation, which are critical for enterprise-grade AI deployment. Effective GPU resource management, Kubernetes-based AI scheduling, and distributed training optimization are central to managing production AI systems, especially for high-stakes AI applications.
  • A unified feature store and centralized model registry with immutable model versioning and automated data lineage support this process. The rise of the LLMOps platform is driving demand for prompt engineering pipelines and retrieval-augmented generation, while AIOps integration and intelligent process automation support broader efficiency goals.
  • For governance, AI governance frameworks with model risk management, regulatory audit trails, and algorithmic bias detection are crucial, often supported by explainable AI integration. The technological backbone includes a multi-cloud control plane for hybrid cloud AI orchestration, enabling containerized AI workloads and CI/CD for machine learning.
  • This focus on operational excellence, which improves processing times by over 30%, is geared toward optimizing both real-time inference serving and batch processing optimization, reducing inference latency optimization and ensuring robust model drift monitoring within an autonomous agent framework adhering to workflow-as-code principles.

What are the Key Data Covered in this AI Orchestration Platform Market Research and Growth Report?

  • What is the expected growth of the AI Orchestration Platform Market between 2025 and 2029?

    • USD 15.74 billion, at a CAGR of 31.7%

  • What segmentation does the market report cover?

    • The report is segmented by Component (Platforms, and Tools), Deployment (On-premises, and Cloud-based), Application (ML workflow, LLM agent, Data pipeline automation, AI workflow scheduling, and Others) and Geography (North America, APAC, Europe, South America, Middle East and Africa)

  • Which regions are analyzed in the report?

    • North America, APAC, Europe, South America and Middle East and Africa

  • What are the key growth drivers and market challenges?

    • Increasing complexity and scale of AI models, Integration complexity and fragmented tool ecosystem

  • Who are the major players in the AI Orchestration Platform Market?

    • Accenture PLC, ActiveEon SAS, Amazon.com Inc., Apptio Inc., BMC Software Inc., Fujitsu Ltd., Google LLC, HashiCorp Inc., Hewlett Packard, IBM Corp., Microsoft Corp., New Relic Inc., Oracle Corp., Salesforce Inc., SAP SE, ServiceNow Inc., TIBCO Software Inc., VMware Inc. and Wipro Ltd.

Market Research Insights

  • The market is driven by the need for MLOps standardization and end-to-end MLOps to achieve time-to-value acceleration in deploying state-of-the-art AI models. By providing an infrastructure abstraction layer, these platforms enable cost-effective model training and model reliability enhancement, with some users reporting a 30% reduction in computational resource allocation costs.
  • Key functions include AI pipeline orchestration and AI pipeline monitoring to manage complex model dependency issues across multi-stage AI workflows, leading to reproducible AI pipelines. This approach facilitates a collaborative development environment and ensures AI workload portability across a scalable AI infrastructure.
  • With a focus on responsible AI implementation and auditable machine learning, platforms offer access control enforcement and governance-as-code, including model behavior guardrails. Automating the generative AI lifecycle and foundation model operations improves AI model observability, while AI asset versioning is crucial for compliance.
  • Strategic AI infrastructure optimization, including AI supercomputer management, can improve resource utilization by up to 45%, significantly reducing manual overhead.

We can help! Our analysts can customize this ai orchestration platform market research report to meet your requirements.

Get in touch

1. Executive Summary

1.1 Market overview

Executive Summary - Chart on Market Overview
Executive Summary - Data Table on Market Overview
Executive Summary - Chart on Global Market Characteristics
Executive Summary - Chart on Market by Geography
Executive Summary - Chart on Market Segmentation by Component
Executive Summary - Chart on Market Segmentation by Deployment
Executive Summary - Chart on Market Segmentation by Application
Executive Summary - Chart on Incremental Growth
Executive Summary - Data Table on Incremental Growth
Executive Summary - Chart on Company Market Positioning

2. Technavio Analysis

2.1 Analysis of price sensitivity, lifecycle, customer purchase basket, adoption rates, and purchase criteria

2.2 Criticality of inputs and Factors of differentiation

Chart on Overview on criticality of inputs and factors of differentiation

2.3 Factors of disruption

Chart on Overview on factors of disruption

2.4 Impact of drivers and challenges

Chart on Impact of drivers and challenges in 2024 and 2029

3. Market Landscape

3.1 Market ecosystem

Chart on Parent Market
Data Table on - Parent Market

3.2 Market characteristics

Chart on Market characteristics analysis

3.3 Value chain analysis

Chart on Value chain analysis

4. Market Sizing

4.1 Market definition

Data Table on Offerings of companies included in the market definition

4.2 Market segment analysis

Market segments

4.3 Market size 2024

4.4 Market outlook: Forecast for 2024-2029

Chart on Global - Market size and forecast 2024-2029 ($ million)
Data Table on Global - Market size and forecast 2024-2029 ($ million)
Chart on Global Market: Year-over-year growth 2024-2029 (%)
Data Table on Global Market: Year-over-year growth 2024-2029 (%)

5. Historic Market Size

5.1 Global AI Orchestration Platform Market 2019 - 2023

Historic Market Size - Data Table on Global AI Orchestration Platform Market 2019 - 2023 ($ million)

5.2 Component segment analysis 2019 - 2023

Historic Market Size - Component Segment 2019 - 2023 ($ million)

5.3 Deployment segment analysis 2019 - 2023

Historic Market Size - Deployment Segment 2019 - 2023 ($ million)

5.4 Application segment analysis 2019 - 2023

Historic Market Size - Application Segment 2019 - 2023 ($ million)

5.5 Geography segment analysis 2019 - 2023

Historic Market Size - Geography Segment 2019 - 2023 ($ million)

5.6 Country segment analysis 2019 - 2023

Historic Market Size - Country Segment 2019 - 2023 ($ million)

6. Five Forces Analysis

6.1 Five forces summary

Five forces analysis - Comparison between 2024 and 2029

6.2 Bargaining power of buyers

Bargaining power of buyers - Impact of key factors 2024 and 2029

6.3 Bargaining power of suppliers

Bargaining power of suppliers - Impact of key factors in 2024 and 2029

6.4 Threat of new entrants

Threat of new entrants - Impact of key factors in 2024 and 2029

6.5 Threat of substitutes

Threat of substitutes - Impact of key factors in 2024 and 2029

6.6 Threat of rivalry

Threat of rivalry - Impact of key factors in 2024 and 2029

6.7 Market condition

Chart on Market condition - Five forces 2024 and 2029

7. Market Segmentation by Component

7.1 Market segments

Chart on Component - Market share 2024-2029 (%)
Data Table on Component - Market share 2024-2029 (%)

7.2 Comparison by Component

Chart on Comparison by Component
Data Table on Comparison by Component

7.3 Platforms - Market size and forecast 2024-2029

Chart on Platforms - Market size and forecast 2024-2029 ($ million)
Data Table on Platforms - Market size and forecast 2024-2029 ($ million)
Chart on Platforms - Year-over-year growth 2024-2029 (%)
Data Table on Platforms - Year-over-year growth 2024-2029 (%)

7.4 Tools - Market size and forecast 2024-2029

Chart on Tools - Market size and forecast 2024-2029 ($ million)
Data Table on Tools - Market size and forecast 2024-2029 ($ million)
Chart on Tools - Year-over-year growth 2024-2029 (%)
Data Table on Tools - Year-over-year growth 2024-2029 (%)

7.5 Market opportunity by Component

Market opportunity by Component ($ million)
Data Table on Market opportunity by Component ($ million)

8. Market Segmentation by Deployment

8.1 Market segments

Chart on Deployment - Market share 2024-2029 (%)
Data Table on Deployment - Market share 2024-2029 (%)

8.2 Comparison by Deployment

Chart on Comparison by Deployment
Data Table on Comparison by Deployment

8.3 On-premises - Market size and forecast 2024-2029

Chart on On-premises - Market size and forecast 2024-2029 ($ million)
Data Table on On-premises - Market size and forecast 2024-2029 ($ million)
Chart on On-premises - Year-over-year growth 2024-2029 (%)
Data Table on On-premises - Year-over-year growth 2024-2029 (%)

8.4 Cloud-based - Market size and forecast 2024-2029

Chart on Cloud-based - Market size and forecast 2024-2029 ($ million)
Data Table on Cloud-based - Market size and forecast 2024-2029 ($ million)
Chart on Cloud-based - Year-over-year growth 2024-2029 (%)
Data Table on Cloud-based - Year-over-year growth 2024-2029 (%)

8.5 Market opportunity by Deployment

Market opportunity by Deployment ($ million)
Data Table on Market opportunity by Deployment ($ million)

9. Market Segmentation by Application

9.1 Market segments

Chart on Application - Market share 2024-2029 (%)
Data Table on Application - Market share 2024-2029 (%)

9.2 Comparison by Application

Chart on Comparison by Application
Data Table on Comparison by Application

9.3 ML workflow - Market size and forecast 2024-2029

Chart on ML workflow - Market size and forecast 2024-2029 ($ million)
Data Table on ML workflow - Market size and forecast 2024-2029 ($ million)
Chart on ML workflow - Year-over-year growth 2024-2029 (%)
Data Table on ML workflow - Year-over-year growth 2024-2029 (%)

9.4 LLM agent - Market size and forecast 2024-2029

Chart on LLM agent - Market size and forecast 2024-2029 ($ million)
Data Table on LLM agent - Market size and forecast 2024-2029 ($ million)
Chart on LLM agent - Year-over-year growth 2024-2029 (%)
Data Table on LLM agent - Year-over-year growth 2024-2029 (%)

9.5 Data pipeline automation - Market size and forecast 2024-2029

Chart on Data pipeline automation - Market size and forecast 2024-2029 ($ million)
Data Table on Data pipeline automation - Market size and forecast 2024-2029 ($ million)
Chart on Data pipeline automation - Year-over-year growth 2024-2029 (%)
Data Table on Data pipeline automation - Year-over-year growth 2024-2029 (%)

9.6 AI workflow scheduling - Market size and forecast 2024-2029

Chart on AI workflow scheduling - Market size and forecast 2024-2029 ($ million)
Data Table on AI workflow scheduling - Market size and forecast 2024-2029 ($ million)
Chart on AI workflow scheduling - Year-over-year growth 2024-2029 (%)
Data Table on AI workflow scheduling - Year-over-year growth 2024-2029 (%)

9.7 Others - Market size and forecast 2024-2029

Chart on Others - Market size and forecast 2024-2029 ($ million)
Data Table on Others - Market size and forecast 2024-2029 ($ million)
Chart on Others - Year-over-year growth 2024-2029 (%)
Data Table on Others - Year-over-year growth 2024-2029 (%)

9.8 Market opportunity by Application

Market opportunity by Application ($ million)
Data Table on Market opportunity by Application ($ million)

10. Customer Landscape

10.1 Customer landscape overview

Analysis of price sensitivity, lifecycle, customer purchase basket, adoption rates, and purchase criteria

11. Geographic Landscape

11.1 Geographic segmentation

Chart on Market share by geography 2024-2029 (%)
Data Table on Market share by geography 2024-2029 (%)

11.2 Geographic comparison

Chart on Geographic comparison
Data Table on Geographic comparison

11.3 North America - Market size and forecast 2024-2029

Chart on North America - Market size and forecast 2024-2029 ($ million)
Data Table on North America - Market size and forecast 2024-2029 ($ million)
Chart on North America - Year-over-year growth 2024-2029 (%)
Data Table on North America - Year-over-year growth 2024-2029 (%)
Chart on Regional Comparison - North America
Data Table on Regional Comparison - North America

11.3.1 US - Market size and forecast 2024-2029

Chart on US - Market size and forecast 2024-2029 ($ million)
Data Table on US - Market size and forecast 2024-2029 ($ million)
Chart on US - Year-over-year growth 2024-2029 (%)
Data Table on US - Year-over-year growth 2024-2029 (%)

11.3.2 Canada - Market size and forecast 2024-2029

Chart on Canada - Market size and forecast 2024-2029 ($ million)
Data Table on Canada - Market size and forecast 2024-2029 ($ million)
Chart on Canada - Year-over-year growth 2024-2029 (%)
Data Table on Canada - Year-over-year growth 2024-2029 (%)

11.4 APAC - Market size and forecast 2024-2029

Chart on APAC - Market size and forecast 2024-2029 ($ million)
Data Table on APAC - Market size and forecast 2024-2029 ($ million)
Chart on APAC - Year-over-year growth 2024-2029 (%)
Data Table on APAC - Year-over-year growth 2024-2029 (%)
Chart on Regional Comparison - APAC
Data Table on Regional Comparison - APAC

11.4.1 China - Market size and forecast 2024-2029

Chart on China - Market size and forecast 2024-2029 ($ million)
Data Table on China - Market size and forecast 2024-2029 ($ million)
Chart on China - Year-over-year growth 2024-2029 (%)
Data Table on China - Year-over-year growth 2024-2029 (%)

11.4.2 India - Market size and forecast 2024-2029

Chart on India - Market size and forecast 2024-2029 ($ million)
Data Table on India - Market size and forecast 2024-2029 ($ million)
Chart on India - Year-over-year growth 2024-2029 (%)
Data Table on India - Year-over-year growth 2024-2029 (%)

11.4.3 Japan - Market size and forecast 2024-2029

Chart on Japan - Market size and forecast 2024-2029 ($ million)
Data Table on Japan - Market size and forecast 2024-2029 ($ million)
Chart on Japan - Year-over-year growth 2024-2029 (%)
Data Table on Japan - Year-over-year growth 2024-2029 (%)

11.4.4 South Korea - Market size and forecast 2024-2029

Chart on South Korea - Market size and forecast 2024-2029 ($ million)
Data Table on South Korea - Market size and forecast 2024-2029 ($ million)
Chart on South Korea - Year-over-year growth 2024-2029 (%)
Data Table on South Korea - Year-over-year growth 2024-2029 (%)

11.4.5 Australia - Market size and forecast 2024-2029

Chart on Australia - Market size and forecast 2024-2029 ($ million)
Data Table on Australia - Market size and forecast 2024-2029 ($ million)
Chart on Australia - Year-over-year growth 2024-2029 (%)
Data Table on Australia - Year-over-year growth 2024-2029 (%)

11.5 Europe - Market size and forecast 2024-2029

Chart on Europe - Market size and forecast 2024-2029 ($ million)
Data Table on Europe - Market size and forecast 2024-2029 ($ million)
Chart on Europe - Year-over-year growth 2024-2029 (%)
Data Table on Europe - Year-over-year growth 2024-2029 (%)
Chart on Regional Comparison - Europe
Data Table on Regional Comparison - Europe

11.5.1 Germany - Market size and forecast 2024-2029

Chart on Germany - Market size and forecast 2024-2029 ($ million)
Data Table on Germany - Market size and forecast 2024-2029 ($ million)
Chart on Germany - Year-over-year growth 2024-2029 (%)
Data Table on Germany - Year-over-year growth 2024-2029 (%)

11.5.2 UK - Market size and forecast 2024-2029

Chart on UK - Market size and forecast 2024-2029 ($ million)
Data Table on UK - Market size and forecast 2024-2029 ($ million)
Chart on UK - Year-over-year growth 2024-2029 (%)
Data Table on UK - Year-over-year growth 2024-2029 (%)

11.5.3 France - Market size and forecast 2024-2029

Chart on France - Market size and forecast 2024-2029 ($ million)
Data Table on France - Market size and forecast 2024-2029 ($ million)
Chart on France - Year-over-year growth 2024-2029 (%)
Data Table on France - Year-over-year growth 2024-2029 (%)

11.6 South America - Market size and forecast 2024-2029

Chart on South America - Market size and forecast 2024-2029 ($ million)
Data Table on South America - Market size and forecast 2024-2029 ($ million)
Chart on South America - Year-over-year growth 2024-2029 (%)
Data Table on South America - Year-over-year growth 2024-2029 (%)
Chart on Regional Comparison - South America
Data Table on Regional Comparison - South America

11.6.1 Brazil - Market size and forecast 2024-2029

Chart on Brazil - Market size and forecast 2024-2029 ($ million)
Data Table on Brazil - Market size and forecast 2024-2029 ($ million)
Chart on Brazil - Year-over-year growth 2024-2029 (%)
Data Table on Brazil - Year-over-year growth 2024-2029 (%)

11.6.2 Argentina - Market size and forecast 2024-2029

Chart on Argentina - Market size and forecast 2024-2029 ($ million)
Data Table on Argentina - Market size and forecast 2024-2029 ($ million)
Chart on Argentina - Year-over-year growth 2024-2029 (%)
Data Table on Argentina - Year-over-year growth 2024-2029 (%)

11.7 Middle East and Africa - Market size and forecast 2024-2029

Chart on Middle East and Africa - Market size and forecast 2024-2029 ($ million)
Data Table on Middle East and Africa - Market size and forecast 2024-2029 ($ million)
Chart on Middle East and Africa - Year-over-year growth 2024-2029 (%)
Data Table on Middle East and Africa - Year-over-year growth 2024-2029 (%)
Chart on Regional Comparison - Middle East and Africa
Data Table on Regional Comparison - Middle East and Africa

11.7.1 Saudi Arabia - Market size and forecast 2024-2029

Chart on Saudi Arabia - Market size and forecast 2024-2029 ($ million)
Data Table on Saudi Arabia - Market size and forecast 2024-2029 ($ million)
Chart on Saudi Arabia - Year-over-year growth 2024-2029 (%)
Data Table on Saudi Arabia - Year-over-year growth 2024-2029 (%)

11.7.2 UAE - Market size and forecast 2024-2029

Chart on UAE - Market size and forecast 2024-2029 ($ million)
Data Table on UAE - Market size and forecast 2024-2029 ($ million)
Chart on UAE - Year-over-year growth 2024-2029 (%)
Data Table on UAE - Year-over-year growth 2024-2029 (%)

11.8 Market opportunity by geography

Market opportunity by geography ($ million)
Data Tables on Market opportunity by geography ($ million)

12. Drivers, Challenges, and Opportunity

12.1 Market drivers

Increasing complexity and scale of AI models
Enterprise adoption of MLOps for operational efficiency
Growing imperative for AI governance and responsible AI

12.2 Market challenges

Integration complexity and fragmented tool ecosystem
High implementation cost and specialized talent shortage
Rapid technological evolution and nascent standards

12.3 Impact of drivers and challenges

Impact of drivers and challenges in 2024 and 2029

12.4 Market opportunities

Emergence of specialized LLMOps and generative AI orchestration
Convergence of data platforms and AI orchestration
Intensified focus on hybrid and multi-cloud orchestration

13. Competitive Landscape

13.1 Overview

13.2

Overview on criticality of inputs and factors of differentiation

13.3 Landscape disruption

Overview on factors of disruption

13.4 Industry risks

Impact of key risks on business

14. Competitive Analysis

14.1 Companies profiled

Companies covered

14.2 Company ranking index

14.3 Market positioning of companies

Matrix on companies position and classification

14.4 Accenture PLC

Accenture PLC - Overview
Accenture PLC - Business segments
Accenture PLC - Key news
Accenture PLC - Key offerings
Accenture PLC - Segment focus
SWOT

14.5 Amazon.com Inc.

Amazon.com Inc. - Overview
Amazon.com Inc. - Business segments
Amazon.com Inc. - Key news
Amazon.com Inc. - Key offerings
Amazon.com Inc. - Segment focus
SWOT

14.6 BMC Software Inc.

BMC Software Inc. - Overview
BMC Software Inc. - Product / Service
BMC Software Inc. - Key offerings
SWOT

14.7 Fujitsu Ltd.

Fujitsu Ltd. - Overview
Fujitsu Ltd. - Business segments
Fujitsu Ltd. - Key news
Fujitsu Ltd. - Key offerings
Fujitsu Ltd. - Segment focus
SWOT

14.8 Google LLC

Google LLC - Overview
Google LLC - Product / Service
Google LLC - Key offerings
SWOT

14.9 Hewlett Packard

Hewlett Packard - Overview
Hewlett Packard - Business segments
Hewlett Packard - Key news
Hewlett Packard - Key offerings
Hewlett Packard - Segment focus
SWOT

14.10 IBM Corp.

IBM Corp. - Overview
IBM Corp. - Business segments
IBM Corp. - Key news
IBM Corp. - Key offerings
IBM Corp. - Segment focus
SWOT

14.11 Microsoft Corp.

Microsoft Corp. - Overview
Microsoft Corp. - Business segments
Microsoft Corp. - Key news
Microsoft Corp. - Key offerings
Microsoft Corp. - Segment focus
SWOT

14.12 Oracle Corp.

Oracle Corp. - Overview
Oracle Corp. - Business segments
Oracle Corp. - Key news
Oracle Corp. - Key offerings
Oracle Corp. - Segment focus
SWOT

14.13 Salesforce Inc.

Salesforce Inc. - Overview
Salesforce Inc. - Product / Service
Salesforce Inc. - Key news
Salesforce Inc. - Key offerings
SWOT

14.14 SAP SE

SAP SE - Overview
SAP SE - Business segments
SAP SE - Key news
SAP SE - Key offerings
SAP SE - Segment focus
SWOT

14.15 ServiceNow Inc.

ServiceNow Inc. - Overview
ServiceNow Inc. - Product / Service
ServiceNow Inc. - Key news
ServiceNow Inc. - Key offerings
SWOT

14.16 TIBCO Software Inc.

TIBCO Software Inc. - Overview
TIBCO Software Inc. - Product / Service
TIBCO Software Inc. - Key offerings
SWOT

14.17 VMware Inc.

VMware Inc. - Overview
VMware Inc. - Product / Service
VMware Inc. - Key offerings
SWOT

14.18 Wipro Ltd.

Wipro Ltd. - Overview
Wipro Ltd. - Business segments
Wipro Ltd. - Key news
Wipro Ltd. - Key offerings
Wipro Ltd. - Segment focus
SWOT

15. Appendix

15.1 Scope of the report

Market definition
Objectives
Notes and caveats

15.2 Inclusions and exclusions checklist

Inclusions checklist
Exclusions checklist

15.3 Currency conversion rates for US$

15.4 Research methodology

15.5 Data procurement

Information sources

15.6 Data validation

15.7 Validation techniques employed for market sizing

15.8 Data synthesis

15.9 360 degree market analysis

15.10 List of abbreviations

Research Methodology

Technavio presents a detailed picture of the market by way of study, synthesis, and summation of data from multiple sources. The analysts have presented the various facets of the market with a particular focus on identifying the key industry influencers. The data thus presented is comprehensive, reliable, and the result of extensive research, both primary and secondary.

INFORMATION SOURCES

Primary sources

  • Manufacturers and suppliers
  • Channel partners
  • Industry experts
  • Strategic decision makers

Secondary sources

  • Industry journals and periodicals
  • Government data
  • Financial reports of key industry players
  • Historical data
  • Press releases

DATA ANALYSIS

Data Synthesis

  • Collation of data
  • Estimation of key figures
  • Analysis of derived insights

Data Validation

  • Triangulation with data models
  • Reference against proprietary databases
  • Corroboration with industry experts

REPORT WRITING

Qualitative

  • Market drivers
  • Market challenges
  • Market trends
  • Five forces analysis

Quantitative

  • Market size and forecast
  • Market segmentation
  • Geographical insights
  • Competitive landscape

Interested in this report?

Get your sample now to see our research methodology and insights!

Download Now

Frequently Asked Questions

AI Orchestration Platform market growth will increase by USD 15742.3 million during 2025-2029.

The AI Orchestration Platform market is expected to grow at a CAGR of 31.7% during 2025-2029.

AI Orchestration Platform market is segmented by Component (Platforms, Tools) Deployment (On-premises, Cloud-based) Application (ML workflow, LLM agent, Data pipeline automation, AI workflow scheduling, Others)

Accenture PLC, ActiveEon SAS, Amazon.com Inc., Apptio Inc., BMC Software Inc., Fujitsu Ltd., Google LLC, HashiCorp Inc., Hewlett Packard, IBM Corp., Microsoft Corp., New Relic Inc., Oracle Corp., Salesforce Inc., SAP SE, ServiceNow Inc., TIBCO Software Inc., VMware Inc., Wipro Ltd. are a few of the key vendors in the AI Orchestration Platform market.

North America will register the highest growth rate of 41.4% among the other regions. Therefore, the AI Orchestration Platform market in North America is expected to garner significant business opportunities for the vendors during the forecast period.

US, Canada, China, India, Japan, South Korea, Australia, Germany, UK, France, Brazil, Argentina, Saudi Arabia, UAE

  • Increasing complexity and scale of AI models is the driving factor this market.

The AI Orchestration Platform market vendors should focus on grabbing business opportunities from the Component segment as it accounted for the largest market share in the base year.