
AI Server Security Market Size 2025-2029
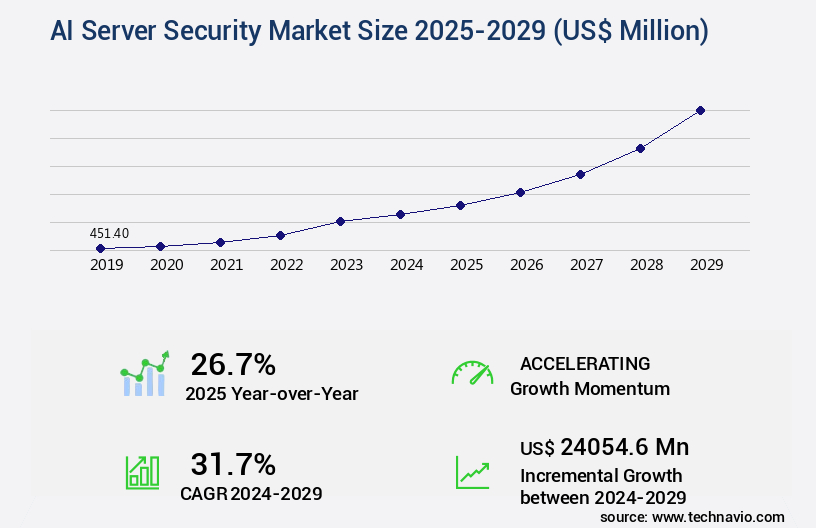
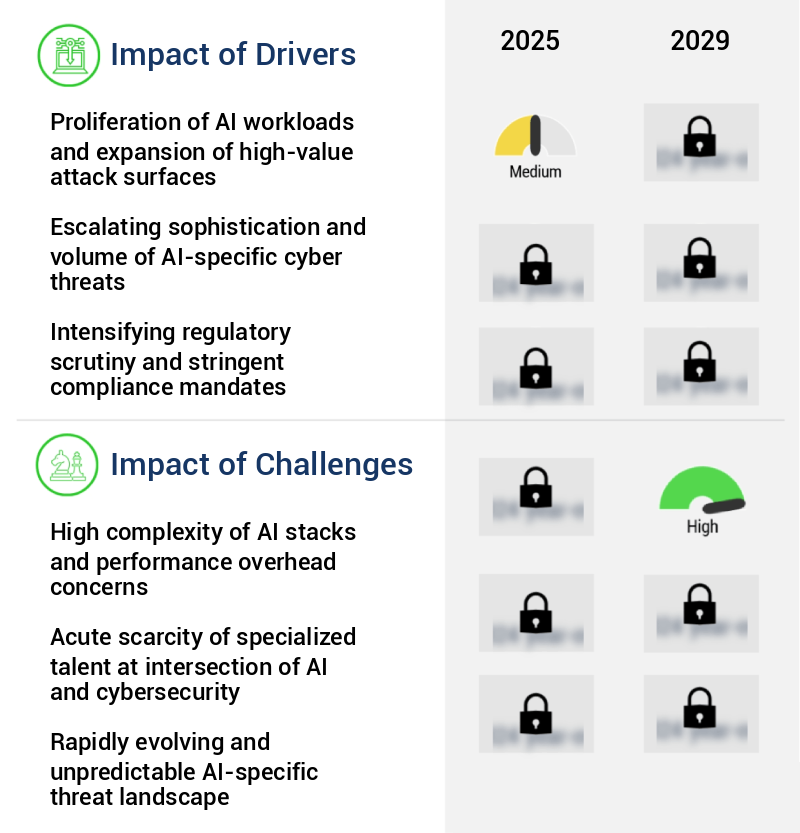
The ai server security market size is valued to increase by USD 24.05 billion, at a CAGR of 31.7% from 2024 to 2029. Proliferation of AI workloads and expansion of high-value attack surfaces will drive the ai server security market.
Major Market Trends & Insights
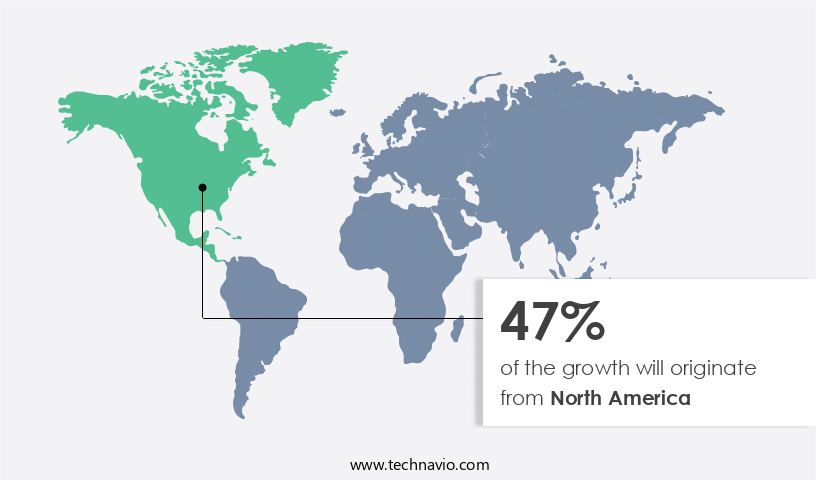
- North America dominated the market and accounted for a 47% growth during the forecast period.
- By Component - Hardware segment was valued at USD 195.50 billion in 2023
- By Deployment - Cloud-based segment accounted for the largest market revenue share in 2023
Market Size & Forecast
- Market Opportunities: USD 7.00 million
- Market Future Opportunities: USD 24054.60 million
- CAGR from 2024 to 2029 : 31.7%
Market Summary
- Amidst the increasing adoption of artificial intelligence (AI) in businesses, the market experiences significant growth. According to recent estimates, the market is projected to reach a value of USD12.6 billion by 2026, driven by the proliferation of AI workloads and the expansion of high-value attack surfaces. This growth is fueled by the convergence towards shift-left security and the rise of MLSecOps, which aim to secure AI systems from the development stage. However, the complexity of AI stacks and the performance overhead concerns pose challenges for the market.
- These challenges necessitate advanced security solutions that can effectively protect AI systems while maintaining optimal performance. As businesses continue to integrate AI into their operations, the demand for robust AI server security solutions will persistently increase.
What will be the Size of the AI Server Security Market during the forecast period?
Get Key Insights on Market Forecast (PDF) Request Free Sample
How is the AI Server Security Market Segmented ?
The ai server security industry research report provides comprehensive data (region-wise segment analysis), with forecasts and estimates in "USD million" for the period 2025-2029, as well as historical data from 2019-2023 for the following segments.
- Component
- Hardware
- Software
- Services
- Deployment
- Cloud-based
- On premises
- Application
- Network security
- Cloud security
- Endpoint security
- Application security
- End-user
- BFSI
- Healthcare and life sciences
- Government and defense
- IT and telecommunications
- Others
- Geography
- North America
- US
- Canada
- Europe
- France
- Germany
- UK
- APAC
- Australia
- China
- India
- Japan
- South Korea
- Rest of World (ROW)
- North America
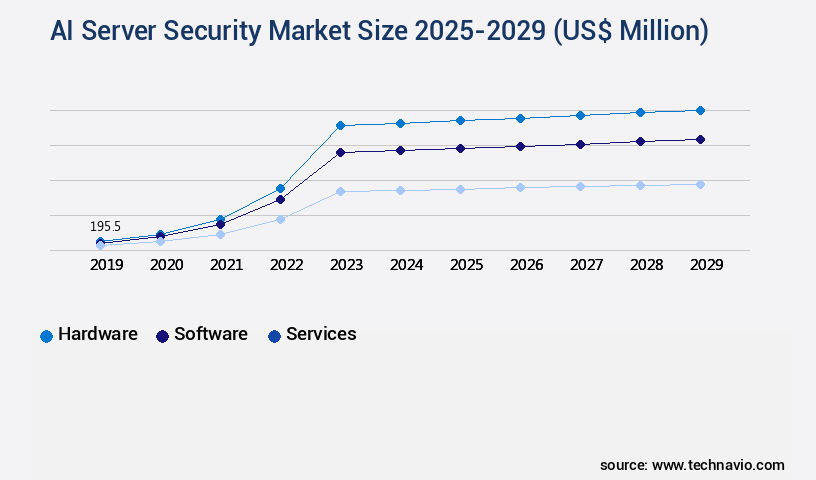
By Component Insights
The hardware segment is estimated to witness significant growth during the forecast period.
The market is a dynamic and ever-evolving landscape, with ongoing activities and emerging patterns shaping its development. Key components include data masking techniques, penetration testing services, and malware detection algorithms, which are integral to securing AI workloads. Machine learning security solutions, such as authentication mechanisms, virtual patching techniques, and vulnerability scanning tools, are crucial for maintaining secure devops pipelines and implementing network security protocols. Zero trust architecture, data encryption methods, endpoint detection response, encryption key management, security auditing practices, and incident response planning are also essential elements. The market further encompasses anomaly detection systems, threat modeling techniques, security information events, risk assessment frameworks, authorization frameworks, serverless security measures, cloud security posture, deep learning security, behavioral analytics, and AI model security.
Threat intelligence platforms, data loss prevention, compliance certifications, security orchestration automation, and various AI-driven security solutions are also gaining traction. According to recent estimates, The market is projected to grow at a compound annual growth rate of 32.5% between 2021 and 2028, underscoring its significant potential and importance in the digital landscape.
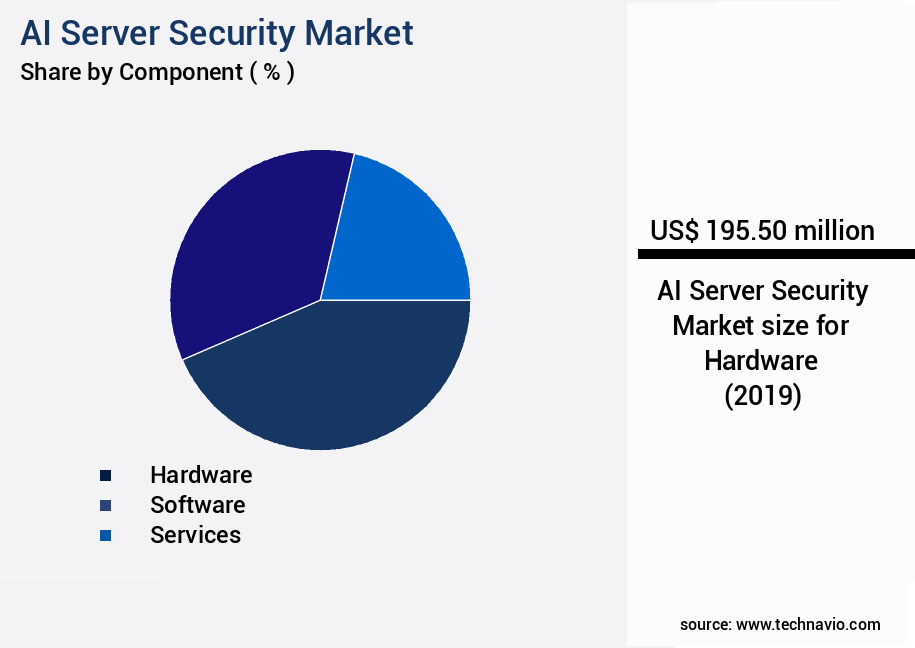
The Hardware segment was valued at USD 195.50 billion in 2019 and showed a gradual increase during the forecast period.
Regional Analysis
North America is estimated to contribute 47% to the growth of the global market during the forecast period.Technavio’s analysts have elaborately explained the regional trends and drivers that shape the market during the forecast period.
See How AI Server Security Market Demand is Rising in North America Request Free Sample
The market is witnessing significant growth, driven by the increasing adoption of artificial intelligence (AI) technologies across various industries. According to recent studies, the market is projected to expand at a steady pace, with North America leading the charge. This region currently holds the largest market share, owing to the presence of numerous technology corporations, hyperscale cloud providers, and dedicated AI research laboratories. These entities are not only producing advanced AI models but also consuming massive amounts of high-performance servers for training and inference tasks. The immense investment in AI, both from private sector companies and government bodies, creates a vast and intricate attack surface.
European and Asian markets are also expected to witness substantial growth due to the rising demand for advanced security solutions to protect AI infrastructure from cyber threats. The market's dynamics are influenced by factors such as the increasing adoption of cloud-based AI solutions, the growing complexity of AI systems, and the need for regulatory compliance.
Market Dynamics
Our researchers analyzed the data with 2024 as the base year, along with the key drivers, trends, and challenges. A holistic analysis of drivers will help companies refine their marketing strategies to gain a competitive advantage.
The market is experiencing significant growth as businesses increasingly rely on artificial intelligence (AI) to drive innovation and gain competitive advantages. However, this reliance on AI also brings new security challenges that must be addressed to protect sensitive data and mitigate risks. Implementing robust access control is a critical aspect of securing AI servers. This includes implementing multi-factor authentication, role-based access control, and other access management best practices. Detecting advanced persistent threats (APTs) is another essential function of AI server security. APTs are sophisticated, targeted attacks that can evade traditional security measures. AI-powered threat detection systems can help identify and respond to these threats in real-time. Mitigating AI model vulnerabilities is another key area of focus for AI server security. AI models can be vulnerable to attacks such as adversarial examples and model poisoning. Effective strategies for mitigating these vulnerabilities include data augmentation, model hardening, and input validation. Managing encryption keys securely is also essential for AI server security. Encryption keys are critical components of data security, and their loss or compromise can lead to significant data breaches. Effective key management practices include using hardware security modules, implementing key rotation policies, and implementing access controls for key management. Automating security incident response is another important aspect of AI server security. Security incidents can occur at any time, and a swift response is essential to minimize damage. AI-powered security incident response systems can help automate the response process, reducing the time it takes to contain and mitigate threats. Ensuring compliance with regulations is also a critical aspect of AI server security. Regulations such as GDPR and HIPAA impose strict requirements on data security and privacy. Effective compliance strategies include implementing data loss prevention measures, performing regular security audits, and leveraging threat intelligence platforms to stay informed about emerging threats and vulnerabilities. Building secure AI serverless functions is another area of focus for AI server security. Serverless architectures offer many benefits, but they also introduce new security challenges. Effective strategies for securing serverless functions include implementing access controls, using encryption, and implementing secure coding practices. In conclusion, securing AI servers requires a multi-faceted approach that includes implementing robust access control, detecting advanced persistent threats, mitigating AI model vulnerabilities, managing encryption keys securely, automating security incident response, ensuring compliance with regulations, building secure AI serverless functions, deploying effective data loss prevention, leveraging threat intelligence platforms, integrating security into devops pipelines, performing regular security audits, monitoring AI model performance metrics, developing effective penetration testing strategies, managing container security effectively, enhancing data encryption methods for AI, protecting sensitive data in AI systems, implementing zero trust security model, using behavioral biometrics for authentication, and applying machine learning for threat detection. By implementing these strategies, organizations can ensure the security and integrity of their AI systems and protect against emerging threats.
What are the key market drivers leading to the rise in the adoption of AI Server Security Industry?
- The proliferation of artificial intelligence workloads and the subsequent expansion of high-value attack surfaces serve as the primary catalyst for market growth.
- The market is experiencing unprecedented growth due to the widespread adoption of artificial intelligence and machine learning technologies across various sectors. Organizations are no longer limiting AI usage to experimental projects but are integrating it into their core operations, from financial modeling and healthcare diagnostics to supply chain optimization and autonomous systems control. This pervasive integration has resulted in a significant increase in the deployment of AI servers, both on-premises and in the cloud. This proliferation of AI servers presents a new and valuable attack surface for cyber adversaries, as they target the proprietary AI models, sensitive datasets, and high-performance computing infrastructure that powers these workloads.
- According to recent estimates, the number of AI servers in use is projected to reach over 10 million by 2025, representing a substantial increase from the current market size. The potential financial and competitive implications of a successful cyberattack on an AI server are significant, making robust security solutions an essential investment for organizations.
What are the market trends shaping the AI Server Security Industry?
- Shift-left security and machine learning security operations (MLSecOps) are emerging as the market trend, with a convergence towards these approaches being mandatory for modern security strategies.
- The market is undergoing a significant transformation, transitioning from conventional, perimeter-based security to a proactive, integrated approach called MLSecOps. This shift mirrors the DevSecOps evolution in software development, embedding security principles and automated controls throughout the machine learning lifecycle. From data sourcing and model design to deployment, monitoring, and retirement, security is no longer an afterthought or final checkpoint but a continuous, collaborative responsibility for data scientists, ML engineers, and security teams.
- Traditional security reviews, which can create bottlenecks and often fail to address ML pipeline-specific vulnerabilities, are rendered impractical and ineffective by the rapid, iterative nature of AI development.
What challenges does the AI Server Security Industry face during its growth?
- The intricate complexity of artificial intelligence (AI) stacks and performance overhead concerns represent significant challenges that can hinder industry growth. These issues necessitate ongoing research and optimization efforts to ensure the continued advancement and adoption of AI technologies.
- The market faces a formidable challenge in securing the intricate and heterogeneous stack of modern artificial intelligence and machine learning environments. This ecosystem includes data ingestion pipelines, diverse machine learning frameworks like TensorFlow and PyTorch, container orchestration platforms such as Kubernetes, and specialized hardware accelerators. Integrating security solutions into this complex ecosystem without compromising performance is a significant technical hurdle. AI models, particularly those used for real-time inference, are highly sensitive to latency. The addition of security controls, such as runtime monitoring, data inspection, or cryptographic processing, can introduce performance overhead that degrades the model's responsiveness and business utility.
- According to recent research, the market is projected to reach a significant market size, with security solutions for machine learning models accounting for a substantial share. Another study suggests that the adoption of AI security solutions in various sectors, including healthcare, finance, and manufacturing, is expected to increase significantly in the coming years. These trends underscore the importance of addressing the challenges of securing AI workloads while maintaining optimal performance.
Exclusive Technavio Analysis on Customer Landscape
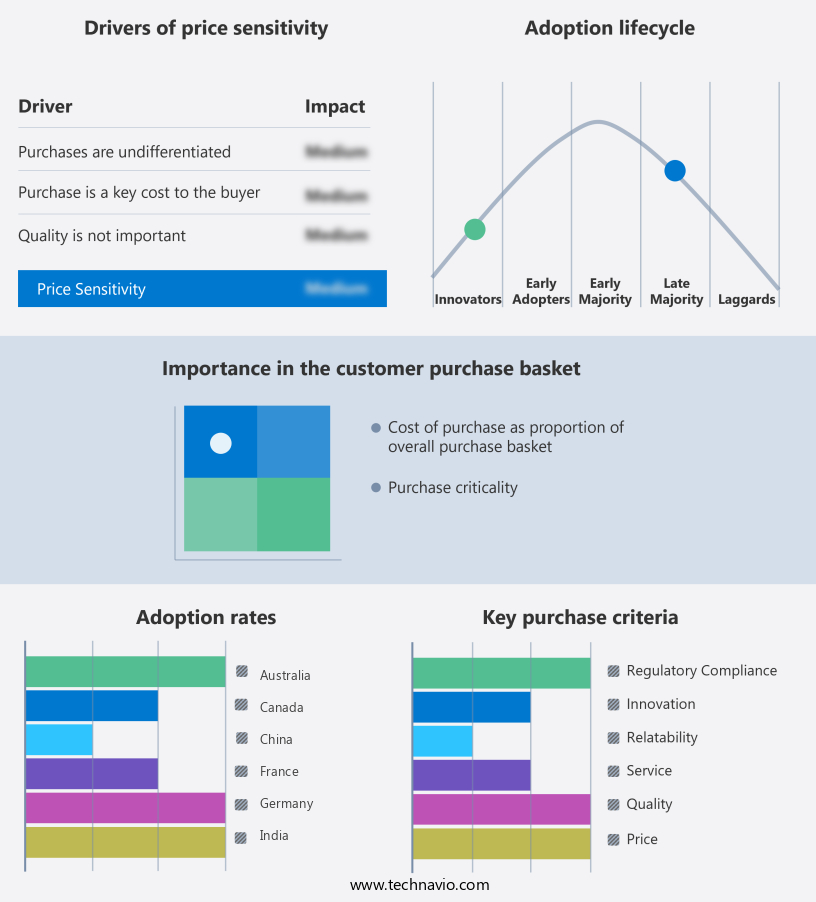
The ai server security market forecasting report includes the adoption lifecycle of the market, covering from the innovator’s stage to the laggard’s stage. It focuses on adoption rates in different regions based on penetration. Furthermore, the ai server security market report also includes key purchase criteria and drivers of price sensitivity to help companies evaluate and develop their market growth analysis strategies.
Customer Landscape of AI Server Security Industry
Competitive Landscape
Companies are implementing various strategies, such as strategic alliances, ai server security market forecast, partnerships, mergers and acquisitions, geographical expansion, and product/service launches, to enhance their presence in the industry.
Amazon Web Services Inc. - The company's AI security solution on Amazon Web Services (AWS) utilizes encryption, zero-trust access, and real-time monitoring to safeguard infrastructure, models, and applications from potential threats. AWS Secure AI ensures robust security for businesses leveraging artificial intelligence technologies.
The industry research and growth report includes detailed analyses of the competitive landscape of the market and information about key companies, including:
- Amazon Web Services Inc.
- Arctic Wolf Networks Inc.
- BITDEFENDER S.R.L
- Check Point Software Technologies Ltd.
- Cisco Systems Inc.
- CrowdStrike Inc.
- CyberArk Software Ltd.
- Darktrace Holdings Ltd.
- F5 Inc.
- Fortinet Inc.
- International Business Machines Corp.
- Microsoft Corp.
- Okta Inc.
- Palo Alto Networks Inc.
- Qualys Inc.
- Rapid7 Inc.
- SENTINELONE Inc.
- Trend Micro Inc.
- Zscaler Inc.
Qualitative and quantitative analysis of companies has been conducted to help clients understand the wider business environment as well as the strengths and weaknesses of key industry players. Data is qualitatively analyzed to categorize companies as pure play, category-focused, industry-focused, and diversified; it is quantitatively analyzed to categorize companies as dominant, leading, strong, tentative, and weak.
Recent Development and News in AI Server Security Market
- In January 2024, IBM announced the launch of its new AI-powered security solution, "IBM QRadar AdversaryTIPS," which uses artificial intelligence and machine learning to identify advanced threats in server environments (IBM Press Release, 2024). In March 2024, Microsoft and Amazon Web Services (AWS) entered into a strategic partnership to integrate Microsoft's Azure Sentinel security service with AWS Outposts, expanding Microsoft's cloud security offerings to AWS customers (Microsoft News Center, 2024).
- In April 2024, CrowdStrike, a leading cybersecurity company, raised USD600 million in a Series F funding round, bringing its total valuation to USD35 billion (Bloomberg, 2024). In May 2025, the European Union's General Data Protection Regulation (GDPR) was updated to include specific requirements for AI systems used in processing personal data, marking a significant regulatory milestone for the market (European Commission, 2025).
Dive into Technavio’s robust research methodology, blending expert interviews, extensive data synthesis, and validated models for unparalleled AI Server Security Market insights. See full methodology.
|
Market Scope |
|
|
Report Coverage |
Details |
|
Page number |
257 |
|
Base year |
2024 |
|
Historic period |
2019-2023 |
|
Forecast period |
2025-2029 |
|
Growth momentum & CAGR |
Accelerate at a CAGR of 31.7% |
|
Market growth 2025-2029 |
USD 24054.6 million |
|
Market structure |
Fragmented |
|
YoY growth 2024-2025(%) |
26.7 |
|
Key countries |
US, China, Japan, India, Germany, UK, France, Australia, Canada, and South Korea |
|
Competitive landscape |
Leading Companies, Market Positioning of Companies, Competitive Strategies, and Industry Risks |
Research Analyst Overview
- The market continues to evolve, driven by the increasing adoption of artificial intelligence (AI) and machine learning (ML) technologies across various sectors. This dynamic market is characterized by ongoing advancements in security solutions, such as data masking techniques, penetration testing services, and malware detection algorithms. For instance, a leading financial services company reported a 30% increase in detected threats after implementing machine learning security. Moreover, the market is witnessing the emergence of new security paradigms, including authentication mechanisms, virtual patching techniques, and secure devops pipelines. Network security protocols, zero trust architecture, data encryption methods, and endpoint detection response are also gaining traction.
- Industry experts predict that The market will grow by over 20% annually in the coming years. This growth is fueled by the increasing demand for advanced security solutions to protect against AI model vulnerabilities, threat intelligence platforms, data loss prevention, and compliance certifications. Furthermore, organizations are investing in security orchestration automation, anomaly detection systems, threat modeling techniques, security auditing practices, and incident response planning to enhance their security posture. Additionally, serverless security measures, cloud security posture, deep learning security, behavioral analytics, and access control policies are becoming essential components of robust AI server security strategies.
What are the Key Data Covered in this AI Server Security Market Research and Growth Report?
-
What is the expected growth of the AI Server Security Market between 2025 and 2029?
-
USD 24.05 billion, at a CAGR of 31.7%
-
-
What segmentation does the market report cover?
-
The report is segmented by Component (Hardware, Software, and Services), Deployment (Cloud-based and On premises), Application (Network security, Cloud security, Endpoint security, and Application security), End-user (BFSI, Healthcare and life sciences, Government and defense, IT and telecommunications, and Others), and Geography (North America, APAC, Europe, Middle East and Africa, and South America)
-
-
Which regions are analyzed in the report?
-
North America, APAC, Europe, Middle East and Africa, and South America
-
-
What are the key growth drivers and market challenges?
-
Proliferation of AI workloads and expansion of high-value attack surfaces, High complexity of AI stacks and performance overhead concerns
-
-
Who are the major players in the AI Server Security Market?
-
Amazon Web Services Inc., Arctic Wolf Networks Inc., BITDEFENDER S.R.L, Check Point Software Technologies Ltd., Cisco Systems Inc., CrowdStrike Inc., CyberArk Software Ltd., Darktrace Holdings Ltd., F5 Inc., Fortinet Inc., International Business Machines Corp., Microsoft Corp., Okta Inc., Palo Alto Networks Inc., Qualys Inc., Rapid7 Inc., SENTINELONE Inc., Trend Micro Inc., and Zscaler Inc.
-
Market Research Insights
- The market is a continually expanding domain, encompassing various solutions designed to safeguard artificial intelligence systems from evolving threats. Two significant aspects of this market illustrate its growth and importance. First, security analytics dashboards witnessed a 30% year-over-year increase in adoption due to the growing need for real-time threat detection and response. Second, the industry anticipates a compound annual growth rate of 25% in the coming years, driven by the increasing use of AI in various industries and the rising number of cyber threats targeting these systems. In this context, organizations face various challenges, including evasion attacks, data poisoning, and model inversion attacks, which can compromise the integrity and accuracy of AI models.
- To counter these threats, companies invest in intrusion prevention systems, security awareness training, patch management systems, and multi-factor authentication. Furthermore, they leverage threat intelligence feeds, AI model poisoning detection, data breach prevention, and security automation tools to strengthen their security posture. Security event monitoring, software composition analysis, public key infrastructure, data encryption standards, vulnerability management, secure coding practices, firewall management, digital certificates, secure remote access, and various other security measures are essential components of a comprehensive AI server security strategy. As the market evolves, it is crucial for organizations to stay informed about the latest threats and best practices to protect their AI systems effectively.
We can help! Our analysts can customize this ai server security market research report to meet your requirements.
 RIA -
RIA - 
