
Software Composition Analysis Market Size 2024-2028
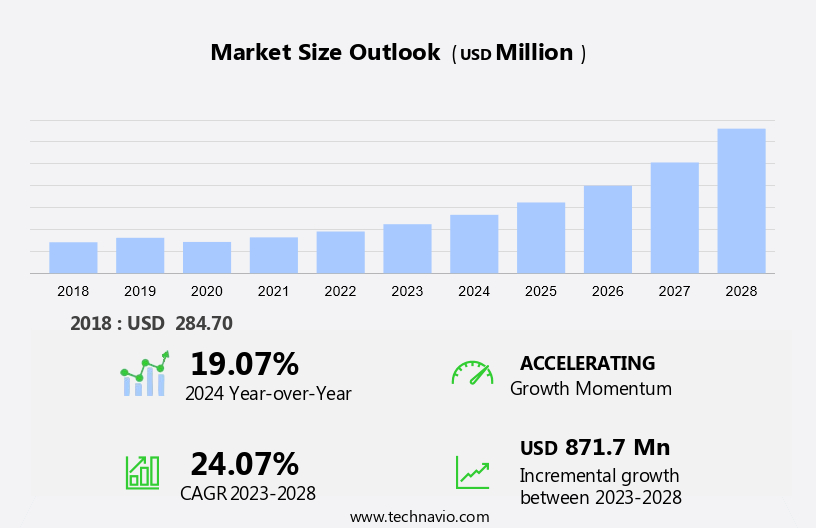
The software composition analysis market size is forecast to increase by USD 871.7 million at a CAGR of 24.07% between 2023 and 2028.
- The market is experiencing significant growth due to several key factors. Firstly, the increasing adoption of open source software (OSS) in enterprise applications has led to a greater need for SCA solutions to identify and manage the associated risks. Secondly, improved security and compliance standards, such as the European Union's General Data Protection Regulation (GDPR) and the Secure Configuration in Open Source Software (SC-OSS) project, have heightened the importance of SCA in ensuring the security and integrity of software components. Lastly, data security and cybersecurity concerns continue to be a major driver for SCA adoption, as organizations seek to mitigate risks associated with vulnerabilities in third-party libraries and dependencies.
What will be the Size of the Market During the Forecast Period?
- The market is witnessing significant growth due to the increasing adoption of open-source software, IoT, and cloud-based services. SCA solutions help organizations identify and manage vulnerabilities in their software components, including those from the National Vulnerability Database, Universal Payments Interface, and others. SCA tools analyze source code, manifest files, binary files, container images, and Bill of Materials (BOMs) to identify known vulnerabilities in third-party libraries and dependencies. CSPs, such as Prisma Cloud, Flexera, WhiteSource, Diffend, and others, offer SCA solutions to help organizations secure their software supply chain. President Biden's recent executive order on improving the nation's cybersecurity focuses the importance of securing software supply chains.
- SCA solutions can help organizations comply with this order by providing real-time visibility into their software components and vulnerabilities. SCA tools are essential for DevOps and DevSecOps teams, as they enable continuous integration and delivery while ensuring security. In the cloud-based software era, SCA solutions have become indispensable for securing software compositions in cloud environments. SCA solutions can be integrated with package managers and manifest files to provide real-time vulnerability scanning and remediation.
How is this market segmented and which is the largest segment?
The market research report provides comprehensive data (region-wise segment analysis), with forecasts and estimates in "USD million" for the period 2024-2028, as well as historical data from 2018-2022 for the following segments.
- Component
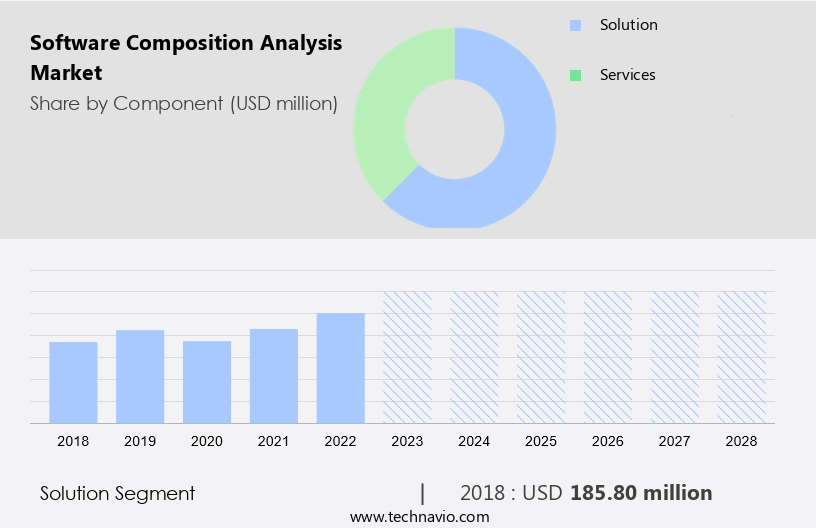
- Solution
- Services
- Geography
- North America
- US
- Europe
- Germany
- UK
- APAC
- China
- Japan
- Middle East and Africa
- South America
- North America
By Component Insights
- The solution segment is estimated to witness significant growth during the forecast period.
Software Composition Analysis (SCA) is a critical aspect of modern software development, particularly in the context of Open-source software, IoT, and Cloud-based services. SCA solutions help identify and manage risks associated with the use of third-party components, such as those found in the National Vulnerability Database, Universal Payments Interface, and Reserve Bank. SCA tools like Black Duck KnowledgeBase, Prisma Cloud, Flexera, WhiteSource, Diffend, and others, enable CSPs to ensure licensing compliance, improve code quality, and secure their DevOps and DevSecOps pipelines. These tools analyze manifest files, source code, binary files, and container images to identify vulnerabilities and generate alerts and reports.
Get a glance at the market report of share of various segments Request Free Sample
The solution segment was valued at USD 185.80 million in 2018 and showed a gradual increase during the forecast period.
Regional Analysis
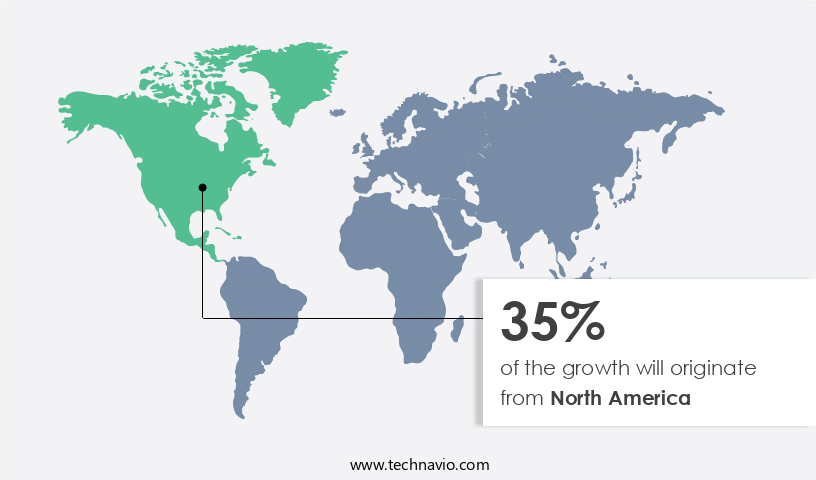
- North America is estimated to contribute 35% to the growth of the global market during the forecast period.
Technavio's analysts have elaborately explained the regional trends and drivers that shape the market during the forecast period.
For more insights on the market share of various regions Request Free Sample
Software Composition Analysis (SCA) is a critical security practice that identifies and addresses vulnerabilities in open-source components used in applications. With the increasing adoption of IoT, cloud-based services, and Universal Payments Interface, the usage of open-source software has grown significantly. The National Vulnerability Database and financial institutions like the Reserve Bank have focused the importance of SCA for licensing compliance and code quality. Black Duck KnowledgeBase, Prisma Cloud, Flexera, WhiteSource, Diffend, and other leading providers offer SCA solutions. These tools help scan and analyze manifest files, source code, binary files, and container images for known vulnerabilities. They also provide alerting and reporting, policy administration, and licensing management.
President Biden's recent executive order on improving the nation's cybersecurity also highlights the importance of SCA. Key players in the market include Veracode, Invicti Security, Apona Security, Palo Alto Networks, and Synopsys. These companies provide cloud-based software composition analysis solutions that enable risk management, vulnerability detection, and continuous monitoring. By leveraging SCA, organizations can ensure the security and compliance of their software components, enhancing their DevOps and DevSecOps practices.
Market Dynamics
Our researchers analyzed the data with 2023 as the base year, along with the key drivers, trends, and challenges. A holistic analysis of drivers will help companies refine their marketing strategies to gain a competitive advantage.
What are the key market drivers leading to the rise in the adoption of the Software Composition Analysis Market?
The rise in the adoption of software composition analysis is the key driver of the market.
- The market is witnessing significant growth due to the advantages offered by cloud-based solutions. Organizations, irrespective of their size, are increasingly adopting SCA in the cloud to minimize capital expenditures (CAPEX) and reduce operational costs. Small and medium enterprises (SMEs) and start-ups are particularly drawn to cloud solutions due to their scalability and ease of deployment. Large organizations, too, are turning to cloud-based SCA as it enables them to manage workload fluctuations without the need for setting up and maintaining their own data centers, which involves substantial CAPEX and operating expenses (OPEX). Cloud-based SCA also facilitates quicker implementation since it is accessible via web browsers and can be easily configured within a short timeframe.
What are the market trends shaping the Software Composition Analysis Market?
Improved security and compliance standards is the upcoming trend in the market.
- In today's business landscape, security and compliance are crucial considerations for the delivery of applications and services. The information security team in organizations, particularly in highly regulated sectors such as BFSI and telecommunications, faces challenges in ensuring security while adhering to faster release cycles and successful deployment of tools. The consequences of a security breach can be severe, potentially impacting the entire system and raising concerns for senior management. DevOps, a set of practices that combines software development and IT operations, is increasingly gaining acceptance in these sectors, despite security being a primary challenge. Previously, security and compliance concerns had hindered the adoption of DevOps tools.
- However, with the growing need for agility and efficiency in software development and deployment, organizations are investing in Security Composition Analysis (SCA) solutions to address these challenges. SMEs and large enterprises alike are recognizing the importance of having skilled employees to deploy SCA tools effectively, based on their specific Deployment Type and Organization Size.
What challenges does the Software Composition Analysis Market face during its growth?
Data security and cybersecurity concerns is a key challenge affecting the market growth.
- The significance of safeguarding organizational data has escalated due to the increasing number of cyber attacks aimed at obtaining confidential financial information. This concern is particularly pertinent in sectors such as Banking, Financial Services, and Insurance (BFSI) and healthcare. In response to this need, many organizations have adopted cloud-based software solutions, which offer cost-effectiveness and ease of use. These solutions enable swift and affordable access to software applications for users. Scalability is another advantage, making them suitable for Small and Medium Enterprises (SMEs). In a public cloud deployment type, resources are collectively utilized by various organizations or users. Cloud service providers are responsible for securing the data centers, ensuring the protection of the data and resources.
Exclusive Customer Landscape
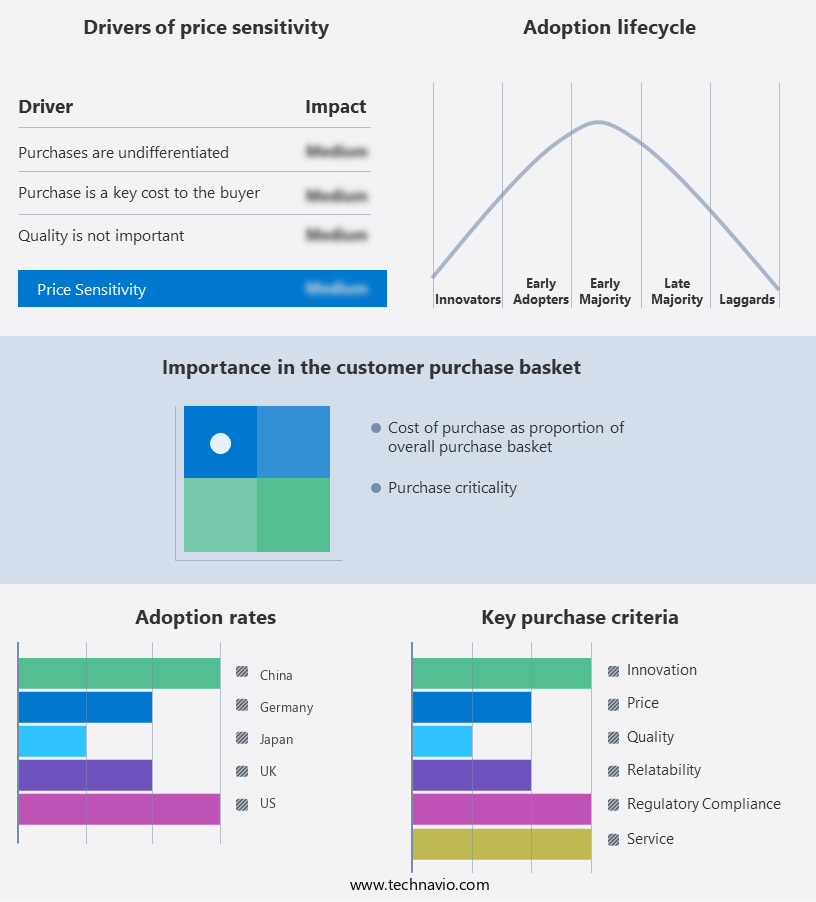
The market forecasting report includes the adoption lifecycle of the market, covering from the innovator's stage to the laggard's stage. It focuses on adoption rates in different regions based on penetration. Furthermore, the market report also includes key purchase criteria and drivers of price sensitivity to help companies evaluate and develop their market growth analysis strategies.
Customer Landscape
Key Companies & Market Insights
Companies are implementing various strategies, such as strategic alliances, market forecast, partnerships, mergers and acquisitions, geographical expansion, and product/service launches, to enhance their presence in the market.
The market research and growth report includes detailed analyses of the competitive landscape of the market and information about key companies, including:
- Broadcom Inc.
- CAST
- Checkmarx Ltd.
- Contrast Security Inc.
- Flexera Software LLC
- International Business Machines Corp.
- KPMG International Ltd.
- Open Text Corporation
- Microsoft Corp.
- NexB Inc.
- WhiteHat Security Inc.
- Oracle Corp.
- Perforce Software Inc.
- SmartBear Software Inc.
- Sonatype Inc.
- Synopsys Inc.
- Tricentis GmbH
- Veracode Inc.
- White Source Ltd.
Qualitative and quantitative analysis of companies has been conducted to help clients understand the wider business environment as well as the strengths and weaknesses of key market players. Data is qualitatively analyzed to categorize companies as pure play, category-focused, industry-focused, and diversified; it is quantitatively analyzed to categorize companies as dominant, leading, strong, tentative, and weak.
Research Analyst Overview
Software Composition Analysis (SCA) is a critical security practice that focuses on identifying and managing open-source components used in applications, ensuring licensing compliance and improving code quality. With the increasing adoption of IoT and cloud-based services, the use of open-source software in software development has surged. SCA tools help in detecting vulnerabilities in manifest files, source code, binary files, container images, and Bill of Materials (BoM). National Vulnerability Database (NVD) and President Biden's recent executive order on improving the nation's cybersecurity posture have focused the importance of SCA in securing software.
Further, CSPs like Prisma Cloud, Flexera, WhiteSource, Diffend, Invicti Security, and Apona Security provide SCA solutions to help organizations manage risk, detect vulnerabilities, and ensure licensing compliance. SCA tools use databases like Black Duck KnowledgeBase and Veracode to identify known vulnerabilities in open-source components. Log4Shell and other high-profile vulnerabilities have highlighted the need for effective SCA solutions. SCA solutions offer alerting and reporting, policy administration, and licensing management features to help organizations prioritize and remediate vulnerabilities effectively.
|
Industry Scope |
|
|
Report Coverage |
Details |
|
Page number |
139 |
|
Base year |
2023 |
|
Historic period |
2018-2022 |
|
Forecast period |
2024-2028 |
|
Growth momentum & CAGR |
Accelerate at a CAGR of 24.07% |
|
Market growth 2024-2028 |
USD 871.7 million |
|
Market structure |
Fragmented |
|
YoY growth 2023-2024(%) |
19.07 |
|
Key countries |
US, China, UK, Germany, and Japan |
|
Competitive landscape |
Leading Companies, Market Positioning of Companies, Competitive Strategies, and Industry Risks |
|
Market dynamics |
Parent market analysis, Market growth inducers and obstacles, Fast-growing and slow-growing segment analysis, Market growth and Forecasting, COVID 19 impact and recovery analysis and future consumer dynamics, Market condition analysis for forecast period |
|
Customization purview |
If our report has not included the data that you are looking for, you can reach out to our analysts and get segments customized. |
What are the Key Data Covered in this Market Research and Growth Report?
- CAGR of the market during the forecast period
- Detailed information on factors that will drive the market growth and forecasting between 2024 and 2028
- Precise estimation of the size of the market and its contribution of the market in focus to the parent market
- Accurate predictions about upcoming market growth and trends and changes in consumer behaviour
- Growth of the market across North America, Europe, APAC, Middle East and Africa, and South America
- Thorough analysis of the market's competitive landscape and detailed information about companies
- Comprehensive analysis of factors that will challenge the growth of market companies
We can help! Our analysts can customize this market research report to meet your requirements.
 RIA -
RIA - 
