AI Vision Inspection Market Analysis, Size, and Forecast 2025-2029: North America (US, Canada, and Mexico), APAC (China, Japan, and South Korea), Europe (Germany, UK, and France), Middle East and Africa (Saudi Arabia, UAE, and South Africa), South America (Brazil, Argentina, and Colombia), and Rest of World (ROW)

AI Vision Inspection Market Analysis, Size, and Forecast 2025-2029:
North America (US, Canada, and Mexico), APAC (China, Japan, and South Korea), Europe (Germany, UK, and France), Middle East and Africa (Saudi Arabia, UAE, and South Africa), South America (Brazil, Argentina, and Colombia), and Rest of World (ROW)

Published: Dec 2025 296 Pages SKU: IRTNTR81043

Market Overview at a Glance

$29.92 B
Market Opportunity
21.3%
CAGR 2024 - 2029
34.4%
North America Growth
$8.89 B
Software segment 2023

AI Vision Inspection Market Size 2025-2029

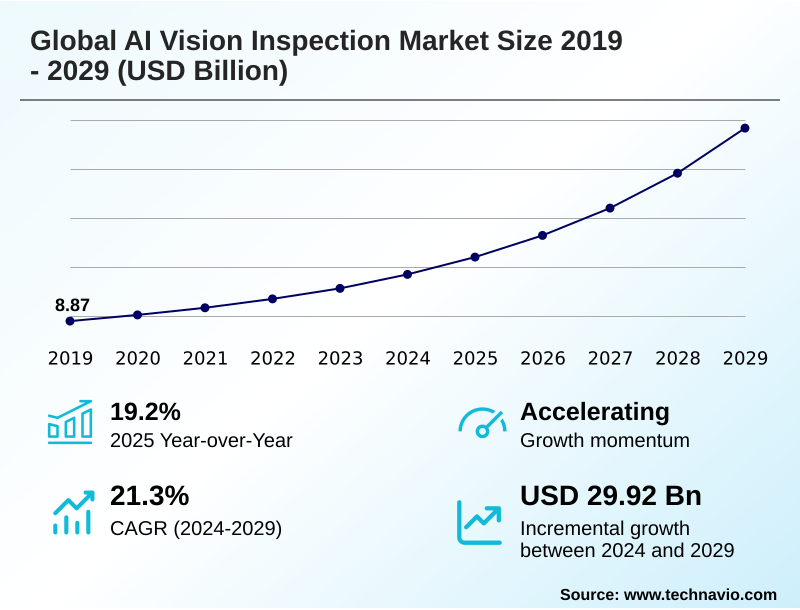
The ai vision inspection market size is valued to increase by USD 29.92 billion, at a CAGR of 21.3% from 2024 to 2029. Increasing demand for automation and enhanced quality control in manufacturing will drive the ai vision inspection market.

Major Market Trends & Insights

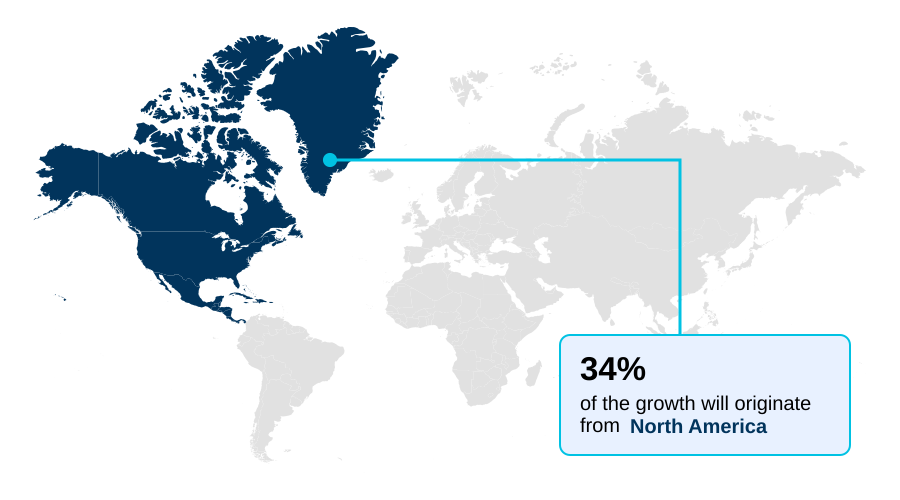
  • North America dominated the market and accounted for a 34.4% growth during the forecast period.
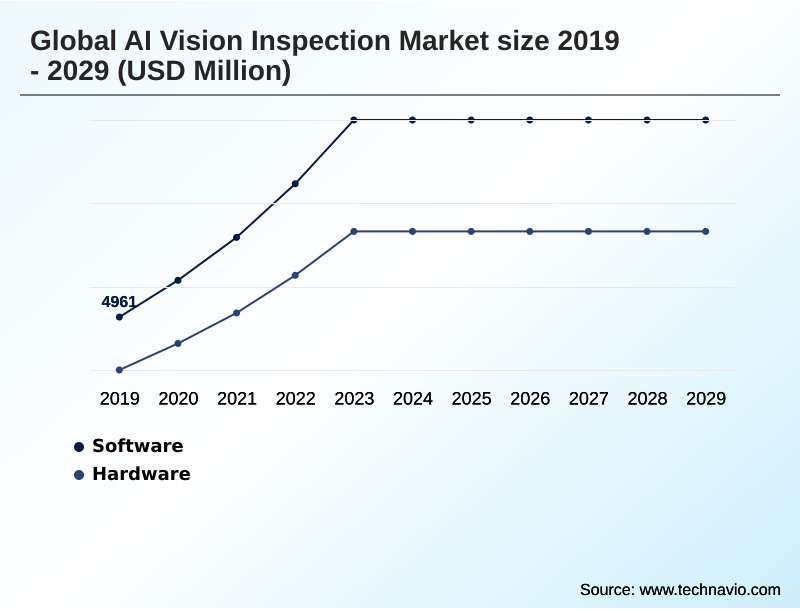
  • By Component - Software segment was valued at USD 8.89 billion in 2023
  • By Application - Training segment accounted for the largest market revenue share in 2023

Market Size & Forecast

  • Market Opportunities: USD 39.47 billion
  • Market Future Opportunities: USD 29.92 billion
  • CAGR from 2024 to 2029 : 21.3%

Market Summary

  • The AI vision inspection market is fundamentally transforming quality assurance across industries by replacing manual, error-prone processes with intelligent automation. This evolution is driven by the integration of advanced technologies like deep learning and edge AI, which enable systems to detect minute defects with exceptional speed and accuracy.
  • In high-volume sectors such as electronics manufacturing, these systems are critical for identifying microscopic flaws on printed circuit boards that could lead to product failure, thereby safeguarding brand reputation and reducing costly rework.
  • The market's momentum is further sustained by the push toward Industry 4.0, where interconnected smart factories rely on real-time data from vision systems for process optimization and predictive maintenance. However, widespread adoption is tempered by challenges, including the complexity of integrating new technologies with legacy infrastructure and the significant initial capital investment required.
  • The need for specialized talent to develop and maintain these systems, coupled with an evolving regulatory environment around data privacy, also presents considerable hurdles for organizations seeking to leverage these powerful quality control solutions.

What will be the Size of the AI Vision Inspection Market during the forecast period?

Get Key Insights on Market Forecast (PDF) Request Free Sample

How is the AI Vision Inspection Market Segmented?

The ai vision inspection industry research report provides comprehensive data (region-wise segment analysis), with forecasts and estimates in "USD million" for the period 2025-2029, as well as historical data from 2019-2023 for the following segments.

  • Component
    • Software
    • Hardware
  • Application
    • Training
    • Inference
  • End-user
    • Consumer electronics
    • Automotive
    • Manufacturing
    • Healthcare
    • Others
  • Geography
    • North America
      • US
      • Canada
      • Mexico
    • APAC
      • China
      • Japan
      • South Korea
    • Europe
      • Germany
      • UK
      • France
    • Middle East and Africa
      • Saudi Arabia
      • UAE
      • South Africa
    • South America
      • Brazil
      • Argentina
      • Colombia
    • Rest of World (ROW)

By Component Insights

The software segment is estimated to witness significant growth during the forecast period.

The software segment is central to the AI vision inspection market, driven by the need for platforms that enable automated visual inspection.

These systems leverage sophisticated machine learning algorithms and computer vision systems to perform high-speed inspection tasks, including object recognition and image segmentation.

The evolution of AI vision inspection platforms is focused on democratizing access, allowing for predictive quality analytics without extensive coding knowledge.

However, successful implementation is not without challenges, as 48% of technology leaders cite a lack of specialized AI skills as a primary barrier.

This highlights a critical need for intuitive machine vision software that can be deployed for anomaly detection and defect detection by a broader range of industrial users, often integrated with vision-guided robotics.

Request Free Sample

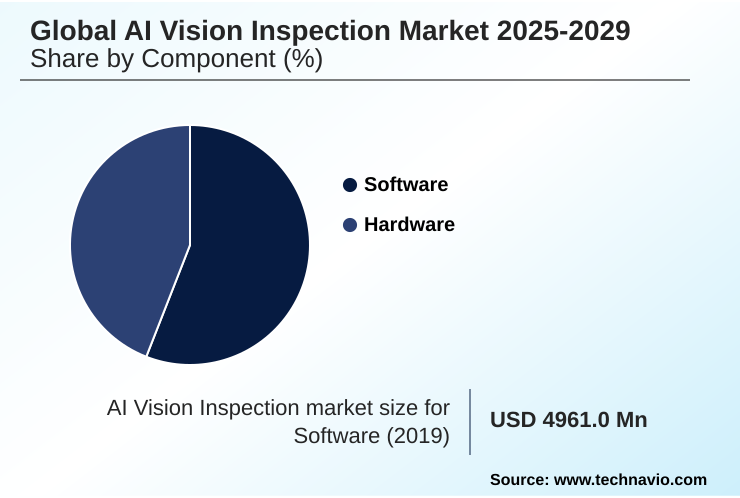
The Software segment was valued at USD 8.89 billion in 2023 and showed a gradual increase during the forecast period.

Request Free Sample

Regional Analysis

North America is estimated to contribute 34.4% to the growth of the global market during the forecast period.Technavio’s analysts have elaborately explained the regional trends and drivers that shape the market during the forecast period.

See How AI Vision Inspection Market Demand is Rising in North America Request Free Sample

The geographic landscape of the AI vision inspection market is led by North America, which is projected to account for 34.4% of the market's growth, with the US being a key contributor.

This is driven by advanced manufacturing capabilities and significant investments in industrial automation, especially in automotive manufacturing and pharmaceutical quality control.

Meanwhile, the APAC region is forecast to exhibit the fastest growth, with a CAGR of 21.6%, fueled by rapid industrialization and the adoption of smart factory initiatives.

Key applications in the region include food and beverage inspection and automated weld inspection, where smart cameras and 3D vision sensors are crucial.

In Europe, Germany's focus on Industry 4.0 makes it a major market for technologies like 3D imaging for quality control and AI in automotive quality control to inspect for subtle surface defects.

Market Dynamics

Our researchers analyzed the data with 2024 as the base year, along with the key drivers, trends, and challenges. A holistic analysis of drivers will help companies refine their marketing strategies to gain a competitive advantage.

  • Businesses evaluating the adoption of AI-powered visual inspection must consider the total cost of AI vision inspection systems against their long-term benefits. The benefits of AI in quality control are substantial, particularly in high-stakes industries. For instance, implementing real-time quality control in pharmaceuticals ensures regulatory compliance and patient safety.
  • Similarly, AI-powered defect detection in automotive manufacturing is critical for identifying subtle flaws that impact vehicle integrity. When comparing AI vision vs traditional machine vision, AI's ability to handle complex and variable defects with deep learning for surface defect detection offers a distinct advantage, often showing ROI more than double that of rule-based systems.
  • A key aspect of how to implement AI vision inspection involves addressing the challenges of integrating AI vision with legacy systems. For companies facing a lack of diverse defect data, using generative AI for synthetic defect data is an emerging best practice for training AI inspection models.
  • Furthermore, the role of AI vision in Industry 4.0 extends to applications like AI vision for robotic bin picking and predictive maintenance using visual data. Specific use cases, such as automated inspection systems for food processing and 3D vision systems for assembly verification, highlight the technology's versatility.
  • Success also hinges on ensuring data privacy in cloud-based AI vision and leveraging edge AI for real-time industrial inspection to minimize latency in critical processes like AI-based optical character recognition (OCR) and inspection in semiconductor manufacturing.

What are the key market drivers leading to the rise in the adoption of AI Vision Inspection Industry?

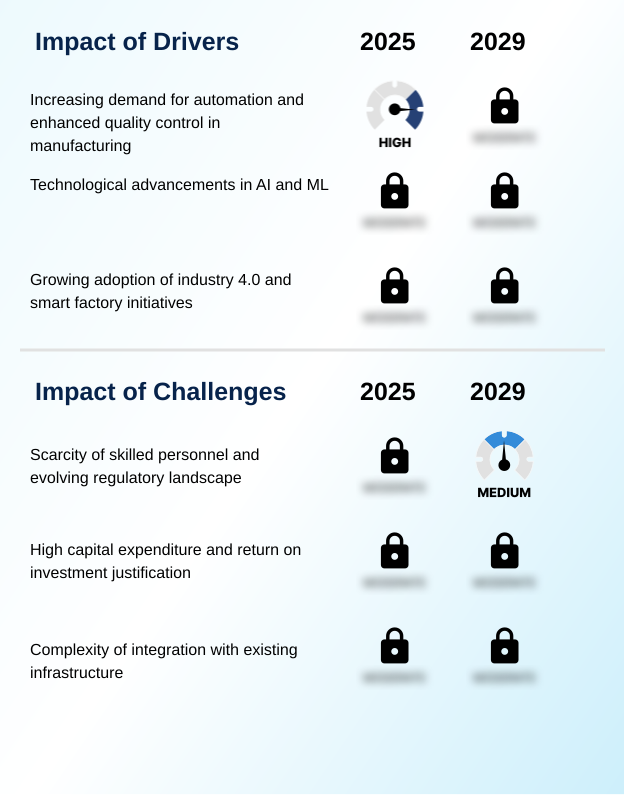
  • The increasing demand for automation and enhanced quality control within the manufacturing sector serves as a key driver for market growth.

  • The market is primarily driven by the convergence of Industry 4.0 integration and the widespread demand for industrial automation. As smart factory vision systems become standard, AI-powered analytics are enabling unprecedented levels of operational efficiency and process optimization.
  • A notable 76% of organizations are now using automation to streamline workflows, with AI vision for manufacturing at the forefront of this shift.
  • This is further evidenced in the automotive sector, where 56% of UK business leaders are integrating computer vision in industrial automation.
  • The adoption of automated quality control systems, powered by robotic process automation and Industrial IoT (IIoT) and vision systems, is no longer a competitive advantage but a necessity for quality control automation.
  • This push is fundamentally reshaping production, with AI for process optimization ensuring higher quality and throughput.

What are the market trends shaping the AI Vision Inspection Industry?

  • The market is witnessing a significant trend toward the adoption of advanced deep learning and machine learning algorithms. These technologies are instrumental in enhancing defect detection and quality control with unprecedented accuracy.

  • Key market trends are centered on advancing real-time processing capabilities through the proliferation of edge AI and hybrid cloud computing platforms. This architectural shift allows sophisticated deep learning models to perform real-time visual inspection directly on the factory floor, a critical factor for immediate decision-making.
  • The use of generative AI is also transforming the space, with generative AI in manufacturing enabling the creation of high-fidelity synthetic data. This approach of synthetic data for AI training accelerates the development of robust models without requiring physical defect examples.
  • As machine vision software evolves, the trend of edge computing for AI vision is becoming standard, with some sectors seeing a deployment increase of over 40% in edge devices. This integration of deep learning for visual inspection with cloud-based vision AI offers a scalable and secure framework for modern quality control.

What challenges does the AI Vision Inspection Industry face during its growth?

  • The scarcity of skilled personnel, compounded by an evolving regulatory landscape, presents a key challenge to the industry's growth.

  • A significant challenge facing the market is the complexity of AI vision integration challenges, particularly with legacy systems. This hurdle is compounded by stringent data privacy regulations, which govern the use of high-resolution imaging and require robust data security in AI vision architectures.
  • The financial barrier remains substantial, as justifying the ROI of AI vision inspection requires a detailed analysis of potential gains, such as a 0.1% yield improvement that can translate to millions in revenue for semiconductor inspection. Furthermore, the scarcity of expertise for AI model training for inspection persists, with nearly 95% of technology leaders reporting difficulties in finding skilled talent.
  • These issues affect specialized applications like printed circuit board (PCB) inspection and ensuring parts traceability, making the deployment of automated inspection for electronics a complex undertaking that requires careful planning around predictive maintenance and assembly verification.

Exclusive Technavio Analysis on Customer Landscape

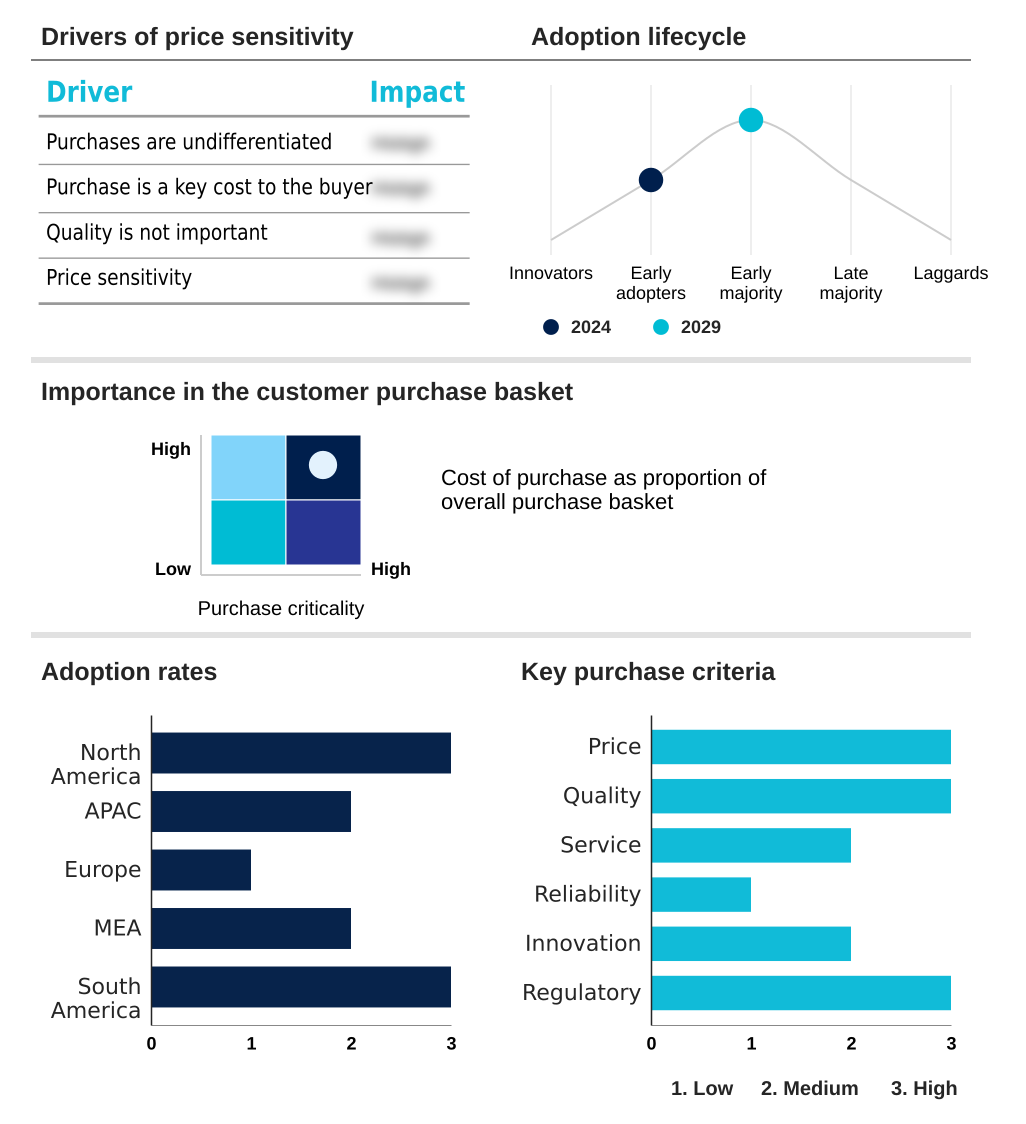
The ai vision inspection market forecasting report includes the adoption lifecycle of the market, covering from the innovator’s stage to the laggard’s stage. It focuses on adoption rates in different regions based on penetration. Furthermore, the ai vision inspection market report also includes key purchase criteria and drivers of price sensitivity to help companies evaluate and develop their market growth analysis strategies.

Customer Landscape of AI Vision Inspection Industry

Competitive Landscape

Companies are implementing various strategies, such as strategic alliances, ai vision inspection market forecast, partnerships, mergers and acquisitions, geographical expansion, and product/service launches, to enhance their presence in the industry.

AI Superior GmbH - Provides a cloud-based platform leveraging machine learning to detect visual anomalies, enhancing quality control in industrial processes through automated inspection.

The industry research and growth report includes detailed analyses of the competitive landscape of the market and information about key companies, including:

  • AI Superior GmbH
  • Amazon Web Services Inc.
  • Apera AI
  • Averroes.ai Inc.
  • Basler AG
  • Chooch Intelligence Technologies Co.
  • Cognex Corp.
  • Google LLC
  • Hailo Technologies Ltd.
  • Intel Corp.
  • IBM Corp.
  • Keyence Corp.
  • Landing AI
  • Microsoft Corp.
  • NVIDIA Corp.
  • OMRON Corp.
  • Qualcomm Inc.
  • Robovision BV
  • SenseTime Group Inc.
  • Symphony Innovation LLC

Qualitative and quantitative analysis of companies has been conducted to help clients understand the wider business environment as well as the strengths and weaknesses of key industry players. Data is qualitatively analyzed to categorize companies as pure play, category-focused, industry-focused, and diversified; it is quantitatively analyzed to categorize companies as dominant, leading, strong, tentative, and weak.

Recent Development and News in Ai vision inspection market

  • In August 2024, the European Union's Artificial Intelligence Act entered into force, establishing a harmonized, risk-based legal framework for AI with a global impact on businesses.
  • In September 2024, Basler AG launched its Pylon AI software, a solution designed to integrate advanced AI capabilities into machine vision applications for more effective image processing and analysis.
  • In January 2025, NVIDIA expanded its partnerships with major automotive players, including Toyota and Continental, to accelerate the development of next-generation highly automated vehicle fleets using advanced AI.
  • In March 2025, Cybord introduced its Real-Time Interceptor (RTI) solution, which utilizes deep learning algorithms to proactively identify and eliminate defective electronic components before integration into circuit boards.

Dive into Technavio’s robust research methodology, blending expert interviews, extensive data synthesis, and validated models for unparalleled AI Vision Inspection Market insights. See full methodology.

Market Scope
Page number 296
Base year 2024
Historic period 2019-2023
Forecast period 2025-2029
Growth momentum & CAGR Accelerate at a CAGR of 21.3%
Market growth 2025-2029 USD 29919.9 million
Market structure Fragmented
YoY growth 2024-2025(%) 19.2%
Key countries US, Canada, Mexico, China, Japan, South Korea, India, Australia, Indonesia, Germany, UK, France, Italy, Spain, The Netherlands, Saudi Arabia, UAE, South Africa, Israel, Turkey, Brazil, Argentina and Colombia
Competitive landscape Leading Companies, Market Positioning of Companies, Competitive Strategies, and Industry Risks

Request Free Sample

Research Analyst Overview

  • The AI vision inspection market is defined by the deployment of automated visual inspection for quality control automation, moving beyond human capabilities in speed and accuracy. Central to this are deep learning models and sophisticated machine learning algorithms that power computer vision systems for tasks like defect detection and anomaly detection.
  • The technological landscape includes 3D vision sensors and high-resolution imaging for detailed surface inspection, as well as smart cameras enabling real-time processing at the edge. A key boardroom consideration is the adoption of edge AI, which directly impacts data privacy regulations by keeping sensitive operational data on-premises, a critical factor for compliance.
  • Applications are expanding into semiconductor inspection, automotive manufacturing, and pharmaceutical quality control, where AI-powered analytics facilitate predictive maintenance and process optimization. The impact is significant, with AI-powered analysis in some sectors reducing diagnosis and inspection times by up to 30%.
  • This drive for operational efficiency is fostering innovation in machine vision software, printed circuit board (PCB) inspection, and parts traceability within the broader Industry 4.0 integration.

What are the Key Data Covered in this AI Vision Inspection Market Research and Growth Report?

  • What is the expected growth of the AI Vision Inspection Market between 2025 and 2029?

    • USD 29.92 billion, at a CAGR of 21.3%

  • What segmentation does the market report cover?

    • The report is segmented by Component (Software, Hardware), Application (Training, Inference), End-user (Consumer electronics, Automotive, Manufacturing, Healthcare, Others) and Geography (North America, APAC, Europe, Middle East and Africa, South America)

  • Which regions are analyzed in the report?

    • North America, APAC, Europe, Middle East and Africa and South America

  • What are the key growth drivers and market challenges?

    • Increasing demand for automation and enhanced quality control in manufacturing, Scarcity of skilled personnel and evolving regulatory landscape

  • Who are the major players in the AI Vision Inspection Market?

    • AI Superior GmbH, Amazon Web Services Inc., Apera AI, Averroes.ai Inc., Basler AG, Chooch Intelligence Technologies Co., Cognex Corp., Google LLC, Hailo Technologies Ltd., Intel Corp., IBM Corp., Keyence Corp., Landing AI, Microsoft Corp., NVIDIA Corp., OMRON Corp., Qualcomm Inc., Robovision BV, SenseTime Group Inc. and Symphony Innovation LLC

Market Research Insights

  • The market dynamics for AI vision inspection are shifting from standalone quality checks to integrated process optimization, driven by machine learning for defect detection. This transition is delivering measurable business outcomes, with some implementations reducing manufacturing defects by over 20% and associated downtime by 15%.
  • As AI for anomaly detection becomes more sophisticated, its role in industrial automation expands, enabling high-speed inspection systems that enhance throughput. The adoption of AI vision inspection platforms is also influenced by ROI considerations, where the value of predictive quality analytics in preventing large-scale recalls outweighs the initial investment.
  • This focus on tangible benefits is accelerating the deployment of vision-guided robotics and other automated solutions across the factory floor, making computer vision a cornerstone of modern manufacturing efficiency.

We can help! Our analysts can customize this ai vision inspection market research report to meet your requirements.

Get in touch

1. Executive Summary

1.1 Market overview

Executive Summary - Chart on Market Overview
Executive Summary - Data Table on Market Overview
Executive Summary - Chart on Global Market Characteristics
Executive Summary - Chart on Market by Geography
Executive Summary - Chart on Market Segmentation by Component
Executive Summary - Chart on Market Segmentation by Application
Executive Summary - Chart on Market Segmentation by End-user
Executive Summary - Chart on Incremental Growth
Executive Summary - Data Table on Incremental Growth
Executive Summary - Chart on Company Market Positioning

2. Technavio Analysis

2.1 Analysis of price sensitivity, lifecycle, customer purchase basket, adoption rates, and purchase criteria

2.2 Criticality of inputs and Factors of differentiation

Chart on Overview on criticality of inputs and factors of differentiation

2.3 Factors of disruption

Chart on Overview on factors of disruption

2.4 Impact of drivers and challenges

Chart on Impact of drivers and challenges in 2024 and 2029

3. Market Landscape

3.1 Market ecosystem

Chart on Parent Market
Data Table on - Parent Market

3.2 Market characteristics

Chart on Market characteristics analysis

3.3 Value chain analysis

Chart on Value chain analysis

4. Market Sizing

4.1 Market definition

Data Table on Offerings of companies included in the market definition

4.2 Market segment analysis

Market segments

4.3 Market size 2024

4.4 Market outlook: Forecast for 2024-2029

Chart on Global - Market size and forecast 2024-2029 ($ million)
Data Table on Global - Market size and forecast 2024-2029 ($ million)
Chart on Global Market: Year-over-year growth 2024-2029 (%)
Data Table on Global Market: Year-over-year growth 2024-2029 (%)

5. Historic Market Size

5.1 Global AI Vision Inspection Market 2019 - 2023

Historic Market Size - Data Table on Global AI Vision Inspection Market 2019 - 2023 ($ million)

5.2 Component segment analysis 2019 - 2023

Historic Market Size - Component Segment 2019 - 2023 ($ million)

5.3 Application segment analysis 2019 - 2023

Historic Market Size - Application Segment 2019 - 2023 ($ million)

5.4 End-user segment analysis 2019 - 2023

Historic Market Size - End-user Segment 2019 - 2023 ($ million)

5.5 Geography segment analysis 2019 - 2023

Historic Market Size - Geography Segment 2019 - 2023 ($ million)

5.6 Country segment analysis 2019 - 2023

Historic Market Size - Country Segment 2019 - 2023 ($ million)

6. Five Forces Analysis

6.1 Five forces summary

Five forces analysis - Comparison between 2024 and 2029

6.2 Bargaining power of buyers

Bargaining power of buyers - Impact of key factors 2024 and 2029

6.3 Bargaining power of suppliers

Bargaining power of suppliers - Impact of key factors in 2024 and 2029

6.4 Threat of new entrants

Threat of new entrants - Impact of key factors in 2024 and 2029

6.5 Threat of substitutes

Threat of substitutes - Impact of key factors in 2024 and 2029

6.6 Threat of rivalry

Threat of rivalry - Impact of key factors in 2024 and 2029

6.7 Market condition

Chart on Market condition - Five forces 2024 and 2029

7. Market Segmentation by Component

7.1 Market segments

Chart on Component - Market share 2024-2029 (%)
Data Table on Component - Market share 2024-2029 (%)

7.2 Comparison by Component

Chart on Comparison by Component
Data Table on Comparison by Component

7.3 Software - Market size and forecast 2024-2029

Chart on Software - Market size and forecast 2024-2029 ($ million)
Data Table on Software - Market size and forecast 2024-2029 ($ million)
Chart on Software - Year-over-year growth 2024-2029 (%)
Data Table on Software - Year-over-year growth 2024-2029 (%)

7.4 Hardware - Market size and forecast 2024-2029

Chart on Hardware - Market size and forecast 2024-2029 ($ million)
Data Table on Hardware - Market size and forecast 2024-2029 ($ million)
Chart on Hardware - Year-over-year growth 2024-2029 (%)
Data Table on Hardware - Year-over-year growth 2024-2029 (%)

7.5 Market opportunity by Component

Market opportunity by Component ($ million)
Data Table on Market opportunity by Component ($ million)

8. Market Segmentation by Application

8.1 Market segments

Chart on Application - Market share 2024-2029 (%)
Data Table on Application - Market share 2024-2029 (%)

8.2 Comparison by Application

Chart on Comparison by Application
Data Table on Comparison by Application

8.3 Training - Market size and forecast 2024-2029

Chart on Training - Market size and forecast 2024-2029 ($ million)
Data Table on Training - Market size and forecast 2024-2029 ($ million)
Chart on Training - Year-over-year growth 2024-2029 (%)
Data Table on Training - Year-over-year growth 2024-2029 (%)

8.4 Inference - Market size and forecast 2024-2029

Chart on Inference - Market size and forecast 2024-2029 ($ million)
Data Table on Inference - Market size and forecast 2024-2029 ($ million)
Chart on Inference - Year-over-year growth 2024-2029 (%)
Data Table on Inference - Year-over-year growth 2024-2029 (%)

8.5 Market opportunity by Application

Market opportunity by Application ($ million)
Data Table on Market opportunity by Application ($ million)

9. Market Segmentation by End-user

9.1 Market segments

Chart on End-user - Market share 2024-2029 (%)
Data Table on End-user - Market share 2024-2029 (%)

9.2 Comparison by End-user

Chart on Comparison by End-user
Data Table on Comparison by End-user

9.3 Consumer electronics - Market size and forecast 2024-2029

Chart on Consumer electronics - Market size and forecast 2024-2029 ($ million)
Data Table on Consumer electronics - Market size and forecast 2024-2029 ($ million)
Chart on Consumer electronics - Year-over-year growth 2024-2029 (%)
Data Table on Consumer electronics - Year-over-year growth 2024-2029 (%)

9.4 Automotive - Market size and forecast 2024-2029

Chart on Automotive - Market size and forecast 2024-2029 ($ million)
Data Table on Automotive - Market size and forecast 2024-2029 ($ million)
Chart on Automotive - Year-over-year growth 2024-2029 (%)
Data Table on Automotive - Year-over-year growth 2024-2029 (%)

9.5 Manufacturing - Market size and forecast 2024-2029

Chart on Manufacturing - Market size and forecast 2024-2029 ($ million)
Data Table on Manufacturing - Market size and forecast 2024-2029 ($ million)
Chart on Manufacturing - Year-over-year growth 2024-2029 (%)
Data Table on Manufacturing - Year-over-year growth 2024-2029 (%)

9.6 Healthcare - Market size and forecast 2024-2029

Chart on Healthcare - Market size and forecast 2024-2029 ($ million)
Data Table on Healthcare - Market size and forecast 2024-2029 ($ million)
Chart on Healthcare - Year-over-year growth 2024-2029 (%)
Data Table on Healthcare - Year-over-year growth 2024-2029 (%)

9.7 Others - Market size and forecast 2024-2029

Chart on Others - Market size and forecast 2024-2029 ($ million)
Data Table on Others - Market size and forecast 2024-2029 ($ million)
Chart on Others - Year-over-year growth 2024-2029 (%)
Data Table on Others - Year-over-year growth 2024-2029 (%)

9.8 Market opportunity by End-user

Market opportunity by End-user ($ million)
Data Table on Market opportunity by End-user ($ million)

10. Customer Landscape

10.1 Customer landscape overview

Analysis of price sensitivity, lifecycle, customer purchase basket, adoption rates, and purchase criteria

11. Geographic Landscape

11.1 Geographic segmentation

Chart on Market share by geography 2024-2029 (%)
Data Table on Market share by geography 2024-2029 (%)

11.2 Geographic comparison

Chart on Geographic comparison
Data Table on Geographic comparison

11.3 North America - Market size and forecast 2024-2029

Chart on North America - Market size and forecast 2024-2029 ($ million)
Data Table on North America - Market size and forecast 2024-2029 ($ million)
Chart on North America - Year-over-year growth 2024-2029 (%)
Data Table on North America - Year-over-year growth 2024-2029 (%)
Chart on Regional Comparison - North America
Data Table on Regional Comparison - North America

11.3.1 US - Market size and forecast 2024-2029

Chart on US - Market size and forecast 2024-2029 ($ million)
Data Table on US - Market size and forecast 2024-2029 ($ million)
Chart on US - Year-over-year growth 2024-2029 (%)
Data Table on US - Year-over-year growth 2024-2029 (%)

11.3.2 Canada - Market size and forecast 2024-2029

Chart on Canada - Market size and forecast 2024-2029 ($ million)
Data Table on Canada - Market size and forecast 2024-2029 ($ million)
Chart on Canada - Year-over-year growth 2024-2029 (%)
Data Table on Canada - Year-over-year growth 2024-2029 (%)

11.3.3 Mexico - Market size and forecast 2024-2029

Chart on Mexico - Market size and forecast 2024-2029 ($ million)
Data Table on Mexico - Market size and forecast 2024-2029 ($ million)
Chart on Mexico - Year-over-year growth 2024-2029 (%)
Data Table on Mexico - Year-over-year growth 2024-2029 (%)

11.4 APAC - Market size and forecast 2024-2029

Chart on APAC - Market size and forecast 2024-2029 ($ million)
Data Table on APAC - Market size and forecast 2024-2029 ($ million)
Chart on APAC - Year-over-year growth 2024-2029 (%)
Data Table on APAC - Year-over-year growth 2024-2029 (%)
Chart on Regional Comparison - APAC
Data Table on Regional Comparison - APAC

11.4.1 China - Market size and forecast 2024-2029

Chart on China - Market size and forecast 2024-2029 ($ million)
Data Table on China - Market size and forecast 2024-2029 ($ million)
Chart on China - Year-over-year growth 2024-2029 (%)
Data Table on China - Year-over-year growth 2024-2029 (%)

11.4.2 Japan - Market size and forecast 2024-2029

Chart on Japan - Market size and forecast 2024-2029 ($ million)
Data Table on Japan - Market size and forecast 2024-2029 ($ million)
Chart on Japan - Year-over-year growth 2024-2029 (%)
Data Table on Japan - Year-over-year growth 2024-2029 (%)

11.4.3 South Korea - Market size and forecast 2024-2029

Chart on South Korea - Market size and forecast 2024-2029 ($ million)
Data Table on South Korea - Market size and forecast 2024-2029 ($ million)
Chart on South Korea - Year-over-year growth 2024-2029 (%)
Data Table on South Korea - Year-over-year growth 2024-2029 (%)

11.4.4 India - Market size and forecast 2024-2029

Chart on India - Market size and forecast 2024-2029 ($ million)
Data Table on India - Market size and forecast 2024-2029 ($ million)
Chart on India - Year-over-year growth 2024-2029 (%)
Data Table on India - Year-over-year growth 2024-2029 (%)

11.4.5 Australia - Market size and forecast 2024-2029

Chart on Australia - Market size and forecast 2024-2029 ($ million)
Data Table on Australia - Market size and forecast 2024-2029 ($ million)
Chart on Australia - Year-over-year growth 2024-2029 (%)
Data Table on Australia - Year-over-year growth 2024-2029 (%)

11.4.6 Indonesia - Market size and forecast 2024-2029

Chart on Indonesia - Market size and forecast 2024-2029 ($ million)
Data Table on Indonesia - Market size and forecast 2024-2029 ($ million)
Chart on Indonesia - Year-over-year growth 2024-2029 (%)
Data Table on Indonesia - Year-over-year growth 2024-2029 (%)

11.5 Europe - Market size and forecast 2024-2029

Chart on Europe - Market size and forecast 2024-2029 ($ million)
Data Table on Europe - Market size and forecast 2024-2029 ($ million)
Chart on Europe - Year-over-year growth 2024-2029 (%)
Data Table on Europe - Year-over-year growth 2024-2029 (%)
Chart on Regional Comparison - Europe
Data Table on Regional Comparison - Europe

11.5.1 Germany - Market size and forecast 2024-2029

Chart on Germany - Market size and forecast 2024-2029 ($ million)
Data Table on Germany - Market size and forecast 2024-2029 ($ million)
Chart on Germany - Year-over-year growth 2024-2029 (%)
Data Table on Germany - Year-over-year growth 2024-2029 (%)

11.5.2 UK - Market size and forecast 2024-2029

Chart on UK - Market size and forecast 2024-2029 ($ million)
Data Table on UK - Market size and forecast 2024-2029 ($ million)
Chart on UK - Year-over-year growth 2024-2029 (%)
Data Table on UK - Year-over-year growth 2024-2029 (%)

11.5.3 France - Market size and forecast 2024-2029

Chart on France - Market size and forecast 2024-2029 ($ million)
Data Table on France - Market size and forecast 2024-2029 ($ million)
Chart on France - Year-over-year growth 2024-2029 (%)
Data Table on France - Year-over-year growth 2024-2029 (%)

11.5.4 Italy - Market size and forecast 2024-2029

Chart on Italy - Market size and forecast 2024-2029 ($ million)
Data Table on Italy - Market size and forecast 2024-2029 ($ million)
Chart on Italy - Year-over-year growth 2024-2029 (%)
Data Table on Italy - Year-over-year growth 2024-2029 (%)

11.5.5 Spain - Market size and forecast 2024-2029

Chart on Spain - Market size and forecast 2024-2029 ($ million)
Data Table on Spain - Market size and forecast 2024-2029 ($ million)
Chart on Spain - Year-over-year growth 2024-2029 (%)
Data Table on Spain - Year-over-year growth 2024-2029 (%)

11.5.6 The Netherlands - Market size and forecast 2024-2029

Chart on The Netherlands - Market size and forecast 2024-2029 ($ million)
Data Table on The Netherlands - Market size and forecast 2024-2029 ($ million)
Chart on The Netherlands - Year-over-year growth 2024-2029 (%)
Data Table on The Netherlands - Year-over-year growth 2024-2029 (%)

11.6 Middle East and Africa - Market size and forecast 2024-2029

Chart on Middle East and Africa - Market size and forecast 2024-2029 ($ million)
Data Table on Middle East and Africa - Market size and forecast 2024-2029 ($ million)
Chart on Middle East and Africa - Year-over-year growth 2024-2029 (%)
Data Table on Middle East and Africa - Year-over-year growth 2024-2029 (%)
Chart on Regional Comparison - Middle East and Africa
Data Table on Regional Comparison - Middle East and Africa

11.6.1 Saudi Arabia - Market size and forecast 2024-2029

Chart on Saudi Arabia - Market size and forecast 2024-2029 ($ million)
Data Table on Saudi Arabia - Market size and forecast 2024-2029 ($ million)
Chart on Saudi Arabia - Year-over-year growth 2024-2029 (%)
Data Table on Saudi Arabia - Year-over-year growth 2024-2029 (%)

11.6.2 UAE - Market size and forecast 2024-2029

Chart on UAE - Market size and forecast 2024-2029 ($ million)
Data Table on UAE - Market size and forecast 2024-2029 ($ million)
Chart on UAE - Year-over-year growth 2024-2029 (%)
Data Table on UAE - Year-over-year growth 2024-2029 (%)

11.6.3 South Africa - Market size and forecast 2024-2029

Chart on South Africa - Market size and forecast 2024-2029 ($ million)
Data Table on South Africa - Market size and forecast 2024-2029 ($ million)
Chart on South Africa - Year-over-year growth 2024-2029 (%)
Data Table on South Africa - Year-over-year growth 2024-2029 (%)

11.6.4 Israel - Market size and forecast 2024-2029

Chart on Israel - Market size and forecast 2024-2029 ($ million)
Data Table on Israel - Market size and forecast 2024-2029 ($ million)
Chart on Israel - Year-over-year growth 2024-2029 (%)
Data Table on Israel - Year-over-year growth 2024-2029 (%)

11.6.5 Turkey - Market size and forecast 2024-2029

Chart on Turkey - Market size and forecast 2024-2029 ($ million)
Data Table on Turkey - Market size and forecast 2024-2029 ($ million)
Chart on Turkey - Year-over-year growth 2024-2029 (%)
Data Table on Turkey - Year-over-year growth 2024-2029 (%)

11.7 South America - Market size and forecast 2024-2029

Chart on South America - Market size and forecast 2024-2029 ($ million)
Data Table on South America - Market size and forecast 2024-2029 ($ million)
Chart on South America - Year-over-year growth 2024-2029 (%)
Data Table on South America - Year-over-year growth 2024-2029 (%)
Chart on Regional Comparison - South America
Data Table on Regional Comparison - South America

11.7.1 Brazil - Market size and forecast 2024-2029

Chart on Brazil - Market size and forecast 2024-2029 ($ million)
Data Table on Brazil - Market size and forecast 2024-2029 ($ million)
Chart on Brazil - Year-over-year growth 2024-2029 (%)
Data Table on Brazil - Year-over-year growth 2024-2029 (%)

11.7.2 Argentina - Market size and forecast 2024-2029

Chart on Argentina - Market size and forecast 2024-2029 ($ million)
Data Table on Argentina - Market size and forecast 2024-2029 ($ million)
Chart on Argentina - Year-over-year growth 2024-2029 (%)
Data Table on Argentina - Year-over-year growth 2024-2029 (%)

11.7.3 Colombia - Market size and forecast 2024-2029

Chart on Colombia - Market size and forecast 2024-2029 ($ million)
Data Table on Colombia - Market size and forecast 2024-2029 ($ million)
Chart on Colombia - Year-over-year growth 2024-2029 (%)
Data Table on Colombia - Year-over-year growth 2024-2029 (%)

11.8 Market opportunity by geography

Market opportunity by geography ($ million)
Data Tables on Market opportunity by geography ($ million)

12. Drivers, Challenges, and Opportunity

12.1 Market drivers

Increasing demand for automation and enhanced quality control in manufacturing
Technological advancements in AI and ML
Growing adoption of industry 4.0 and smart factory initiatives

12.2 Market challenges

Scarcity of skilled personnel and evolving regulatory landscape
High capital expenditure and return on investment justification
Complexity of integration with existing infrastructure

12.3 Impact of drivers and challenges

Impact of drivers and challenges in 2024 and 2029

12.4 Market opportunities

Advanced deep learning and ML for enhanced defect detection and quality control
Proliferation of edge AI and hybrid cloud-edge architectures for real-time processing
Expansion of AI vision inspection within industry 4.0 and smart manufacturing

13. Competitive Landscape

13.1 Overview

13.2

Overview on criticality of inputs and factors of differentiation

13.3 Landscape disruption

Overview on factors of disruption

13.4 Industry risks

Impact of key risks on business

14. Competitive Analysis

14.1 Companies profiled

Companies covered

14.2 Company ranking index

14.3 Market positioning of companies

Matrix on companies position and classification

14.4 AI Superior GmbH

AI Superior GmbH - Overview
AI Superior GmbH - Product / Service
AI Superior GmbH - Key offerings
SWOT

14.5 Amazon Web Services Inc.

Amazon Web Services Inc. - Overview
Amazon Web Services Inc. - Product / Service
Amazon Web Services Inc. - Key news
Amazon Web Services Inc. - Key offerings
SWOT

14.6 Averroes.ai Inc.

Averroes.ai Inc. - Overview
Averroes.ai Inc. - Product / Service
Averroes.ai Inc. - Key offerings
SWOT

14.7 Basler AG

Basler AG - Overview
Basler AG - Product / Service
Basler AG - Key offerings
SWOT

14.8 Chooch Intelligence Technologies Co.

Chooch Intelligence Technologies Co. - Overview
Chooch Intelligence Technologies Co. - Product / Service
Chooch Intelligence Technologies Co. - Key offerings
SWOT

14.9 Cognex Corp.

Cognex Corp. - Overview
Cognex Corp. - Product / Service
Cognex Corp. - Key news
Cognex Corp. - Key offerings
SWOT

14.10 Google LLC

Google LLC - Overview
Google LLC - Product / Service
Google LLC - Key offerings
SWOT

14.11 Hailo Technologies Ltd.

Hailo Technologies Ltd. - Overview
Hailo Technologies Ltd. - Product / Service
Hailo Technologies Ltd. - Key offerings
SWOT

14.12 Intel Corp.

Intel Corp. - Overview
Intel Corp. - Business segments
Intel Corp. - Key news
Intel Corp. - Key offerings
Intel Corp. - Segment focus
SWOT

14.13 IBM Corp.

IBM Corp. - Overview
IBM Corp. - Business segments
IBM Corp. - Key news
IBM Corp. - Key offerings
IBM Corp. - Segment focus
SWOT

14.14 Landing AI

Landing AI - Overview
Landing AI - Product / Service
Landing AI - Key offerings
SWOT

14.15 Microsoft Corp.

Microsoft Corp. - Overview
Microsoft Corp. - Business segments
Microsoft Corp. - Key news
Microsoft Corp. - Key offerings
Microsoft Corp. - Segment focus
SWOT

14.16 NVIDIA Corp.

NVIDIA Corp. - Overview
NVIDIA Corp. - Business segments
NVIDIA Corp. - Key news
NVIDIA Corp. - Key offerings
NVIDIA Corp. - Segment focus
SWOT

14.17 Qualcomm Inc.

Qualcomm Inc. - Overview
Qualcomm Inc. - Business segments
Qualcomm Inc. - Key news
Qualcomm Inc. - Key offerings
Qualcomm Inc. - Segment focus
SWOT

14.18 SenseTime Group Inc.

SenseTime Group Inc. - Overview
SenseTime Group Inc. - Product / Service
SenseTime Group Inc. - Key offerings
SWOT

15. Appendix

15.1 Scope of the report

Market definition
Objectives
Notes and caveats

15.2 Inclusions and exclusions checklist

Inclusions checklist
Exclusions checklist

15.3 Currency conversion rates for US$

15.4 Research methodology

15.5 Data procurement

Information sources

15.6 Data validation

15.7 Validation techniques employed for market sizing

15.8 Data synthesis

15.9 360 degree market analysis

15.10 List of abbreviations

Research Methodology

Technavio presents a detailed picture of the market by way of study, synthesis, and summation of data from multiple sources. The analysts have presented the various facets of the market with a particular focus on identifying the key industry influencers. The data thus presented is comprehensive, reliable, and the result of extensive research, both primary and secondary.

INFORMATION SOURCES

Primary sources

  • Manufacturers and suppliers
  • Channel partners
  • Industry experts
  • Strategic decision makers

Secondary sources

  • Industry journals and periodicals
  • Government data
  • Financial reports of key industry players
  • Historical data
  • Press releases

DATA ANALYSIS

Data Synthesis

  • Collation of data
  • Estimation of key figures
  • Analysis of derived insights

Data Validation

  • Triangulation with data models
  • Reference against proprietary databases
  • Corroboration with industry experts

REPORT WRITING

Qualitative

  • Market drivers
  • Market challenges
  • Market trends
  • Five forces analysis

Quantitative

  • Market size and forecast
  • Market segmentation
  • Geographical insights
  • Competitive landscape

Interested in this report?

Get your sample now to see our research methodology and insights!

Download Now

Frequently Asked Questions

AI Vision Inspection market growth will increase by USD 29919.9 million during 2025-2029.

The AI Vision Inspection market is expected to grow at a CAGR of 21.3% during 2025-2029.

AI Vision Inspection market is segmented by Component (Software, Hardware) Application (Training, Inference) End-user (Consumer electronics, Automotive, Manufacturing, Healthcare, Others)

AI Superior GmbH, Amazon Web Services Inc., Apera AI, Averroes.ai Inc., Basler AG, Chooch Intelligence Technologies Co., Cognex Corp., Google LLC, Hailo Technologies Ltd., Intel Corp., IBM Corp., Keyence Corp., Landing AI, Microsoft Corp., NVIDIA Corp., OMRON Corp., Qualcomm Inc., Robovision BV, SenseTime Group Inc., Symphony Innovation LLC are a few of the key vendors in the AI Vision Inspection market.

North America will register the highest growth rate of 34.4% among the other regions. Therefore, the AI Vision Inspection market in North America is expected to garner significant business opportunities for the vendors during the forecast period.

US, Canada, Mexico, China, Japan, South Korea, India, Australia, Indonesia, Germany, UK, France, Italy, Spain, The Netherlands, Saudi Arabia, UAE, South Africa, Israel, Turkey, Brazil, Argentina, Colombia

  • Increasing demand for automation and enhanced quality control in manufacturing is the driving factor this market.

The AI Vision Inspection market vendors should focus on grabbing business opportunities from the Component segment as it accounted for the largest market share in the base year.