Aiplace Platforms Market Analysis, Size, and Forecast 2026-2030: North America (US, Canada, and Mexico), APAC (China, Japan, and India), Europe (Germany, UK, and France), Middle East and Africa (Saudi Arabia, UAE, and South Africa), South America (Brazil and Argentina), and Rest of World (ROW)

Aiplace Platforms Market Analysis, Size, and Forecast 2026-2030:
North America (US, Canada, and Mexico), APAC (China, Japan, and India), Europe (Germany, UK, and France), Middle East and Africa (Saudi Arabia, UAE, and South Africa), South America (Brazil and Argentina), and Rest of World (ROW)

Published: May 2026 290 Pages SKU: IRTNTR80699

Market Overview at a Glance

$25.35 B
Market Opportunity
37.6%
CAGR 2025 - 2030
36.7%
North America Growth
$3.16 B
Tools segment 2024

Aiplace Platforms Market Size 2026-2030

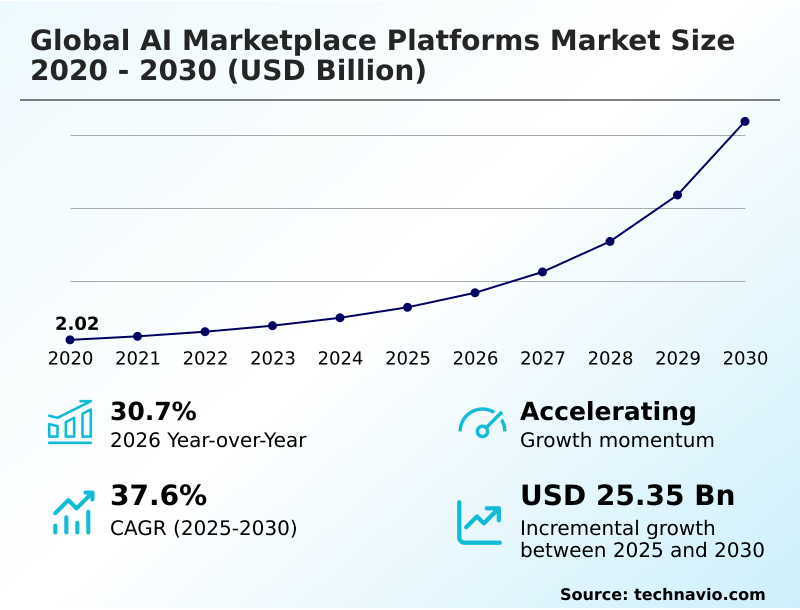
The Aiplace Platforms Market size was valued at USD 6.46 billion in 2025, growing at a CAGR of 37.6% during the forecast period 2026-2030.

Major Market Trends & Insights

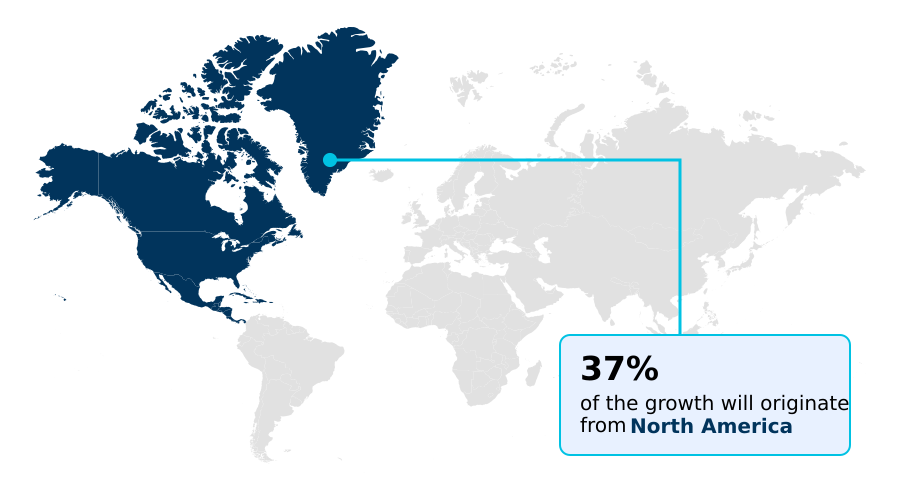
  • North America dominated the market and accounted for a 36.7% growth during the forecast period.
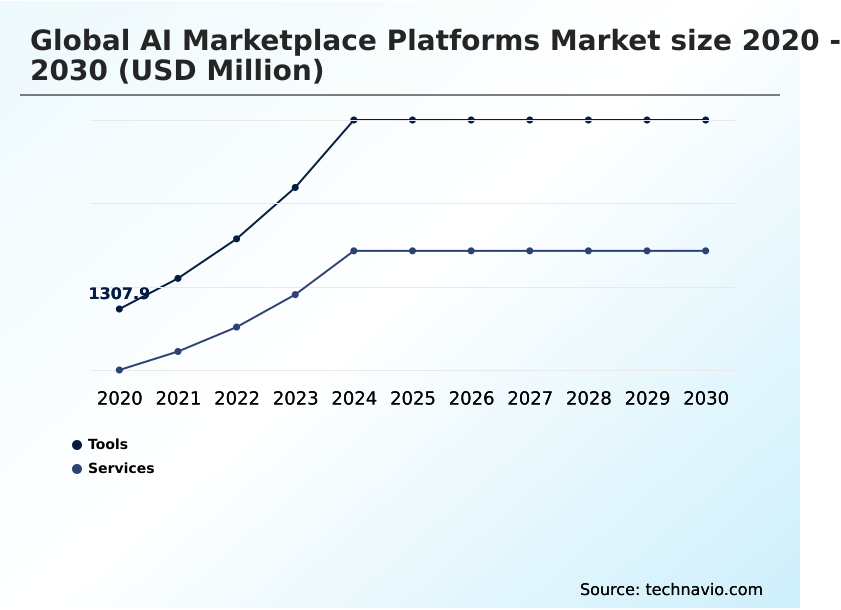
  • By Component - Tools segment was valued at USD 3.16 billion in 2024
  • By Deployment - Cloud-based segment accounted for the largest market revenue share in 2024

Market Size & Forecast

  • Historic Market Opportunities 2020-2024: USD 29.79 billion
  • Market Future Opportunities 2025-2030: USD 25.35 billion
  • CAGR from 2025 to 2030 : 37.6%

Market Summary

  • The ai marketplace platforms market is expanding as organizations adopt centralized hubs, with adoption rates in large enterprises being 30% higher than in SMEs. Businesses utilizing these platforms report a 40% reduction in model deployment times, directly accelerating innovation cycles.
  • A key driver is the democratization of AI, which provides small businesses access to advanced generative AI and MLOps tools previously available only to large corporations. For instance, a retail company can deploy a pretrained model to optimize its supply chain logistics with minimal upfront investment, improving forecast accuracy.
  • However, a significant challenge is navigating complex data security and governance requirements, which can slow down adoption. The need for robust model lifecycle management and automated auditing within these platforms is critical for ensuring compliance and building trust, especially as the use of autonomous agents becomes more widespread.

What will be the Size of the Aiplace Platforms Market during the forecast period?

Get Key Insights on Market Forecast (PDF) Request Free Sample

How is the Aiplace Platforms Market Segmented?

The aiplace platforms industry research report provides comprehensive data (region-wise segment analysis), with forecasts and analysis for the period 2026-2030, as well as historical data from 2020-2024 for the following segments.

  • Component
    • Tools
    • Services
  • Deployment
    • Cloud-based
    • On-premises
  • End-user
    • Large enterprises
    • Small and medium enterprises
  • Geography
    • North America
      • US
      • Canada
      • Mexico
    • APAC
      • China
      • Japan
      • India
    • Europe
      • Germany
      • UK
      • France
    • Middle East and Africa
      • Saudi Arabia
      • UAE
      • South Africa
    • South America
      • Brazil
      • Argentina
    • Rest of World (ROW)

How is the Aiplace Platforms Market Segmented by Component?

The tools segment is estimated to witness significant growth during the forecast period.

The global ai marketplace platforms market is segmented by component, deployment, end-user, and geography, with the Tools segment projected to grow by over 40% in the upcoming year.

This segment, encompassing pretrained models and specialized APIs, can reduce development cycles by up to 60%, directly impacting time-to-market. Offerings such as MLOps and generative AI frameworks are critical for building systems that support complex reasoning and content creation automation.

As businesses adopt hybrid ai models, the demand for robust deployment pipelines and model monitoring tools intensifies, shaping the competitive landscape for enterprise ai tools and ai business services.

This specialization is crucial for industries requiring secure inference and stringent ai governance.

Request Free Sample

The Tools segment was valued at USD 3.16 billion in 2024 and showed a gradual increase during the forecast period.

Request Free Sample

How demand for the Aiplace Platforms market is rising in the leading region?

North America is estimated to contribute 36.7% to the growth of the global market during the forecast period.Technavio’s analysts have elaborately explained the regional trends and drivers that shape the market during the forecast period.

See How Aiplace Platforms Market demand is rising in North America Request Free Sample

North America dominates the ai marketplace platforms market, accounting for 36.7% of the incremental growth, a figure 7.78% higher than Europe's share.

This lead is driven by the US, which represents over 75% of the regional market, and Canada, where a focus on ethical AI and open-source ai models is fostering innovation.

In contrast, the APAC region, growing at a CAGR of 37.7%, shows rapid adoption fueled by mobile-first economies and government-led digital initiatives in China and India.

European adoption, while robust, is more heavily shaped by data privacy compliance and the demand for sovereign ai solutions.

The operational efficiency gains from using these platforms are universal, with firms in all regions leveraging MLOps and pretrained models to reduce development cycles. Differences in regulatory environments significantly influence the choice between cloud-based deployment and on-premises deployment across geographies.

What are the key Drivers, Trends, and Challenges in the Aiplace Platforms Market?

Our researchers analyzed the data with 2025 as the base year, along with the key drivers, trends, and challenges. A holistic analysis of drivers will help companies refine their marketing strategies to gain a competitive advantage.

  • As organizations explore the benefits of using ai marketplace platforms, they find that these ecosystems reduce initial development costs by up to 50% compared to in-house builds.
  • The primary advantage lies in accessing a curated selection of pretrained models and MLOps tools, which is particularly beneficial for the ai marketplace platforms for small business, granting them capabilities previously exclusive to large enterprises.
  • When learning how to choose an ai marketplace platform, a key consideration is the robustness of its mlops integration in ai marketplaces, as this directly impacts the efficiency of model lifecycle management. For instance, platforms with strong MLOps support can automate 90% of routine monitoring tasks, freeing up data science teams for more strategic work.
  • Another critical factor is the platform's framework for enterprise ai governance solutions, which is essential for ensuring compliance and mitigating risks associated with model bias and drift. The total cost of deploying models from ai marketplaces, including inference and maintenance, must be carefully evaluated against the expected ROI.
  • Ultimately, these platforms democratize access to advanced technology, enabling a wider range of businesses to innovate and compete effectively.

What are the key market drivers leading to the rise in the adoption of Aiplace Platforms Industry?

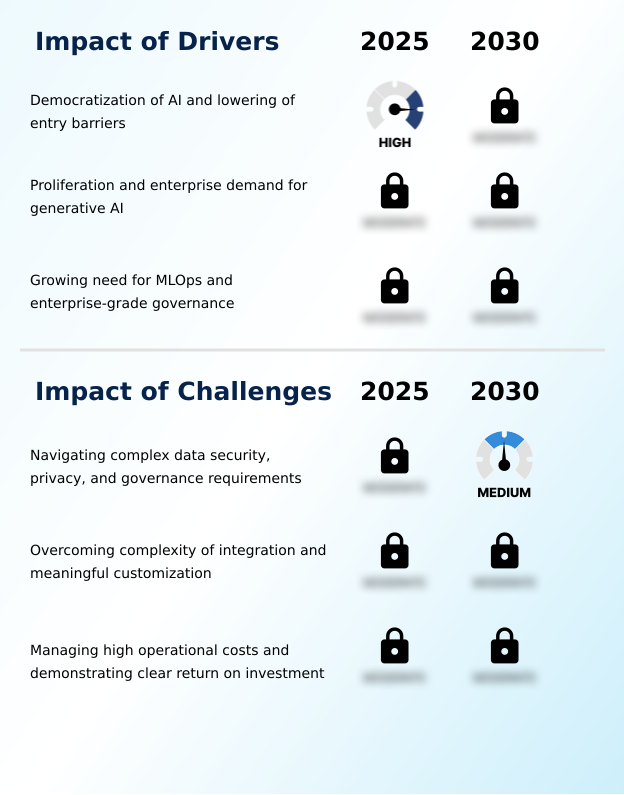
  • The democratization of AI and the lowering of entry barriers are key drivers propelling market growth, enabling wider access to advanced tools for businesses of all sizes.

  • The democratization of AI is a primary driver for the global ai marketplace platforms market 2026-2030, with low-code platforms reducing the technical barrier for entry and increasing the pool of creators by over 50%.
  • The proliferation of generative ai is also fueling enterprise demand, as businesses seek to automate content creation and complex reasoning tasks, leading to a 40% increase in queries for specialized models.
  • This demand is coupled with the growing need for MLOps and enterprise governance to manage the entire model lifecycle.
  • Marketplaces that provide robust tools for deployment pipelines, model monitoring, and automated auditing are better positioned to capture this growth, as they offer the stability required for mission-critical applications and secure inference.

What are the market trends shaping the Aiplace Platforms Industry?

  • The market is witnessing a significant trend toward vertical-specific and industry-tailored AI marketplaces. This shift reflects a maturing demand for specialized, pre-trained models that address niche challenges in sectors like healthcare and finance.

  • A prominent trend in the global ai marketplace platforms market 2026-2030 is the rise of vertical-specific ai marketplaces, with adoption in healthcare and finance growing 30% faster than in general-purpose platforms. These industry-tailored models deliver higher accuracy, improving diagnostic outcomes in healthcare by up to 15%.
  • This specialization is driven by the need for models pretrained on domain-specific data that adhere to strict regulatory standards. Another key trend is the convergence of data platforms and AI marketplaces, which simplifies workflows through direct data platform integration. This bring-the-model-to-data approach enhances security and reduces latency.
  • The hybridization of open-source ai models and proprietary ai models also offers businesses greater flexibility, allowing them to balance cost, performance, and compliance for different use cases.

What challenges does the Aiplace Platforms Industry face during its growth?

  • Navigating complex data security, privacy, and governance requirements poses a significant challenge, constraining market expansion as enterprises grapple with evolving international regulations.

  • Navigating complex data security and governance requirements remains a significant challenge for the global ai marketplace platforms market 2026-2030, with compliance efforts accounting for up to 20% of total AI project costs. The lack of standardized APIs also complicates integration, with over 35% of enterprises reporting significant technical debt from custom integration work.
  • This complexity of integration and customization hinders the ability to achieve a clear return on investment. Furthermore, managing the high operational costs of model inference and demonstrating clear ROI are critical hurdles.
  • Without robust frameworks for ai governance, bias detection, and transparent lineage tracking, businesses hesitate to deploy third-party models in production, slowing widespread adoption despite the availability of powerful foundation models and agentic ai.

Exclusive Technavio Analysis on Customer Landscape

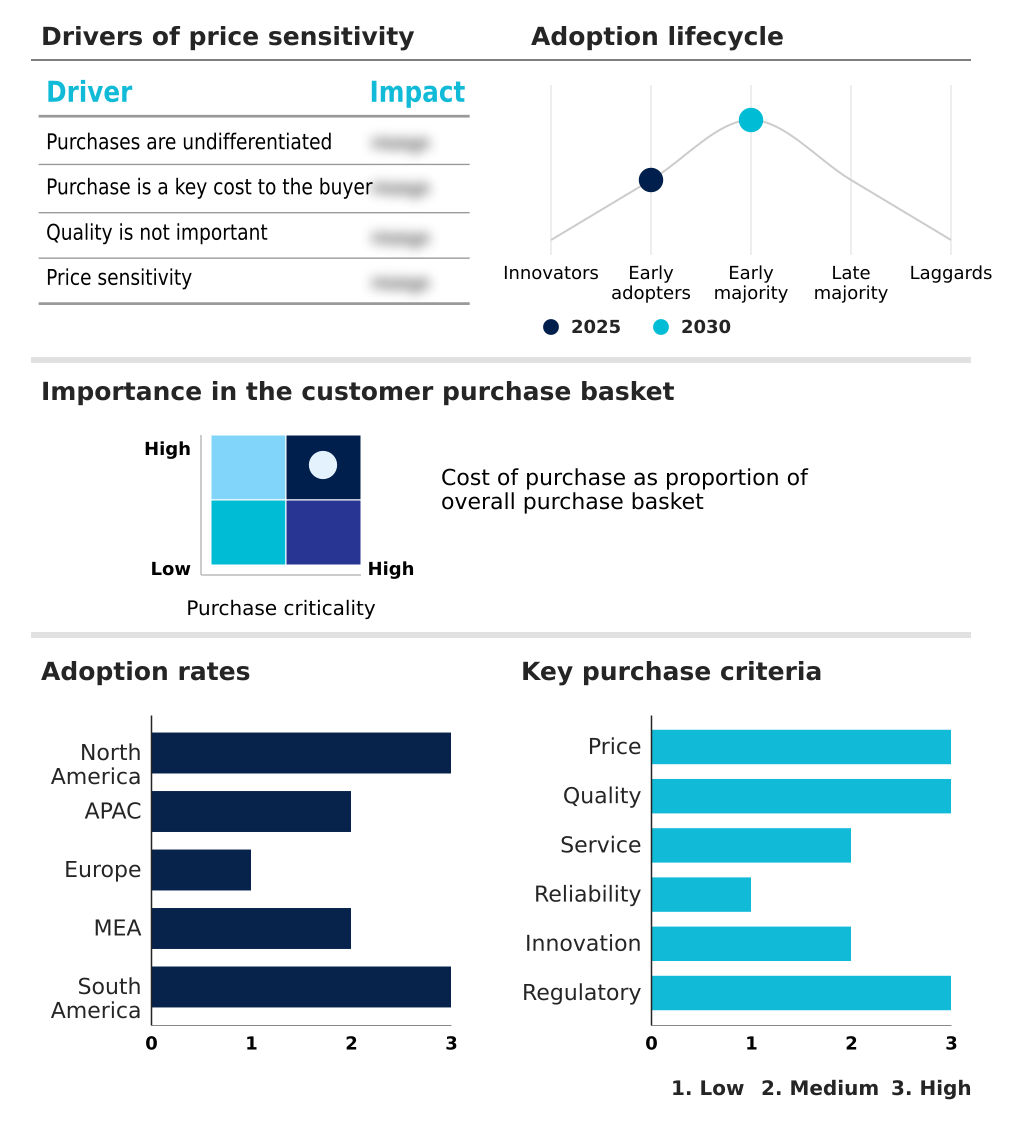
The aiplace platforms market forecasting report includes the adoption lifecycle of the market, covering from the innovator’s stage to the laggard’s stage. It focuses on adoption rates in different regions based on penetration. Furthermore, the aiplace platforms market report also includes key purchase criteria and drivers of price sensitivity to help companies evaluate and develop their market growth analysis strategies.

Customer Landscape of Aiplace Platforms Industry

Competitive Landscape

Companies are implementing various strategies, such as strategic alliances, aiplace platforms market forecast, partnerships, mergers and acquisitions, geographical expansion, and product/service launches, to enhance their presence in the industry.

Amazon Web Services Inc. - Offerings centralize the discovery, deployment, and management of AI models, enabling enterprise-grade AI solutions and accelerating development through curated machine learning assets.

The industry research and growth report includes detailed analyses of the competitive landscape of the market and information about key companies, including:

  • Amazon Web Services Inc.
  • APPEN Ltd.
  • C3.ai Inc.
  • Cloudera Inc.
  • Databricks Inc.
  • Google LLC
  • H2O.ai Inc.
  • Hugging Face Inc.
  • IBM Corp.
  • Microsoft Corp.
  • NVIDIA Corp.
  • Oracle Corp.
  • Rapid
  • Replicate Inc.
  • Salesforce Inc.
  • SAP SE
  • Seldon Technologies
  • Snowflake Inc.
  • UiPath Inc.

Qualitative and quantitative analysis of companies has been conducted to help clients understand the wider business environment as well as the strengths and weaknesses of key industry players. Data is qualitatively analyzed to categorize companies as pure play, category-focused, industry-focused, and diversified; it is quantitatively analyzed to categorize companies as dominant, leading, strong, tentative, and weak.

Market Intelligence Radar: High-Impact Developments & Growth Signals

  • In the Application Software industry, the widespread adoption of cloud-based deployment and usage-based pricing models has accelerated the accessibility of enterprise AI tools, directly influencing how businesses procure and scale AI-powered CRM and other AI business services.
  • The increasing integration of automation into business process management (BPM) software is driving demand for marketplaces offering autonomous agents and intelligent automation components, which streamline complex reasoning tasks and support enterprise governance.
  • Heightened regulatory focus on data privacy compliance, exemplified by stringent data protection laws, is compelling application software providers to embed advanced security and AI governance features, impacting the design of both proprietary AI models and open-source AI models.
  • The convergence of data platforms with application software, a trend known as bring-the-model-to-data, is reshaping product strategies, forcing marketplace vendors to offer seamless data platform integration and AI-ready data solutions to stay competitive.

Dive into Technavio’s robust research methodology, blending expert interviews, extensive data synthesis, and validated models for unparalleled Aiplace Platforms Market insights. See full methodology.

Market Scope
Page number 290
Base year 2025
Historic period 2020-2024
Forecast period 2026-2030
Growth momentum & CAGR Accelerate at a CAGR of 37.6%
Market growth 2026-2030 USD 25354.2 million
Market structure Fragmented
YoY growth 2025-2026(%) 30.7%
Key countries US, Canada, Mexico, China, Japan, India, South Korea, Australia, Indonesia, Germany, UK, France, Italy, Spain, The Netherlands, Saudi Arabia, UAE, South Africa, Israel, Turkey, Brazil, Argentina and Chile
Competitive landscape Leading Companies, Market Positioning of Companies, Competitive Strategies, and Industry Risks

Request Free Sample

Research Analyst Overview

  • The ai marketplace platforms market ecosystem functions as a multi-sided digital hub, with over 70% of transactions involving cloud-based deployment models. Core technology suppliers, including major cloud providers and specialized AI firms, offer the foundational infrastructure and pretrained models.
  • These are consumed by solution providers and enterprise end-users who leverage the platforms for rapid application development, achieving up to a 45% faster time-to-market. A critical part of the ecosystem involves regulatory bodies influencing AI governance and data privacy compliance standards. Distribution channels include direct access via vendor websites and integrated offerings within larger enterprise software suites.
  • Supporting this value chain are open-source communities contributing models, and MLOps tool providers ensuring robust model lifecycle management from deployment to monitoring and secure inference.

What are the Key Data Covered in this Aiplace Platforms Market Research and Growth Report?

  • What is the expected growth of the Aiplace Platforms Market between 2026 and 2030?

    • The Aiplace Platforms Market is expected to grow by USD 25.35 billion during 2026-2030, registering a CAGR of 37.6%. Year-over-year growth in 2026 is estimated at 30.7%%. This acceleration is shaped by democratization of ai and lowering of entry barriers, which is intensifying demand across multiple end-use verticals covered in the report.

  • What segmentation does the market report cover?

    • The report is segmented by Component (Tools, and Services), Deployment (Cloud-based, and On-premises), End-user (Large enterprises, and Small and medium enterprises) and Geography (North America, APAC, Europe, Middle East and Africa, South America). Among these, the Tools segment is estimated to witness significant growth during the forecast period, driven by rising adoption across key application areas. Each segment includes detailed qualitative and quantitative analysis, along with historical data from 2020-2024 and forecasts through 2030 with year-over-year growth rates.

  • Which regions are analyzed in the report?

    • The report covers North America, APAC, Europe, Middle East and Africa and South America. North America is estimated to contribute 36.7% to market growth during the forecast period. Country-level analysis includes US, Canada, Mexico, China, Japan, India, South Korea, Australia, Indonesia, Germany, UK, France, Italy, Spain, The Netherlands, Saudi Arabia, UAE, South Africa, Israel, Turkey, Brazil, Argentina and Chile, with dedicated market size tables and year-over-year growth for each.

  • What are the key growth drivers and market challenges?

    • The primary driver is democratization of ai and lowering of entry barriers, which is accelerating investment and industry demand. The main challenge is navigating complex data security, privacy, and governance requirements, creating operational barriers for key market participants. The report quantifies the impact of each driver and challenge across 2026 and 2030 with comparative analysis.

  • Who are the major players in the Aiplace Platforms Market?

    • Key vendors include Amazon Web Services Inc., APPEN Ltd., C3.ai Inc., Cloudera Inc., Databricks Inc., Google LLC, H2O.ai Inc., Hugging Face Inc., IBM Corp., Microsoft Corp., NVIDIA Corp., Oracle Corp., Rapid, Replicate Inc., Salesforce Inc., SAP SE, Seldon Technologies, Snowflake Inc. and UiPath Inc.. The report provides qualitative and quantitative analysis categorizing companies as dominant, leading, strong, tentative, and weak based on their market positioning. Company profiles include business segment analysis, SWOT assessment, key offerings, and recent strategic developments.

Market Research Insights

  • The competitive landscape is intensely active, with over 15 major vendors vying for market share. Leading cloud providers like Amazon Web Services and Microsoft are expanding their offerings, with Microsoft recently integrating more advanced generative AI capabilities into its Azure AI Studio, a move that addresses enterprise demand for sophisticated content creation tools.
  • These developments reflect a market driven by the need for enterprise-grade MLOps and governance, as companies report a 25% increase in AI project deployments when using managed platforms. This push for scalable solutions is a direct response to the proliferation of models and the operational complexities they introduce.
  • However, vendors must still contend with the significant challenge of simplifying integration with legacy systems, a hurdle that often determines the success of enterprise-wide AI adoption and the realization of its full potential.

We can help! Our analysts can customize this aiplace platforms market research report to meet your requirements.

Get in touch

1. Executive Summary

1.1 Market overview

Executive Summary - Chart on Market Overview
Executive Summary - Data Table on Market Overview
Executive Summary - Chart on Global Market Characteristics
Executive Summary - Chart on Market by Geography
Executive Summary - Chart on Market Segmentation by Component
Executive Summary - Chart on Market Segmentation by Deployment
Executive Summary - Chart on Market Segmentation by End-user
Executive Summary - Chart on Incremental Growth
Executive Summary - Data Table on Incremental Growth
Executive Summary - Chart on Company Market Positioning

2. Technavio Analysis

2.1 Analysis of price sensitivity, lifecycle, customer purchase basket, adoption rates, and purchase criteria

2.2 Criticality of inputs and Factors of differentiation

Chart on Overview on criticality of inputs and factors of differentiation

2.3 Factors of disruption

Chart on Overview on factors of disruption

2.4 Impact of drivers and challenges

Chart on Impact of drivers and challenges in 2025 and 2030

3. Market Landscape

3.1 Market ecosystem

Chart on Parent Market
Data Table on - Parent Market

3.2 Market characteristics

Chart on Market characteristics analysis

3.3 Value chain analysis

Chart on Value chain analysis

4. Market Sizing

4.1 Market definition

Data Table on Offerings of companies included in the market definition

4.2 Market segment analysis

Market segments

4.3 Market size 2025

4.4 Market outlook: Forecast for 2025-2030

Chart on Global - Market size and forecast 2025-2030 ($ million)
Data Table on Global - Market size and forecast 2025-2030 ($ million)
Chart on Global Market: Year-over-year growth 2025-2030 (%)
Data Table on Global Market: Year-over-year growth 2025-2030 (%)

5. Historic Market Size

5.1 Global AI Marketplace Platforms Market 2020 - 2024

Historic Market Size - Data Table on Global AI Marketplace Platforms Market 2020 - 2024 ($ million)

5.2 Component segment analysis 2020 - 2024

Historic Market Size - Component Segment 2020 - 2024 ($ million)

5.3 Deployment segment analysis 2020 - 2024

Historic Market Size - Deployment Segment 2020 - 2024 ($ million)

5.4 End-user segment analysis 2020 - 2024

Historic Market Size - End-user Segment 2020 - 2024 ($ million)

5.5 Geography segment analysis 2020 - 2024

Historic Market Size - Geography Segment 2020 - 2024 ($ million)

5.6 Country segment analysis 2020 - 2024

Historic Market Size - Country Segment 2020 - 2024 ($ million)

6. Qualitative Analysis

6.1 Impact of Geopolitical Conflicts on Global AI Marketplace Platforms Market

7. Five Forces Analysis

7.1 Five forces summary

Five forces analysis - Comparison between 2025 and 2030

7.2 Bargaining power of buyers

Bargaining power of buyers - Impact of key factors 2025 and 2030

7.3 Bargaining power of suppliers

Bargaining power of suppliers - Impact of key factors in 2025 and 2030

7.4 Threat of new entrants

Threat of new entrants - Impact of key factors in 2025 and 2030

7.5 Threat of substitutes

Threat of substitutes - Impact of key factors in 2025 and 2030

7.6 Threat of rivalry

Threat of rivalry - Impact of key factors in 2025 and 2030

7.7 Market condition

Chart on Market condition - Five forces 2025 and 2030

8. Market Segmentation by Component

8.1 Market segments

Chart on Component - Market share 2025-2030 (%)
Data Table on Component - Market share 2025-2030 (%)

8.2 Comparison by Component

Chart on Comparison by Component
Data Table on Comparison by Component

8.3 Tools - Market size and forecast 2025-2030

Chart on Tools - Market size and forecast 2025-2030 ($ million)
Data Table on Tools - Market size and forecast 2025-2030 ($ million)
Chart on Tools - Year-over-year growth 2025-2030 (%)
Data Table on Tools - Year-over-year growth 2025-2030 (%)

8.4 Services - Market size and forecast 2025-2030

Chart on Services - Market size and forecast 2025-2030 ($ million)
Data Table on Services - Market size and forecast 2025-2030 ($ million)
Chart on Services - Year-over-year growth 2025-2030 (%)
Data Table on Services - Year-over-year growth 2025-2030 (%)

8.5 Market opportunity by Component

Market opportunity by Component ($ million)
Data Table on Market opportunity by Component ($ million)

9. Market Segmentation by Deployment

9.1 Market segments

Chart on Deployment - Market share 2025-2030 (%)
Data Table on Deployment - Market share 2025-2030 (%)

9.2 Comparison by Deployment

Chart on Comparison by Deployment
Data Table on Comparison by Deployment

9.3 Cloud-based - Market size and forecast 2025-2030

Chart on Cloud-based - Market size and forecast 2025-2030 ($ million)
Data Table on Cloud-based - Market size and forecast 2025-2030 ($ million)
Chart on Cloud-based - Year-over-year growth 2025-2030 (%)
Data Table on Cloud-based - Year-over-year growth 2025-2030 (%)

9.4 On-premises - Market size and forecast 2025-2030

Chart on On-premises - Market size and forecast 2025-2030 ($ million)
Data Table on On-premises - Market size and forecast 2025-2030 ($ million)
Chart on On-premises - Year-over-year growth 2025-2030 (%)
Data Table on On-premises - Year-over-year growth 2025-2030 (%)

9.5 Market opportunity by Deployment

Market opportunity by Deployment ($ million)
Data Table on Market opportunity by Deployment ($ million)

10. Market Segmentation by End-user

10.1 Market segments

Chart on End-user - Market share 2025-2030 (%)
Data Table on End-user - Market share 2025-2030 (%)

10.2 Comparison by End-user

Chart on Comparison by End-user
Data Table on Comparison by End-user

10.3 Large enterprises - Market size and forecast 2025-2030

Chart on Large enterprises - Market size and forecast 2025-2030 ($ million)
Data Table on Large enterprises - Market size and forecast 2025-2030 ($ million)
Chart on Large enterprises - Year-over-year growth 2025-2030 (%)
Data Table on Large enterprises - Year-over-year growth 2025-2030 (%)

10.4 Small and medium enterprises - Market size and forecast 2025-2030

Chart on Small and medium enterprises - Market size and forecast 2025-2030 ($ million)
Data Table on Small and medium enterprises - Market size and forecast 2025-2030 ($ million)
Chart on Small and medium enterprises - Year-over-year growth 2025-2030 (%)
Data Table on Small and medium enterprises - Year-over-year growth 2025-2030 (%)

10.5 Market opportunity by End-user

Market opportunity by End-user ($ million)
Data Table on Market opportunity by End-user ($ million)

11. Customer Landscape

11.1 Customer landscape overview

Analysis of price sensitivity, lifecycle, customer purchase basket, adoption rates, and purchase criteria

12. Geographic Landscape

12.1 Geographic segmentation

Chart on Market share by geography 2025-2030 (%)
Data Table on Market share by geography 2025-2030 (%)

12.2 Geographic comparison

Chart on Geographic comparison
Data Table on Geographic comparison

12.3 North America - Market size and forecast 2025-2030

Chart on North America - Market size and forecast 2025-2030 ($ million)
Data Table on North America - Market size and forecast 2025-2030 ($ million)
Chart on North America - Year-over-year growth 2025-2030 (%)
Data Table on North America - Year-over-year growth 2025-2030 (%)
Chart on Regional Comparison - North America
Data Table on Regional Comparison - North America

12.3.1 US - Market size and forecast 2025-2030

Chart on US - Market size and forecast 2025-2030 ($ million)
Data Table on US - Market size and forecast 2025-2030 ($ million)
Chart on US - Year-over-year growth 2025-2030 (%)
Data Table on US - Year-over-year growth 2025-2030 (%)

12.3.2 Canada - Market size and forecast 2025-2030

Chart on Canada - Market size and forecast 2025-2030 ($ million)
Data Table on Canada - Market size and forecast 2025-2030 ($ million)
Chart on Canada - Year-over-year growth 2025-2030 (%)
Data Table on Canada - Year-over-year growth 2025-2030 (%)

12.3.3 Mexico - Market size and forecast 2025-2030

Chart on Mexico - Market size and forecast 2025-2030 ($ million)
Data Table on Mexico - Market size and forecast 2025-2030 ($ million)
Chart on Mexico - Year-over-year growth 2025-2030 (%)
Data Table on Mexico - Year-over-year growth 2025-2030 (%)

12.4 APAC - Market size and forecast 2025-2030

Chart on APAC - Market size and forecast 2025-2030 ($ million)
Data Table on APAC - Market size and forecast 2025-2030 ($ million)
Chart on APAC - Year-over-year growth 2025-2030 (%)
Data Table on APAC - Year-over-year growth 2025-2030 (%)
Chart on Regional Comparison - APAC
Data Table on Regional Comparison - APAC

12.4.1 China - Market size and forecast 2025-2030

Chart on China - Market size and forecast 2025-2030 ($ million)
Data Table on China - Market size and forecast 2025-2030 ($ million)
Chart on China - Year-over-year growth 2025-2030 (%)
Data Table on China - Year-over-year growth 2025-2030 (%)

12.4.2 Japan - Market size and forecast 2025-2030

Chart on Japan - Market size and forecast 2025-2030 ($ million)
Data Table on Japan - Market size and forecast 2025-2030 ($ million)
Chart on Japan - Year-over-year growth 2025-2030 (%)
Data Table on Japan - Year-over-year growth 2025-2030 (%)

12.4.3 India - Market size and forecast 2025-2030

Chart on India - Market size and forecast 2025-2030 ($ million)
Data Table on India - Market size and forecast 2025-2030 ($ million)
Chart on India - Year-over-year growth 2025-2030 (%)
Data Table on India - Year-over-year growth 2025-2030 (%)

12.4.4 South Korea - Market size and forecast 2025-2030

Chart on South Korea - Market size and forecast 2025-2030 ($ million)
Data Table on South Korea - Market size and forecast 2025-2030 ($ million)
Chart on South Korea - Year-over-year growth 2025-2030 (%)
Data Table on South Korea - Year-over-year growth 2025-2030 (%)

12.4.5 Australia - Market size and forecast 2025-2030

Chart on Australia - Market size and forecast 2025-2030 ($ million)
Data Table on Australia - Market size and forecast 2025-2030 ($ million)
Chart on Australia - Year-over-year growth 2025-2030 (%)
Data Table on Australia - Year-over-year growth 2025-2030 (%)

12.4.6 Indonesia - Market size and forecast 2025-2030

Chart on Indonesia - Market size and forecast 2025-2030 ($ million)
Data Table on Indonesia - Market size and forecast 2025-2030 ($ million)
Chart on Indonesia - Year-over-year growth 2025-2030 (%)
Data Table on Indonesia - Year-over-year growth 2025-2030 (%)

12.5 Europe - Market size and forecast 2025-2030

Chart on Europe - Market size and forecast 2025-2030 ($ million)
Data Table on Europe - Market size and forecast 2025-2030 ($ million)
Chart on Europe - Year-over-year growth 2025-2030 (%)
Data Table on Europe - Year-over-year growth 2025-2030 (%)
Chart on Regional Comparison - Europe
Data Table on Regional Comparison - Europe

12.5.1 Germany - Market size and forecast 2025-2030

Chart on Germany - Market size and forecast 2025-2030 ($ million)
Data Table on Germany - Market size and forecast 2025-2030 ($ million)
Chart on Germany - Year-over-year growth 2025-2030 (%)
Data Table on Germany - Year-over-year growth 2025-2030 (%)

12.5.2 UK - Market size and forecast 2025-2030

Chart on UK - Market size and forecast 2025-2030 ($ million)
Data Table on UK - Market size and forecast 2025-2030 ($ million)
Chart on UK - Year-over-year growth 2025-2030 (%)
Data Table on UK - Year-over-year growth 2025-2030 (%)

12.5.3 France - Market size and forecast 2025-2030

Chart on France - Market size and forecast 2025-2030 ($ million)
Data Table on France - Market size and forecast 2025-2030 ($ million)
Chart on France - Year-over-year growth 2025-2030 (%)
Data Table on France - Year-over-year growth 2025-2030 (%)

12.5.4 Italy - Market size and forecast 2025-2030

Chart on Italy - Market size and forecast 2025-2030 ($ million)
Data Table on Italy - Market size and forecast 2025-2030 ($ million)
Chart on Italy - Year-over-year growth 2025-2030 (%)
Data Table on Italy - Year-over-year growth 2025-2030 (%)

12.5.5 Spain - Market size and forecast 2025-2030

Chart on Spain - Market size and forecast 2025-2030 ($ million)
Data Table on Spain - Market size and forecast 2025-2030 ($ million)
Chart on Spain - Year-over-year growth 2025-2030 (%)
Data Table on Spain - Year-over-year growth 2025-2030 (%)

12.5.6 The Netherlands - Market size and forecast 2025-2030

Chart on The Netherlands - Market size and forecast 2025-2030 ($ million)
Data Table on The Netherlands - Market size and forecast 2025-2030 ($ million)
Chart on The Netherlands - Year-over-year growth 2025-2030 (%)
Data Table on The Netherlands - Year-over-year growth 2025-2030 (%)

12.6 Middle East and Africa - Market size and forecast 2025-2030

Chart on Middle East and Africa - Market size and forecast 2025-2030 ($ million)
Data Table on Middle East and Africa - Market size and forecast 2025-2030 ($ million)
Chart on Middle East and Africa - Year-over-year growth 2025-2030 (%)
Data Table on Middle East and Africa - Year-over-year growth 2025-2030 (%)
Chart on Regional Comparison - Middle East and Africa
Data Table on Regional Comparison - Middle East and Africa

12.6.1 Saudi Arabia - Market size and forecast 2025-2030

Chart on Saudi Arabia - Market size and forecast 2025-2030 ($ million)
Data Table on Saudi Arabia - Market size and forecast 2025-2030 ($ million)
Chart on Saudi Arabia - Year-over-year growth 2025-2030 (%)
Data Table on Saudi Arabia - Year-over-year growth 2025-2030 (%)

12.6.2 UAE - Market size and forecast 2025-2030

Chart on UAE - Market size and forecast 2025-2030 ($ million)
Data Table on UAE - Market size and forecast 2025-2030 ($ million)
Chart on UAE - Year-over-year growth 2025-2030 (%)
Data Table on UAE - Year-over-year growth 2025-2030 (%)

12.6.3 South Africa - Market size and forecast 2025-2030

Chart on South Africa - Market size and forecast 2025-2030 ($ million)
Data Table on South Africa - Market size and forecast 2025-2030 ($ million)
Chart on South Africa - Year-over-year growth 2025-2030 (%)
Data Table on South Africa - Year-over-year growth 2025-2030 (%)

12.6.4 Israel - Market size and forecast 2025-2030

Chart on Israel - Market size and forecast 2025-2030 ($ million)
Data Table on Israel - Market size and forecast 2025-2030 ($ million)
Chart on Israel - Year-over-year growth 2025-2030 (%)
Data Table on Israel - Year-over-year growth 2025-2030 (%)

12.6.5 Turkey - Market size and forecast 2025-2030

Chart on Turkey - Market size and forecast 2025-2030 ($ million)
Data Table on Turkey - Market size and forecast 2025-2030 ($ million)
Chart on Turkey - Year-over-year growth 2025-2030 (%)
Data Table on Turkey - Year-over-year growth 2025-2030 (%)

12.7 South America - Market size and forecast 2025-2030

Chart on South America - Market size and forecast 2025-2030 ($ million)
Data Table on South America - Market size and forecast 2025-2030 ($ million)
Chart on South America - Year-over-year growth 2025-2030 (%)
Data Table on South America - Year-over-year growth 2025-2030 (%)
Chart on Regional Comparison - South America
Data Table on Regional Comparison - South America

12.7.1 Brazil - Market size and forecast 2025-2030

Chart on Brazil - Market size and forecast 2025-2030 ($ million)
Data Table on Brazil - Market size and forecast 2025-2030 ($ million)
Chart on Brazil - Year-over-year growth 2025-2030 (%)
Data Table on Brazil - Year-over-year growth 2025-2030 (%)

12.7.2 Argentina - Market size and forecast 2025-2030

Chart on Argentina - Market size and forecast 2025-2030 ($ million)
Data Table on Argentina - Market size and forecast 2025-2030 ($ million)
Chart on Argentina - Year-over-year growth 2025-2030 (%)
Data Table on Argentina - Year-over-year growth 2025-2030 (%)

12.7.3 Chile - Market size and forecast 2025-2030

Chart on Chile - Market size and forecast 2025-2030 ($ million)
Data Table on Chile - Market size and forecast 2025-2030 ($ million)
Chart on Chile - Year-over-year growth 2025-2030 (%)
Data Table on Chile - Year-over-year growth 2025-2030 (%)

12.8 Market opportunity by geography

Market opportunity by geography ($ million)
Data Tables on Market opportunity by geography ($ million)

13. Drivers, Challenges, and Opportunity

13.1 Market drivers

Democratization of AI and lowering of entry barriers
Proliferation and enterprise demand for generative AI
Growing need for MLOps and enterprise-grade governance

13.2 Market challenges

Navigating complex data security, privacy, and governance requirements
Overcoming complexity of integration and meaningful customization
Managing high operational costs and demonstrating clear return on investment

13.3 Impact of drivers and challenges

Impact of drivers and challenges in 2025 and 2030

13.4 Market opportunities

Rise of vertical-specific and industry-tailored AI marketplaces
Blurring of lines between data platforms and AI marketplaces
Hybridization of open source and proprietary models

14. Competitive Landscape

14.1 Overview

14.2

Overview on criticality of inputs and factors of differentiation

14.3 Landscape disruption

Overview on factors of disruption

14.4 Industry risks

Impact of key risks on business

15. Competitive Analysis

15.1 Companies profiled

Companies covered

15.2 Company ranking index

15.3 Market positioning of companies

Matrix on companies position and classification

15.4 Amazon Web Services Inc.

Amazon Web Services Inc. - Overview
Amazon Web Services Inc. - Product / Service
Amazon Web Services Inc. - Key offerings
SWOT

15.5 C3.ai Inc.

C3.ai Inc. - Overview
C3.ai Inc. - Product / Service
C3.ai Inc. - Key news
C3.ai Inc. - Key offerings
SWOT

15.6 Cloudera Inc.

Cloudera Inc. - Overview
Cloudera Inc. - Product / Service
Cloudera Inc. - Key offerings
SWOT

15.7 Databricks Inc.

Databricks Inc. - Overview
Databricks Inc. - Product / Service
Databricks Inc. - Key offerings
SWOT

15.8 Google LLC

Google LLC - Overview
Google LLC - Product / Service
Google LLC - Key offerings
SWOT

15.9 H2O.ai Inc.

H2O.ai Inc. - Overview
H2O.ai Inc. - Product / Service
H2O.ai Inc. - Key offerings
SWOT

15.10 Hugging Face Inc.

Hugging Face Inc. - Overview
Hugging Face Inc. - Product / Service
Hugging Face Inc. - Key offerings
SWOT

15.11 IBM Corp.

IBM Corp. - Overview
IBM Corp. - Business segments
IBM Corp. - Key news
IBM Corp. - Key offerings
IBM Corp. - Segment focus
SWOT

15.12 Microsoft Corp.

Microsoft Corp. - Overview
Microsoft Corp. - Business segments
Microsoft Corp. - Key news
Microsoft Corp. - Key offerings
Microsoft Corp. - Segment focus
SWOT

15.13 NVIDIA Corp.

NVIDIA Corp. - Overview
NVIDIA Corp. - Business segments
NVIDIA Corp. - Key news
NVIDIA Corp. - Key offerings
NVIDIA Corp. - Segment focus
SWOT

15.14 Oracle Corp.

Oracle Corp. - Overview
Oracle Corp. - Business segments
Oracle Corp. - Key news
Oracle Corp. - Key offerings
Oracle Corp. - Segment focus
SWOT

15.15 Salesforce Inc.

Salesforce Inc. - Overview
Salesforce Inc. - Business segments
Salesforce Inc. - Key news
Salesforce Inc. - Key offerings
Salesforce Inc. - Segment focus
SWOT

15.16 SAP SE

SAP SE - Overview
SAP SE - Business segments
SAP SE - Key news
SAP SE - Key offerings
SAP SE - Segment focus
SWOT

15.17 Snowflake Inc.

Snowflake Inc. - Overview
Snowflake Inc. - Business segments
Snowflake Inc. - Key news
Snowflake Inc. - Key offerings
Snowflake Inc. - Segment focus
SWOT

15.18 UiPath Inc.

UiPath Inc. - Overview
UiPath Inc. - Product / Service
UiPath Inc. - Key news
UiPath Inc. - Key offerings
SWOT

16. Appendix

16.1 Scope of the report

Market definition
Objectives
Notes and caveats

16.2 Inclusions and exclusions checklist

Inclusions checklist
Exclusions checklist

16.3 Currency conversion rates for US$

16.4 Research methodology

16.5 Data procurement

Information sources

16.6 Data validation

16.7 Validation techniques employed for market sizing

16.8 Data synthesis

16.9 360 degree market analysis

16.10 List of abbreviations

Research Methodology

Technavio presents a detailed picture of the market by way of study, synthesis, and summation of data from multiple sources. The analysts have presented the various facets of the market with a particular focus on identifying the key industry influencers. The data thus presented is comprehensive, reliable, and the result of extensive research, both primary and secondary.

INFORMATION SOURCES

Primary sources

  • Manufacturers and suppliers
  • Channel partners
  • Industry experts
  • Strategic decision makers

Secondary sources

  • Industry journals and periodicals
  • Government data
  • Financial reports of key industry players
  • Historical data
  • Press releases

DATA ANALYSIS

Data Synthesis

  • Collation of data
  • Estimation of key figures
  • Analysis of derived insights

Data Validation

  • Triangulation with data models
  • Reference against proprietary databases
  • Corroboration with industry experts

REPORT WRITING

Qualitative

  • Market drivers
  • Market challenges
  • Market trends
  • Five forces analysis

Quantitative

  • Market size and forecast
  • Market segmentation
  • Geographical insights
  • Competitive landscape

Interested in this report?

Get your sample now to see our research methodology and insights!

Download Now

Frequently Asked Questions

Aiplace Platforms market growth will increase by USD 25354.2 million during 2026-2030.

The Aiplace Platforms market is expected to grow at a CAGR of 37.6% during 2026-2030.

Aiplace Platforms market is segmented by Component (Tools, Services) Deployment (Cloud-based, On-premises) End-user (Large enterprises, Small and medium enterprises)

Amazon Web Services Inc., APPEN Ltd., C3.ai Inc., Cloudera Inc., Databricks Inc., Google LLC, H2O.ai Inc., Hugging Face Inc., IBM Corp., Microsoft Corp., NVIDIA Corp., Oracle Corp., Rapid, Replicate Inc., Salesforce Inc., SAP SE, Seldon Technologies, Snowflake Inc., UiPath Inc. are a few of the key vendors in the Aiplace Platforms market.

North America will register the highest growth rate of 36.7% among the other regions. Therefore, the Aiplace Platforms market in North America is expected to garner significant business opportunities for the vendors during the forecast period.

US, Canada, Mexico, China, Japan, India, South Korea, Australia, Indonesia, Germany, UK, France, Italy, Spain, The Netherlands, Saudi Arabia, UAE, South Africa, Israel, Turkey, Brazil, Argentina, Chile

  • Democratization of AI and lowering of entry barriers is the driving factor this market.

The Aiplace Platforms market vendors should focus on grabbing business opportunities from the Component segment as it accounted for the largest market share in the base year.
RIA - Research AI Assistant
Ask RIA