Air Quality Monitor Market Analysis North America, Europe, APAC, Middle East and Africa, South America - US, China, Germany, UK, Canada, France, India, Japan, Italy, South Korea - Size and Forecast 2025-2029

Air Quality Monitor Market Analysis North America, Europe, APAC, Middle East and Africa, South America - US, China, Germany, UK, Canada, France, India, Japan, Italy, South Korea - Size and Forecast 2025-2029

Published: Mar 2025 244 Pages SKU: IRTNTR70743

Market Overview at a Glance

$2.29 B
Market Opportunity
7.1%
CAGR
6.5
YoY growth 2024-2025(%)

Air Quality Monitor Market Size 2025-2029

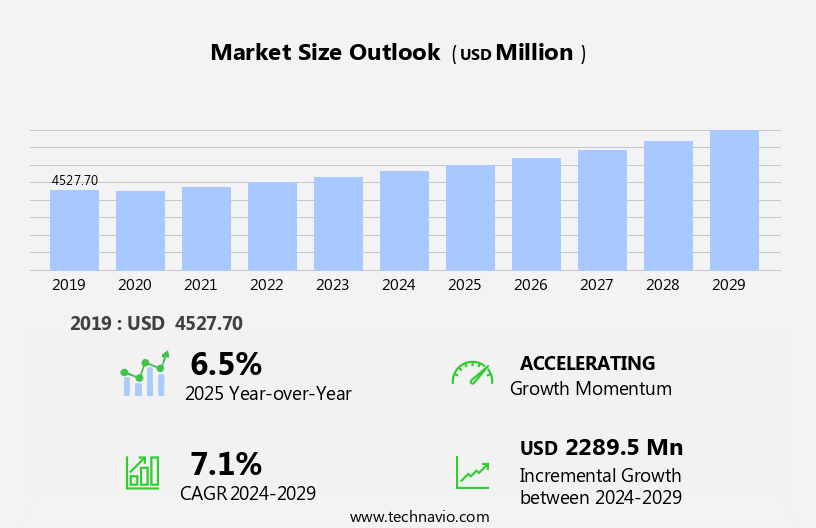
The air quality monitor market size is forecast to increase by USD 2.29 billion at a CAGR of 7.1% between 2024 and 2029.

  • The market is experiencing significant growth due to the increasing awareness and necessity of monitoring indoor air quality in both residential and commercial sectors. This trend is further fueled by the rising adoption of green buildings, which prioritize energy efficiency and occupant health. However, the high cost of deploying air quality monitoring devices remains a significant challenge for market expansion. Despite this obstacle, companies can capitalize on the growing demand for indoor air quality solutions by offering cost-effective and efficient monitoring technologies.
  • Additionally, partnerships with real estate developers and building management companies can provide lucrative opportunities for market growth. Overall, the market presents a promising landscape for companies seeking to address the growing need for indoor air quality monitoring while navigating the challenge of affordability.

What will be the Size of the Air Quality Monitor Market during the forecast period?

Air Quality Monitor Market Size

 Request Free Sample

  • The market continues to evolve, driven by growing health concerns and the need for real-time, data-driven solutions. Ambient air quality plays a significant role in public health, with health risks associated with air pollution levels. Remote monitoring through cloud-based platforms enables air quality management, allowing for proactive responses to changing conditions. Infrared sensors and machine learning algorithms are used for particle matter detection, while ultrasonic sensors measure sound levels. Energy efficiency is a key consideration, with sensor fusion and data analysis techniques improving sensor reliability and accuracy. Air filtration systems, nitrogen dioxide sensors, and mobile apps are integral components of air quality management.
  • Laser particle counters and mass spectrometry are used for industrial emissions monitoring. Multi-sensor systems and predictive analytics enable compliance reporting and data visualization. Carbon monoxide, sulfur dioxide, and volatile organic compounds are among the gases monitored. The integration of artificial intelligence and smart cities enhances air quality management, with real-time monitoring and API integration facilitating building management and pollution control. Public awareness campaigns and occupancy monitoring further optimize ventilation systems. Regulatory standards continue to evolve, driving innovation in sensor technology and data analysis techniques. Overall, the market is a dynamic and evolving landscape, with ongoing advancements in sensor technology, data analysis, and regulatory standards shaping its future.

How is this Air Quality Monitor Industry segmented?

The air quality monitor industry research report provides comprehensive data (region-wise segment analysis), with forecasts and estimates in "USD million" for the period 2025-2029, as well as historical data from 2019-2023 for the following segments.

  • Product
    • Indoor
    • Outdoor
    • Wearable
  • End-user
    • Government
    • Commercial and residential
    • Energy and pharmaceuticals
    • Others
  • Type
    • Chemical pollutants
    • Physical pollutants
    • Biological pollutants
  • Component
    • Hardware
    • Software
    • Services
  • Geography
    • North America
      • US
      • Canada
    • Europe
      • France
      • Germany
      • Italy
      • UK
    • APAC
      • China
      • India
      • Japan
      • South Korea
    • Rest of World (ROW)

    By Product Insights

    The indoor segment is estimated to witness significant growth during the forecast period.

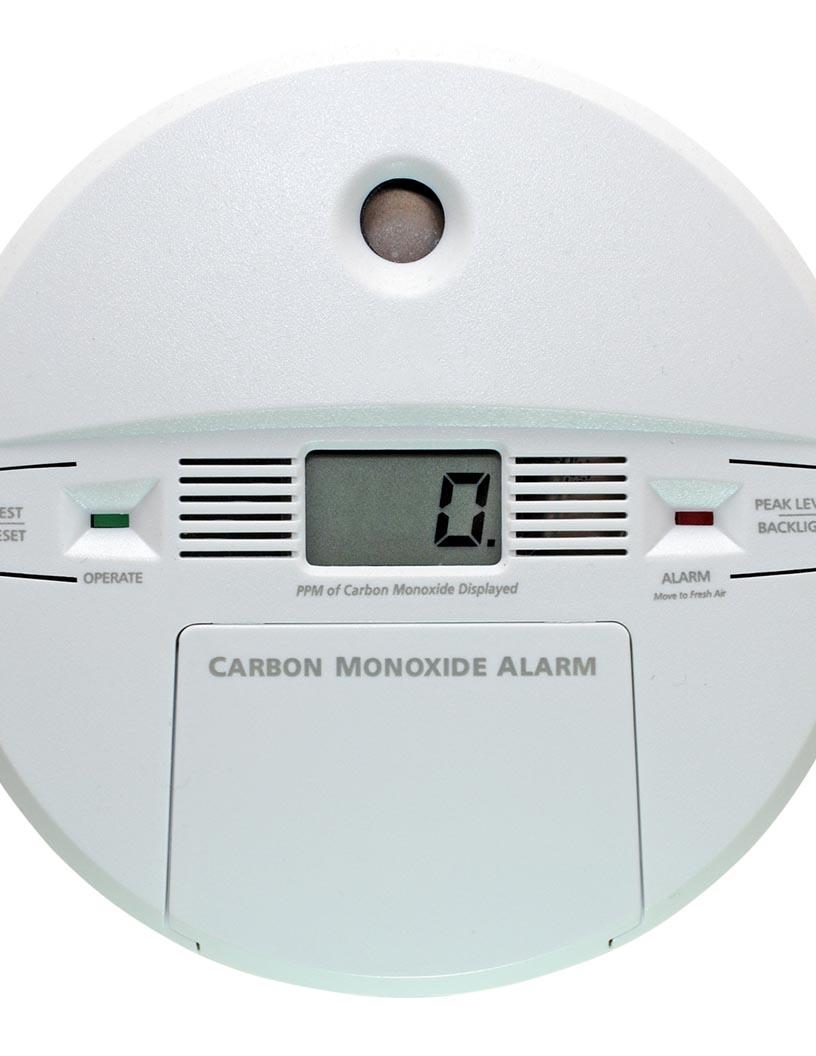
    Indoor air quality monitors are essential devices for assessing and maintaining healthy and comfortable environments within homes, offices, schools, hospitals, and other buildings. These monitors employ sensors and detectors to measure various parameters, such as temperature, humidity, carbon dioxide (CO2) levels, volatile organic compounds (VOCs), and particulate matter (PM), to evaluate indoor air quality. Real-time data and insights are provided through continuous monitoring, enabling building managers and occupants to address potential issues promptly. Advancements in technology have led to the integration of remote monitoring, cloud-based platforms, and the Internet of Things (IoT) in indoor air quality management.

    These innovations facilitate real-time data analysis, predictive analytics, and compliance reporting. Sensor fusion, machine learning, and artificial intelligence are employed to enhance sensor reliability and accuracy, ensuring precise measurements. Indoor air quality is crucial for public health, as poor indoor air quality can lead to various health risks, including respiratory issues, headaches, and fatigue. Regulatory standards mandate specific air quality index (AQI) thresholds for various pollutants, making it essential for building managers to maintain optimal indoor air quality. Indoor air quality monitors utilize various sensors, including infrared, ultrasonic, electrochemical, metal oxide, and laser particle counters, to detect a wide range of pollutants.

    Energy efficiency is a significant consideration in the design of these monitors, with many incorporating wireless connectivity and data logging for efficient data transfer and storage. Air filtration systems, ventilation systems, and air purification technologies are often integrated with indoor air quality monitors to ensure optimal air quality and maintain a healthy indoor environment. Multi-sensor systems and real-time monitoring enable early detection and mitigation of potential issues, reducing the risk of health hazards and ensuring regulatory compliance.

    Air Quality Monitor Market Size

    Request Free Sample

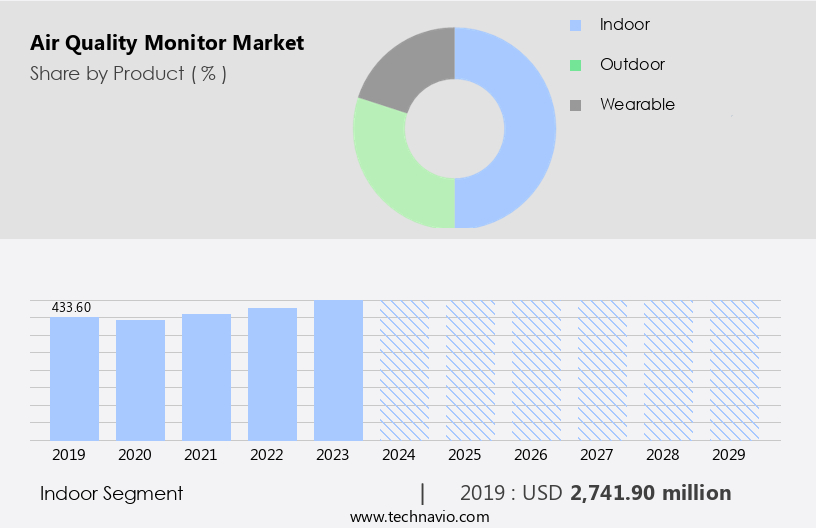
    The Indoor segment was valued at USD 2.74 billion in 2019 and showed a gradual increase during the forecast period.

    Regional Analysis

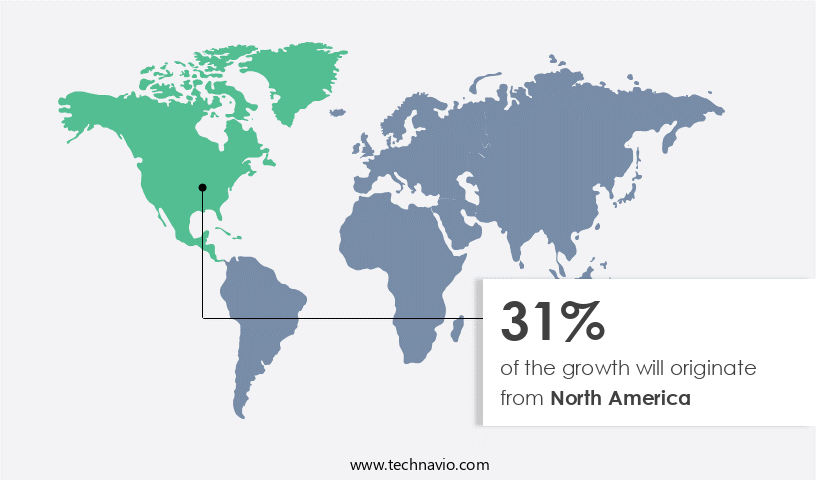
    North America is estimated to contribute 31% to the growth of the global market during the forecast period.Technavio’s analysts have elaborately explained the regional trends and drivers that shape the market during the forecast period.

    Air Quality Monitor Market Share by Geography

     Request Free Sample

    The global air quality control market is witnessing significant growth due to increasing health risks associated with ambient air pollution levels. The use of advanced technologies such as remote monitoring, cloud-based platforms, and sensor fusion with machine learning algorithms is driving the market. Infrared sensors and ultrasonic sensors are being extensively used for real-time monitoring of air quality index, particle matter, carbon monoxide, nitrogen dioxide, and sulfur dioxide. Energy efficiency is a key consideration in the market, with solutions that offer low power consumption and long sensor lifetime gaining popularity. Public awareness regarding indoor and outdoor air quality is on the rise, leading to the adoption of air quality management systems in buildings and smart cities.

    Ventilation systems, air filtration, and air purification are essential components of these systems. Predictive analytics and data analysis are being used to identify patterns and trends in air quality data, enabling proactive measures to prevent health risks. Regulatory standards for air quality are becoming increasingly stringent, necessitating the use of reliable and accurate air quality sensors. Gas chromatography, mass spectrometry, and metal oxide sensors are commonly used for measuring various pollutants. Wireless connectivity and API integration enable easy data logging, compliance reporting, and data visualization. Industrial emissions and sound level are significant contributors to air pollution, leading to the adoption of industrial emissions monitoring systems and sound level monitors.

    Multi-sensor systems are being used to measure multiple pollutants simultaneously, providing a comprehensive solution for air quality management. The US Environmental Protection Agency (EPA) is working to reduce air pollution in non-attainment areas by identifying areas that do not meet the national ambient air quality standards and developing plans to improve air quality. The Western parts of the US have experienced unprecedented wildfires, leading to increased demand for air quality monitoring systems. The Internet of Things (IoT) and artificial intelligence are being used to optimize air quality management, with solutions that offer real-time monitoring, predictive analytics, and data visualization.

    Occupancy monitoring and ventilation systems are essential components of IoT-enabled air quality management solutions. The global air quality control market is expected to continue its growth trajectory, driven by increasing health risks associated with air pollution, regulatory requirements, and technological advancements.

    Market Dynamics

    Our researchers analyzed the data with 2024 as the base year, along with the key drivers, trends, and challenges. A holistic analysis of drivers will help companies refine their marketing strategies to gain a competitive advantage.

    What are the key market drivers leading to the rise in the adoption of Air Quality Monitor Industry?

    • The increasing recognition of the importance of indoor air quality in both residential and commercial sectors serves as the primary catalyst for market growth. 

    • The market is experiencing significant growth due to the increasing awareness of the importance of maintaining healthy indoor environments. The adverse health effects of poor air quality, such as respiratory diseases, heart disease, and stroke, have become a major concern. In 2024, air pollution remained a critical global health issue, with the World Health Organization (WHO) reporting that millions of premature deaths occur annually due to air pollution. Despite ongoing efforts to improve air quality, 99% of the global population continues to breathe air that exceeds WHO guideline limits. Advanced technologies such as electrochemical sensors, smart cities, artificial intelligence, and multi-sensor systems are driving innovation in air quality monitoring.
    • These technologies enable real-time monitoring of pollutants such as nitrogen dioxide, sound level, and mass spectrometry. Air filtration and air purification systems are also gaining popularity to mitigate the effects of indoor air pollution. Laser particle counters and industrial emissions monitoring are essential applications of air quality monitoring systems. These systems help in identifying and reducing the sources of air pollution, thereby improving overall air quality. Mobile apps and user-friendly interfaces make it easier for individuals and businesses to monitor and manage their air quality in real-time. In conclusion, the market is expected to grow significantly due to the increasing health concerns associated with poor air quality and the availability of advanced technologies for monitoring and mitigating air pollution.
    • The need for cleaner and healthier indoor environments is a priority for individuals and businesses, making air quality monitoring a crucial investment.

    What are the market trends shaping the Air Quality Monitor Industry?

    • Green buildings are increasingly becoming the market trend due to their numerous benefits, such as energy efficiency and reduced carbon footprint. The adoption of green building practices is not only mandatory for organizations seeking sustainability but also for those aiming to stay competitive in the real estate industry.

    • The market is experiencing significant growth due to the increasing emphasis on indoor environmental quality and regulatory compliance. Real-time monitoring of air quality is essential for ensuring health, comfort, and productivity in buildings. Regulations for outdoor air quality and pollution control are stringent in many countries, necessitating the use of advanced air quality monitoring technologies. Air quality sensors that detect sulfur dioxide, volatile organic compounds, and other pollutants are integral to these systems. Data visualization tools and API integration enable easy access to critical information, while metal oxide sensors provide accurate and reliable measurements.
    • Compliance reporting is another key factor driving market growth, as organizations seek to meet regulatory standards and protect the health of their employees and customers. The trend towards green buildings is a significant market driver, as these structures prioritize air quality monitoring, ventilation management, humidity control, and indoor dust and gas level management. Air quality monitors are an essential component of these systems, helping to ensure the sustainability and high performance of green buildings. By investing in air quality monitoring technology, businesses can create healthier work environments, improve employee productivity, and enhance their reputation as environmentally responsible organizations.

    What challenges does the Air Quality Monitor Industry face during its growth?

    • The high cost of deploying air quality monitoring devices is a significant challenge impeding the growth of the industry. 

    • Air quality monitoring is a critical aspect for various sectors, including industrial, commercial, and residential buildings. Indoor and outdoor air quality needs to be monitored according to specific requirements. Advanced air quality sensors for continuous monitoring can be costly, with each station costing upwards of USD250,000 for a network around a facility. This high cost poses a challenge for widespread adoption. In developing countries, such as India, the lack of real-time air quality monitoring stations in cities has led to a demand for affordable monitoring solutions.
    • Indoor air quality is particularly important, as it significantly impacts the health and satisfaction of building occupants. Industrial facilities, commercial buildings, and healthcare facilities prioritize indoor air monitoring to maintain optimal conditions. Despite the challenges, the importance of air quality monitoring continues to emphasize the need for innovative and cost-effective solutions.

    Exclusive Customer Landscape

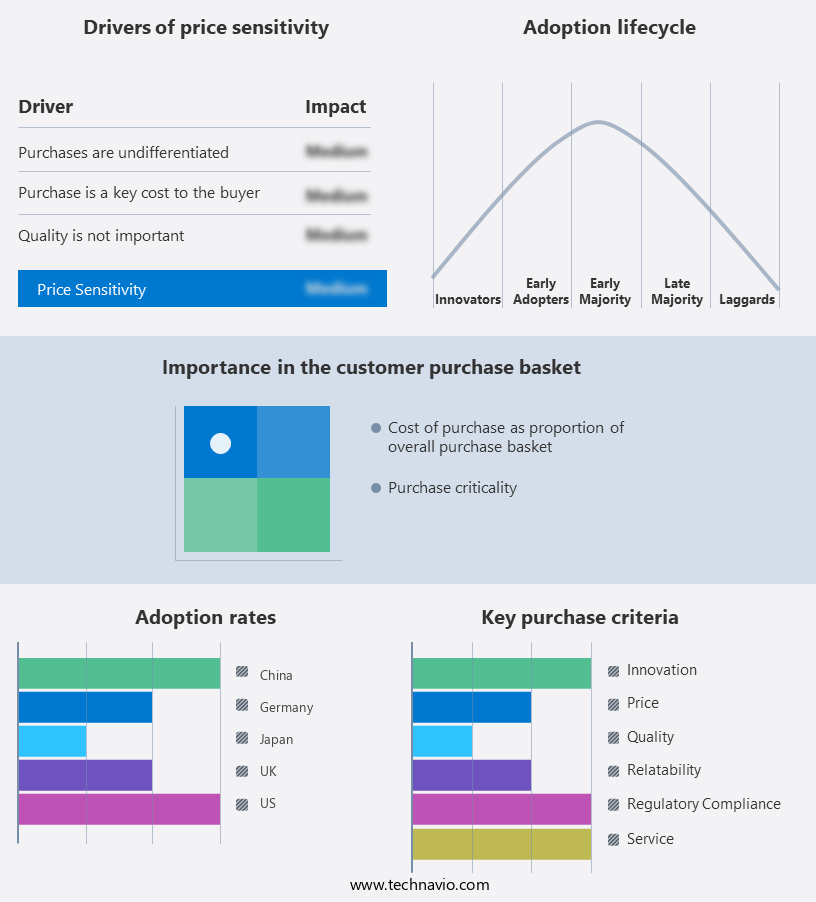
    The air quality monitor market forecasting report includes the adoption lifecycle of the market, covering from the innovator’s stage to the laggard’s stage. It focuses on adoption rates in different regions based on penetration. Furthermore, the air quality monitor market report also includes key purchase criteria and drivers of price sensitivity to help companies evaluate and develop their market growth analysis strategies.

    Air Quality Monitor Market Share by Geography

     Customer Landscape

    Key Companies & Market Insights

    Companies are implementing various strategies, such as strategic alliances, air quality monitor market forecast, partnerships, mergers and acquisitions, geographical expansion, and product/service launches, to enhance their presence in the industry.

    3M Co. - The company specializes in providing advanced air quality monitoring solutions, featuring the EVM 7, EVM 4, and EVM 3 models. These innovative devices detect and analyze various pollutants, ensuring indoor environments maintain optimal air quality. By utilizing cutting-edge technology, these monitors elevate health and safety standards, providing real-time data for informed decision-making. The company's commitment to research and development drives continuous improvement, ensuring clients access the most accurate and reliable air quality solutions.

    The industry research and growth report includes detailed analyses of the competitive landscape of the market and information about key companies, including:

    • 3M Co.
    • ACOEM Group
    • Aeroqual
    • Agilent Technologies Inc.
    • Airthinx Inc.
    • Atmotech Inc.
    • Emerson Electric Co.
    • General Electric Co.
    • HANGZHOU ZETIAN TECHNOLOGY CO. LTD.
    • Honeywell International Inc.
    • HORIBA Ltd.
    • IQAir AG
    • Merck KGaA
    • Perkin Elmer Inc.
    • Siemens AG
    • Testo SE and Co. KGaA
    • Thermo Fisher Scientific Inc.
    • Tisch Environmental Inc.
    • TSI Inc.
    • Vaisala Oyj

    Qualitative and quantitative analysis of companies has been conducted to help clients understand the wider business environment as well as the strengths and weaknesses of key industry players. Data is qualitatively analyzed to categorize companies as pure play, category-focused, industry-focused, and diversified; it is quantitatively analyzed to categorize companies as dominant, leading, strong, tentative, and weak.

    Recent Development and News in Air Quality Monitor Market

    • In February 2024, Honeywell announced the launch of its new Air Quality Control System, integrating advanced air filtration technologies and real-time monitoring capabilities, aiming to cater to the increasing demand for indoor air quality solutions in commercial buildings (Honeywell Press Release, 2024).
    • In July 2025, Sensirion AG, a leading sensor manufacturer, entered into a strategic partnership with Microsoft to develop and commercialize IoT-based air quality monitoring solutions. This collaboration is expected to accelerate the adoption of smart air quality monitoring systems in various industries (Microsoft News Center, 2025).
    • In September 2024, Aclima, a pioneer in sensor technologies, raised USD30 million in a Series C funding round led by Breakthrough Energy Ventures. The funds will be used to expand their product offerings and scale their air quality monitoring solutions for various applications, including transportation and industrial emissions monitoring (Business Wire, 2024).
    • In December 2025, the European Union passed the new Air Quality Directive, setting stricter limits for air pollutants and mandating the installation of real-time air quality monitoring systems in densely populated areas. This regulatory initiative is expected to drive significant growth in the European air quality monitoring market (European Commission, 2025).

    Research Analyst Overview

    The market is witnessing significant activity and trends as ambient monitoring becomes a priority for governments and businesses alike. Air quality policies and standards are driving the demand for advanced sensor networks to ensure compliance with regulations and green building certification. Energy conservation and sustainable development are also key factors, as air pollution mitigation efforts intersect with the need to reduce greenhouse gas emissions. Community engagement is crucial in addressing air quality concerns, leading to the rise of citizen science initiatives and open data platforms for air quality reporting. Cardiovascular disease and respiratory illnesses are major health issues linked to poor air quality, making air quality indexes and forecasting essential tools for public health.

    Air quality legislation and regulations continue to evolve, with a focus on personal air quality and air quality alerts. Companies are responding by integrating real-time monitoring and reporting into their operations, reducing their carbon footprint and contributing to clean air initiatives. As climate change becomes a pressing concern, the importance of addressing air quality and its impact on the environment and public health is increasingly recognized. The integration of air quality data into building performance assessments and greenhouse gas emissions reporting is a promising development for the future of this market.

    Dive into Technavio’s robust research methodology, blending expert interviews, extensive data synthesis, and validated models for unparalleled Air Quality Monitor Market insights. See full methodology.

    Market Scope

    Report Coverage

    Details

    Page number

    244

    Base year

    2024

    Historic period

    2019-2023

    Forecast period

    2025-2029

    Growth momentum & CAGR

    Accelerate at a CAGR of 7.1%

    Market growth 2025-2029

    USD 2289.5 million

    Market structure

    Fragmented

    YoY growth 2024-2025(%)

    6.5

    Key countries

    US, China, Germany, UK, Canada, France, India, Japan, Italy, and South Korea

    Competitive landscape

    Leading Companies, Market Positioning of Companies, Competitive Strategies, and Industry Risks

    Request Free Sample

    What are the Key Data Covered in this Air Quality Monitor Market Research and Growth Report?

    • CAGR of the Air Quality Monitor industry during the forecast period
    • Detailed information on factors that will drive the growth and forecasting between 2025 and 2029
    • Precise estimation of the size of the market and its contribution of the industry in focus to the parent market
    • Accurate predictions about upcoming growth and trends and changes in consumer behaviour
    • Growth of the market across North America, Europe, APAC, Middle East and Africa, and South America
    • Thorough analysis of the market’s competitive landscape and detailed information about companies
    • Comprehensive analysis of factors that will challenge the air quality monitor market growth of industry companies

    We can help! Our analysts can customize this air quality monitor market research report to meet your requirements.

    Get in touch


    1 Executive Summary

    • 1.1 Market overview
      • Executive Summary - Chart on Market Overview
      • Executive Summary - Data Table on Market Overview
      • Executive Summary - Chart on Global Market Characteristics
      • Executive Summary - Chart on Market by Geography
      • Executive Summary - Chart on Market Segmentation by Product
      • Executive Summary - Chart on Market Segmentation by End-user
      • Executive Summary - Chart on Market Segmentation by Type
      • Executive Summary - Chart on Market Segmentation by Component
      • Executive Summary - Chart on Incremental Growth
      • Executive Summary - Data Table on Incremental Growth
      • Executive Summary - Chart on Company Market Positioning

    2 Technavio Analysis

    • 2.1 Analysis of price sensitivity, lifecycle, customer purchase basket, adoption rates, and purchase criteria
      • Analysis of price sensitivity, lifecycle, customer purchase basket, adoption rates, and purchase criteria
    • 2.2 Criticality of inputs and Factors of differentiation
      • Overview on criticality of inputs and factors of differentiation
    • 2.3 Factors of disruption
      • Overview on factors of disruption
    • 2.4 Impact of drivers and challenges
      • Impact of drivers and challenges in 2024 and 2029

    3 Market Landscape

    • 3.1 Market ecosystem
      • Parent Market
      • Data Table on - Parent Market
    • 3.2 Market characteristics
      • Market characteristics analysis
    • 3.3 Value chain analysis
      • Value chain analysis

    4 Market Sizing

    • 4.1 Market definition
      • Offerings of companies included in the market definition
    • 4.2 Market segment analysis
      • Market segments
    • 4.3 Market size 2024
      • 4.4 Market outlook: Forecast for 2024-2029
        • Chart on Global - Market size and forecast 2024-2029 ($ million)
        • Data Table on Global - Market size and forecast 2024-2029 ($ million)
        • Chart on Global Market: Year-over-year growth 2024-2029 (%)
        • Data Table on Global Market: Year-over-year growth 2024-2029 (%)

      5 Historic Market Size

      • 5.1 Global Air Quality Monitor Market 2019 - 2023
        • Historic Market Size - Data Table on Global Air Quality Monitor Market 2019 - 2023 ($ million)
      • 5.2 Product segment analysis 2019 - 2023
        • Historic Market Size - Product Segment 2019 - 2023 ($ million)
      • 5.3 End-user segment analysis 2019 - 2023
        • Historic Market Size - End-user Segment 2019 - 2023 ($ million)
      • 5.4 Type segment analysis 2019 - 2023
        • Historic Market Size - Type Segment 2019 - 2023 ($ million)
      • 5.5 Component segment analysis 2019 - 2023
        • Historic Market Size - Component Segment 2019 - 2023 ($ million)
      • 5.6 Geography segment analysis 2019 - 2023
        • Historic Market Size - Geography Segment 2019 - 2023 ($ million)
      • 5.7 Country segment analysis 2019 - 2023
        • Historic Market Size - Country Segment 2019 - 2023 ($ million)

      6 Qualitative Analysis

      • 6.1 Impact of AI in global air quality monitor market

        7 Five Forces Analysis

        • 7.1 Five forces summary
          • Five forces analysis - Comparison between 2024 and 2029
        • 7.2 Bargaining power of buyers
          • Bargaining power of buyers - Impact of key factors 2024 and 2029
        • 7.3 Bargaining power of suppliers
          • Bargaining power of suppliers - Impact of key factors in 2024 and 2029
        • 7.4 Threat of new entrants
          • Threat of new entrants - Impact of key factors in 2024 and 2029
        • 7.5 Threat of substitutes
          • Threat of substitutes - Impact of key factors in 2024 and 2029
        • 7.6 Threat of rivalry
          • Threat of rivalry - Impact of key factors in 2024 and 2029
        • 7.7 Market condition
          • Chart on Market condition - Five forces 2024 and 2029

        8 Market Segmentation by Product

        • 8.1 Market segments
          • Chart on Product - Market share 2024-2029 (%)
          • Data Table on Product - Market share 2024-2029 (%)
        • 8.2 Comparison by Product
          • Chart on Comparison by Product
          • Data Table on Comparison by Product
        • 8.3 Indoor - Market size and forecast 2024-2029
          • Chart on Indoor - Market size and forecast 2024-2029 ($ million)
          • Data Table on Indoor - Market size and forecast 2024-2029 ($ million)
          • Chart on Indoor - Year-over-year growth 2024-2029 (%)
          • Data Table on Indoor - Year-over-year growth 2024-2029 (%)
        • 8.4 Outdoor - Market size and forecast 2024-2029
          • Chart on Outdoor - Market size and forecast 2024-2029 ($ million)
          • Data Table on Outdoor - Market size and forecast 2024-2029 ($ million)
          • Chart on Outdoor - Year-over-year growth 2024-2029 (%)
          • Data Table on Outdoor - Year-over-year growth 2024-2029 (%)
        • 8.5 Wearable - Market size and forecast 2024-2029
          • Chart on Wearable - Market size and forecast 2024-2029 ($ million)
          • Data Table on Wearable - Market size and forecast 2024-2029 ($ million)
          • Chart on Wearable - Year-over-year growth 2024-2029 (%)
          • Data Table on Wearable - Year-over-year growth 2024-2029 (%)
        • 8.6 Market opportunity by Product
          • Market opportunity by Product ($ million)
          • Data Table on Market opportunity by Product ($ million)

        9 Market Segmentation by End-user

        • 9.1 Market segments
          • Chart on End-user - Market share 2024-2029 (%)
          • Data Table on End-user - Market share 2024-2029 (%)
        • 9.2 Comparison by End-user
          • Chart on Comparison by End-user
          • Data Table on Comparison by End-user
        • 9.3 Government - Market size and forecast 2024-2029
          • Chart on Government - Market size and forecast 2024-2029 ($ million)
          • Data Table on Government - Market size and forecast 2024-2029 ($ million)
          • Chart on Government - Year-over-year growth 2024-2029 (%)
          • Data Table on Government - Year-over-year growth 2024-2029 (%)
        • 9.4 Commercial and residential - Market size and forecast 2024-2029
          • Chart on Commercial and residential - Market size and forecast 2024-2029 ($ million)
          • Data Table on Commercial and residential - Market size and forecast 2024-2029 ($ million)
          • Chart on Commercial and residential - Year-over-year growth 2024-2029 (%)
          • Data Table on Commercial and residential - Year-over-year growth 2024-2029 (%)
        • 9.5 Energy and pharmaceuticals - Market size and forecast 2024-2029
          • Chart on Energy and pharmaceuticals - Market size and forecast 2024-2029 ($ million)
          • Data Table on Energy and pharmaceuticals - Market size and forecast 2024-2029 ($ million)
          • Chart on Energy and pharmaceuticals - Year-over-year growth 2024-2029 (%)
          • Data Table on Energy and pharmaceuticals - Year-over-year growth 2024-2029 (%)
        • 9.6 Others - Market size and forecast 2024-2029
          • Chart on Others - Market size and forecast 2024-2029 ($ million)
          • Data Table on Others - Market size and forecast 2024-2029 ($ million)
          • Chart on Others - Year-over-year growth 2024-2029 (%)
          • Data Table on Others - Year-over-year growth 2024-2029 (%)
        • 9.7 Market opportunity by End-user
          • Market opportunity by End-user ($ million)
          • Data Table on Market opportunity by End-user ($ million)

        10 Market Segmentation by Type

        • 10.1 Market segments
          • Chart on Type - Market share 2024-2029 (%)
          • Data Table on Type - Market share 2024-2029 (%)
        • 10.2 Comparison by Type
          • Chart on Comparison by Type
          • Data Table on Comparison by Type
        • 10.3 Chemical pollutants - Market size and forecast 2024-2029
          • Chart on Chemical pollutants - Market size and forecast 2024-2029 ($ million)
          • Data Table on Chemical pollutants - Market size and forecast 2024-2029 ($ million)
          • Chart on Chemical pollutants - Year-over-year growth 2024-2029 (%)
          • Data Table on Chemical pollutants - Year-over-year growth 2024-2029 (%)
        • 10.4 Physical pollutants - Market size and forecast 2024-2029
          • Chart on Physical pollutants - Market size and forecast 2024-2029 ($ million)
          • Data Table on Physical pollutants - Market size and forecast 2024-2029 ($ million)
          • Chart on Physical pollutants - Year-over-year growth 2024-2029 (%)
          • Data Table on Physical pollutants - Year-over-year growth 2024-2029 (%)
        • 10.5 Biological pollutants - Market size and forecast 2024-2029
          • Chart on Biological pollutants - Market size and forecast 2024-2029 ($ million)
          • Data Table on Biological pollutants - Market size and forecast 2024-2029 ($ million)
          • Chart on Biological pollutants - Year-over-year growth 2024-2029 (%)
          • Data Table on Biological pollutants - Year-over-year growth 2024-2029 (%)
        • 10.6 Market opportunity by Type
          • Market opportunity by Type ($ million)
          • Data Table on Market opportunity by Type ($ million)

        11 Market Segmentation by Component

        • 11.1 Market segments
          • Chart on Component - Market share 2024-2029 (%)
          • Data Table on Component - Market share 2024-2029 (%)
        • 11.2 Comparison by Component
          • Chart on Comparison by Component
          • Data Table on Comparison by Component
        • 11.3 Hardware - Market size and forecast 2024-2029
          • Chart on Hardware - Market size and forecast 2024-2029 ($ million)
          • Data Table on Hardware - Market size and forecast 2024-2029 ($ million)
          • Chart on Hardware - Year-over-year growth 2024-2029 (%)
          • Data Table on Hardware - Year-over-year growth 2024-2029 (%)
        • 11.4 Software - Market size and forecast 2024-2029
          • Chart on Software - Market size and forecast 2024-2029 ($ million)
          • Data Table on Software - Market size and forecast 2024-2029 ($ million)
          • Chart on Software - Year-over-year growth 2024-2029 (%)
          • Data Table on Software - Year-over-year growth 2024-2029 (%)
        • 11.5 Services - Market size and forecast 2024-2029
          • Chart on Services - Market size and forecast 2024-2029 ($ million)
          • Data Table on Services - Market size and forecast 2024-2029 ($ million)
          • Chart on Services - Year-over-year growth 2024-2029 (%)
          • Data Table on Services - Year-over-year growth 2024-2029 (%)
        • 11.6 Market opportunity by Component
          • Market opportunity by Component ($ million)
          • Data Table on Market opportunity by Component ($ million)

        12 Customer Landscape

        • 12.1 Customer landscape overview
          • Analysis of price sensitivity, lifecycle, customer purchase basket, adoption rates, and purchase criteria

        13 Geographic Landscape

        • 13.1 Geographic segmentation
          • Chart on Market share by geography 2024-2029 (%)
          • Data Table on Market share by geography 2024-2029 (%)
        • 13.2 Geographic comparison
          • Chart on Geographic comparison
          • Data Table on Geographic comparison
        • 13.3 North America - Market size and forecast 2024-2029
          • Chart on North America - Market size and forecast 2024-2029 ($ million)
          • Data Table on North America - Market size and forecast 2024-2029 ($ million)
          • Chart on North America - Year-over-year growth 2024-2029 (%)
          • Data Table on North America - Year-over-year growth 2024-2029 (%)
        • 13.4 Europe - Market size and forecast 2024-2029
          • Chart on Europe - Market size and forecast 2024-2029 ($ million)
          • Data Table on Europe - Market size and forecast 2024-2029 ($ million)
          • Chart on Europe - Year-over-year growth 2024-2029 (%)
          • Data Table on Europe - Year-over-year growth 2024-2029 (%)
        • 13.5 APAC - Market size and forecast 2024-2029
          • Chart on APAC - Market size and forecast 2024-2029 ($ million)
          • Data Table on APAC - Market size and forecast 2024-2029 ($ million)
          • Chart on APAC - Year-over-year growth 2024-2029 (%)
          • Data Table on APAC - Year-over-year growth 2024-2029 (%)
        • 13.6 Middle East and Africa - Market size and forecast 2024-2029
          • Chart on Middle East and Africa - Market size and forecast 2024-2029 ($ million)
          • Data Table on Middle East and Africa - Market size and forecast 2024-2029 ($ million)
          • Chart on Middle East and Africa - Year-over-year growth 2024-2029 (%)
          • Data Table on Middle East and Africa - Year-over-year growth 2024-2029 (%)
        • 13.7 South America - Market size and forecast 2024-2029
          • Chart on South America - Market size and forecast 2024-2029 ($ million)
          • Data Table on South America - Market size and forecast 2024-2029 ($ million)
          • Chart on South America - Year-over-year growth 2024-2029 (%)
          • Data Table on South America - Year-over-year growth 2024-2029 (%)
        • 13.8 US - Market size and forecast 2024-2029
          • Chart on US - Market size and forecast 2024-2029 ($ million)
          • Data Table on US - Market size and forecast 2024-2029 ($ million)
          • Chart on US - Year-over-year growth 2024-2029 (%)
          • Data Table on US - Year-over-year growth 2024-2029 (%)
        • 13.9 China - Market size and forecast 2024-2029
          • Chart on China - Market size and forecast 2024-2029 ($ million)
          • Data Table on China - Market size and forecast 2024-2029 ($ million)
          • Chart on China - Year-over-year growth 2024-2029 (%)
          • Data Table on China - Year-over-year growth 2024-2029 (%)
        • 13.10 Germany - Market size and forecast 2024-2029
          • Chart on Germany - Market size and forecast 2024-2029 ($ million)
          • Data Table on Germany - Market size and forecast 2024-2029 ($ million)
          • Chart on Germany - Year-over-year growth 2024-2029 (%)
          • Data Table on Germany - Year-over-year growth 2024-2029 (%)
        • 13.11 UK - Market size and forecast 2024-2029
          • Chart on UK - Market size and forecast 2024-2029 ($ million)
          • Data Table on UK - Market size and forecast 2024-2029 ($ million)
          • Chart on UK - Year-over-year growth 2024-2029 (%)
          • Data Table on UK - Year-over-year growth 2024-2029 (%)
        • 13.12 Japan - Market size and forecast 2024-2029
          • Chart on Japan - Market size and forecast 2024-2029 ($ million)
          • Data Table on Japan - Market size and forecast 2024-2029 ($ million)
          • Chart on Japan - Year-over-year growth 2024-2029 (%)
          • Data Table on Japan - Year-over-year growth 2024-2029 (%)
        • 13.13 Canada - Market size and forecast 2024-2029
          • Chart on Canada - Market size and forecast 2024-2029 ($ million)
          • Data Table on Canada - Market size and forecast 2024-2029 ($ million)
          • Chart on Canada - Year-over-year growth 2024-2029 (%)
          • Data Table on Canada - Year-over-year growth 2024-2029 (%)
        • 13.14 France - Market size and forecast 2024-2029
          • Chart on France - Market size and forecast 2024-2029 ($ million)
          • Data Table on France - Market size and forecast 2024-2029 ($ million)
          • Chart on France - Year-over-year growth 2024-2029 (%)
          • Data Table on France - Year-over-year growth 2024-2029 (%)
        • 13.15 India - Market size and forecast 2024-2029
          • Chart on India - Market size and forecast 2024-2029 ($ million)
          • Data Table on India - Market size and forecast 2024-2029 ($ million)
          • Chart on India - Year-over-year growth 2024-2029 (%)
          • Data Table on India - Year-over-year growth 2024-2029 (%)
        • 13.16 Italy - Market size and forecast 2024-2029
          • Chart on Italy - Market size and forecast 2024-2029 ($ million)
          • Data Table on Italy - Market size and forecast 2024-2029 ($ million)
          • Chart on Italy - Year-over-year growth 2024-2029 (%)
          • Data Table on Italy - Year-over-year growth 2024-2029 (%)
        • 13.17 South Korea - Market size and forecast 2024-2029
          • Chart on South Korea - Market size and forecast 2024-2029 ($ million)
          • Data Table on South Korea - Market size and forecast 2024-2029 ($ million)
          • Chart on South Korea - Year-over-year growth 2024-2029 (%)
          • Data Table on South Korea - Year-over-year growth 2024-2029 (%)
        • 13.18 Market opportunity by geography
          • Market opportunity by geography ($ million)
          • Data Tables on Market opportunity by geography ($ million)

        14 Drivers, Challenges, and Opportunity/Restraints

        • 14.1 Market drivers
          • 14.2 Market challenges
            • 14.3 Impact of drivers and challenges
              • Impact of drivers and challenges in 2024 and 2029
            • 14.4 Market opportunities/restraints

              15 Competitive Landscape

              • 15.1 Overview
                • 15.2 Competitive Landscape
                  • Overview on criticality of inputs and factors of differentiation
                • 15.3 Landscape disruption
                  • Overview on factors of disruption
                • 15.4 Industry risks
                  • Impact of key risks on business

                16 Competitive Analysis

                • 16.1 Companies profiled
                  • Companies covered
                • 16.2 Company ranking index
                  • Company ranking index
                • 16.3 Market positioning of companies
                  • Matrix on companies position and classification
                • 3M Co.
                  • 3M Co. - Overview
                  • 3M Co. - Business segments
                  • 3M Co. - Key news
                  • 3M Co. - Key offerings
                  • 3M Co. - Segment focus
                  • SWOT
                • 16.5 ACOEM Group
                  • ACOEM Group - Overview
                  • ACOEM Group - Product / Service
                  • ACOEM Group - Key offerings
                  • SWOT
                • 16.6 Aeroqual
                  • Aeroqual - Overview
                  • Aeroqual - Product / Service
                  • Aeroqual - Key offerings
                  • SWOT
                • 16.7 Agilent Technologies Inc.
                  • Agilent Technologies Inc. - Overview
                  • Agilent Technologies Inc. - Business segments
                  • Agilent Technologies Inc. - Key news
                  • Agilent Technologies Inc. - Key offerings
                  • Agilent Technologies Inc. - Segment focus
                  • SWOT
                • 16.8 Airthinx Inc.
                  • Airthinx Inc. - Overview
                  • Airthinx Inc. - Product / Service
                  • Airthinx Inc. - Key offerings
                  • SWOT
                • 16.9 Honeywell International Inc.
                  • Honeywell International Inc. - Overview
                  • Honeywell International Inc. - Business segments
                  • Honeywell International Inc. - Key news
                  • Honeywell International Inc. - Key offerings
                  • Honeywell International Inc. - Segment focus
                  • SWOT
                • 16.10 HORIBA Ltd.
                  • HORIBA Ltd. - Overview
                  • HORIBA Ltd. - Business segments
                  • HORIBA Ltd. - Key news
                  • HORIBA Ltd. - Key offerings
                  • HORIBA Ltd. - Segment focus
                  • SWOT
                • 16.11 IQAir AG
                  • IQAir AG - Overview
                  • IQAir AG - Product / Service
                  • IQAir AG - Key offerings
                  • SWOT
                • 16.12 Merck KGaA
                  • Merck KGaA - Overview
                  • Merck KGaA - Business segments
                  • Merck KGaA - Key news
                  • Merck KGaA - Key offerings
                  • Merck KGaA - Segment focus
                  • SWOT
                • 16.13 Perkin Elmer Inc.
                  • Perkin Elmer Inc. - Overview
                  • Perkin Elmer Inc. - Business segments
                  • Perkin Elmer Inc. - Key offerings
                  • Perkin Elmer Inc. - Segment focus
                  • SWOT
                • 16.14 Siemens AG
                  • Siemens AG - Overview
                  • Siemens AG - Business segments
                  • Siemens AG - Key news
                  • Siemens AG - Key offerings
                  • Siemens AG - Segment focus
                  • SWOT
                • 16.15 Testo SE and Co. KGaA
                  • Testo SE and Co. KGaA - Overview
                  • Testo SE and Co. KGaA - Product / Service
                  • Testo SE and Co. KGaA - Key offerings
                  • SWOT
                • 16.16 Thermo Fisher Scientific Inc.
                  • Thermo Fisher Scientific Inc. - Overview
                  • Thermo Fisher Scientific Inc. - Business segments
                  • Thermo Fisher Scientific Inc. - Key news
                  • Thermo Fisher Scientific Inc. - Key offerings
                  • Thermo Fisher Scientific Inc. - Segment focus
                  • SWOT
                • 16.17 TSI Inc.
                  • TSI Inc. - Overview
                  • TSI Inc. - Product / Service
                  • TSI Inc. - Key offerings
                  • SWOT
                • 16.18 Vaisala Oyj
                  • Vaisala Oyj - Overview
                  • Vaisala Oyj - Business segments
                  • Vaisala Oyj - Key news
                  • Vaisala Oyj - Key offerings
                  • Vaisala Oyj - Segment focus
                  • SWOT

                17 Appendix

                • 17.1 Scope of the report
                  • 17.2 Inclusions and exclusions checklist
                    • Inclusions checklist
                    • Exclusions checklist
                  • 17.3 Currency conversion rates for US$
                    • Currency conversion rates for US$
                  • 17.4 Research methodology
                    • Research methodology
                  • 17.5 Data procurement
                    • Information sources
                  • 17.6 Data validation
                    • Data validation
                  • 17.7 Validation techniques employed for market sizing
                    • Validation techniques employed for market sizing
                  • 17.8 Data synthesis
                    • Data synthesis
                  • 17.9 360 degree market analysis
                    • 360 degree market analysis
                  • 17.10 List of abbreviations
                    • List of abbreviations

                  Research Methodology

                  Technavio presents a detailed picture of the market by way of study, synthesis, and summation of data from multiple sources. The analysts have presented the various facets of the market with a particular focus on identifying the key industry influencers. The data thus presented is comprehensive, reliable, and the result of extensive research, both primary and secondary.

                  INFORMATION SOURCES

                  Primary sources

                  • Manufacturers and suppliers
                  • Channel partners
                  • Industry experts
                  • Strategic decision makers

                  Secondary sources

                  • Industry journals and periodicals
                  • Government data
                  • Financial reports of key industry players
                  • Historical data
                  • Press releases

                  DATA ANALYSIS

                  Data Synthesis

                  • Collation of data
                  • Estimation of key figures
                  • Analysis of derived insights

                  Data Validation

                  • Triangulation with data models
                  • Reference against proprietary databases
                  • Corroboration with industry experts

                  REPORT WRITING

                  Qualitative

                  • Market drivers
                  • Market challenges
                  • Market trends
                  • Five forces analysis

                  Quantitative

                  • Market size and forecast
                  • Market segmentation
                  • Geographical insights
                  • Competitive landscape

                  Interested in this report?

                  Get your sample now to see our research methodology and insights!

                  Download Now

                  Frequently Asked Questions

                  Air Quality Monitor market growth will increase by $ 2289.5 mn during 2025-2029 .

                  The Air Quality Monitor market is expected to grow at a CAGR of 7.1% during 2025-2029 .

                  Air Quality Monitor market is segmented by Product( Indoor, Outdoor, Wearable) End-user( Government, Commercial and residential, Energy and pharmaceuticals, Others) Type( Chemical pollutants, Physical pollutants, Biological pollutants, Middle East and Africa, South America)

                  3M Co., ACOEM Group, Aeroqual, Agilent Technologies Inc., Airthinx Inc., Atmotech Inc., Emerson Electric Co., General Electric Co., HANGZHOU ZETIAN TECHNOLOGY CO. LTD., Honeywell International Inc., HORIBA Ltd., IQAir AG, Merck KGaA, Perkin Elmer Inc., Siemens AG, Testo SE and Co. KGaA, Thermo Fisher Scientific Inc., Tisch Environmental Inc., TSI Inc., Vaisala Oyj are a few of the key vendors in the Air Quality Monitor market.

                  North America will register the highest growth rate of 31% among the other regions. Therefore, the Air Quality Monitor market in North America is expected to garner significant business opportunities for the vendors during the forecast period.

                  US, China, Germany, UK, Canada, France, India, Japan, Italy, South Korea

                  • Growing need to monitor indoor air quality in residential and commercial sectorsThe growing need to optimize the indoor environment to achieve healthier and safer living spaces by investing in air quality monitoring systems is a significant driver for the market. Adverse health effects such as the prevalence of severe diseases and increased mortality from stroke is the driving factor this market.
                  • heart disease is the driving factor this market.
                  • chronic obstructive pulmonary disease is the driving factor this market.
                  • lung cancer is the driving factor this market.
                  • and acute respiratory infections have increased due to the deteriorating air quality. In 2024 is the driving factor this market.
                  • air pollution remained a critical global health issue is the driving factor this market.
                  • with the World Health Organization (WHO) emphasizing its role in causing millions of premature deaths annually. Despite ongoing efforts to improve air quality is the driving factor this market.
                  • 99% of the global population continued to breathe air that exceeded WHO guideline limits is the driving factor this market.
                  • highlighting the urgent need for stronger policies and international cooperation to combat this crisis. Also is the driving factor this market.
                  • people living in low- and middle-income countries such as India is the driving factor this market.
                  • South Africa is the driving factor this market.
                  • and others have the highest exposure to air pollution. Thus is the driving factor this market.
                  • as per researchers is the driving factor this market.
                  • the levels of air pollutants such as nitrogen dioxide are increasing in many cities across developing countries due to rising vehicle ownership is the driving factor this market.
                  • industrialization is the driving factor this market.
                  • and the limited effect of policies for air pollution. The deteriorating air quality is also leading to an increased risk of breathing problems and lung diseases. To reduce these health risks and maintain air quality is the driving factor this market.
                  • several global standards for sustainable buildings have been developed is the driving factor this market.
                  • such as LEED and WELL. The LEED (Leadership in Energy and Environmental Design) building standard was established by the USGreen Building Council (USGBC) as a standardized way of evaluating the environmental impact of a building. LEED-certified buildings must meet certain levels of sustainability is the driving factor this market.
                  • energy efficiency is the driving factor this market.
                  • and indoor air quality (among other requirements). Apart from these developments is the driving factor this market.
                  • there has been a continuous need for the installation of air quality monitoring systems in residential and commercial buildings is the driving factor this market.
                  • which will drive the growth of the market significantly during the forecast period. is the driving factor this market.

                  The Air Quality Monitor market vendors should focus on grabbing business opportunities from the Indoor segment as it accounted for the largest market share in the base year.