Alfalfa Market Size 2025-2029
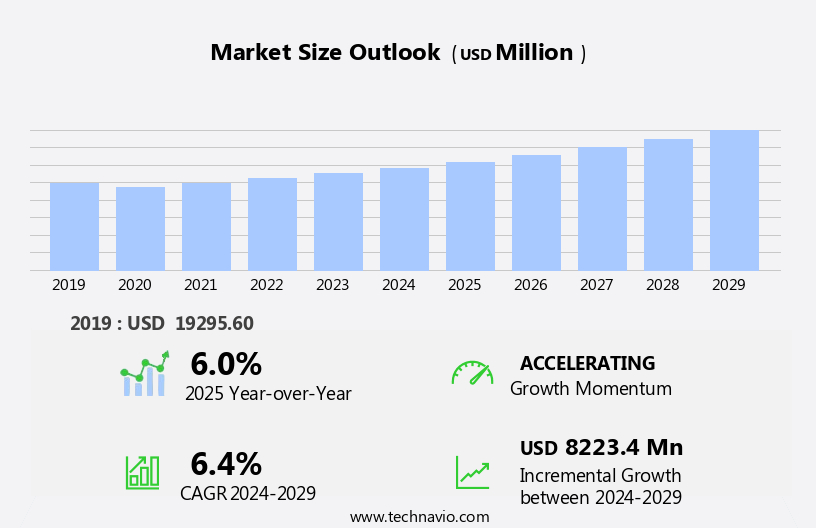
The alfalfa market size is forecast to increase by USD 8.22 billion at a CAGR of 6.4% between 2024 and 2029.
- The market is driven by the increasing population of cattle in farms and the subsequent heightened demand for forage crops. This trend is fueled by the growing global meat consumption, particularly in developing economies, leading to a rise in demand for livestock feed. The organic farming of alfalfa for both cattle feed and alfalfa sprouts is gaining popularity due to the amino acid profile and vitamin A content, which contribute to food safety and animal health. Alfalfa, as a high-protein and nutrient-rich crop, is an ideal choice for livestock farmers. However, the market faces significant challenges. Strict regulations governing the use of pesticides and herbicides in Alfalfa cultivation pose a considerable obstacle.
- Additionally, the market is subject to weather conditions, which can negatively impact crop yields. Droughts and excessive rainfall can lead to significant losses for farmers, adding to the market's volatility. Furthermore, its ability to address industry trends and challenges, such as improving feed efficiency, animal health, and waste management, makes it an essential component of the livestock feed industry. Despite these challenges, the market presents opportunities for growth, particularly for farmers who can effectively manage production costs and navigate regulatory requirements. Companies seeking to capitalize on these opportunities must focus on innovative farming practices, such as precision agriculture and sustainable farming methods, to optimize yields and reduce costs.
What will be the Size of the Alfalfa Market during the forecast period?
Explore in-depth regional segment analysis with market size data - historical 2019-2023 and forecasts 2025-2029 - in the full report.
Request Free Sample
The market analysis reveals a dynamic industry shaped by various factors. Alfalfa utilization remains high, driven by its versatility as a feed source for dairy and beef cattle. Alfalfa breeding continues to advance, with innovations in genetics leading to improved varieties resistant to pests and diseases, such as weeds, insects, and diseases. The marketing strategies adapt to changing consumer demands, with an increasing focus on data analytics and remote sensing for optimizing production and supply chain efficiency. Strict regulations regarding the use of antibiotics and growth promoters in livestock feed are also contributing to the market's growth, as alfalfa is a natural source of essential nutrients. Alfalfa policy and regulations influence the industry, with sustainability initiatives and technology adoption shaping the future of alfalfa farming.
Alfalfa derivatives, including alfalfa byproducts and alfalfa futures, provide opportunities for value addition and risk management. Alfalfa associations and research institutions collaborate to address challenges, such as pests, diseases, and weeds, through precision agriculture and technology advancements. The alfalfa industry faces economic pressures, with price fluctuations influenced by supply and demand dynamics. Alfalfa production remains a critical component of the industry, with farmers utilizing GIS mapping and technology to optimize yields and minimize costs. Overall, the market is characterized by continuous innovation and adaptation to meet evolving consumer needs and regulatory requirements.
How is this Alfalfa Industry segmented?
The alfalfa industry research report provides comprehensive data (region-wise segment analysis), with forecasts and estimates in "USD million" for the period 2025-2029, as well as historical data from 2019-2023 for the following segments.
- Product
- Hay
- Cubes
- Pellets
- Animal Type
- Ruminants
- Horses
- Poultry
- Others
- Method
- Conventional farming
- Sustainable farming
- Organic farming
- Geography
- North America
- US
- Canada
- Mexico
- Europe
- France
- Germany
- APAC
- Australia
- China
- India
- Japan
- South America
- Brazil
- Rest of World (ROW)
- North America
By Product Insights
The Hay segment is estimated to witness significant growth during the forecast period. Alfalfa hay, a protein-rich and fiber-abundant forage, is a preferred choice for animal feed, particularly for horses, dairy cows, beef cattle, sheep, poultry, and other farm animals. Its nutritional value, including minerals, vitamins A and K, and a desirable amino acid profile, makes it an essential component in livestock diets. The demand for alfalfa hay is fueled by the expansion of livestock farming, driven by the global increase in milk and animal product consumption. Precision farming techniques, such as nitrogen fixation and weed management, have optimized alfalfa production, contributing to its popularity as a cover crop and green manure. The versatility of alfalfa extends to various processing techniques, including dehydration and cubing, which cater to diverse market needs.
Organic farming practices and food safety regulations further bolster the market's growth. Alfalfa's role in sustainable agriculture, erosion control, and soil health adds to its significance. Alfalfa meal, an alfalfa byproduct, is also utilized as a valuable source of crude protein and fiber in animal feed. Compliance with these regulations adds to the production costs, making Alfalfa farming less profitable for some farmers.
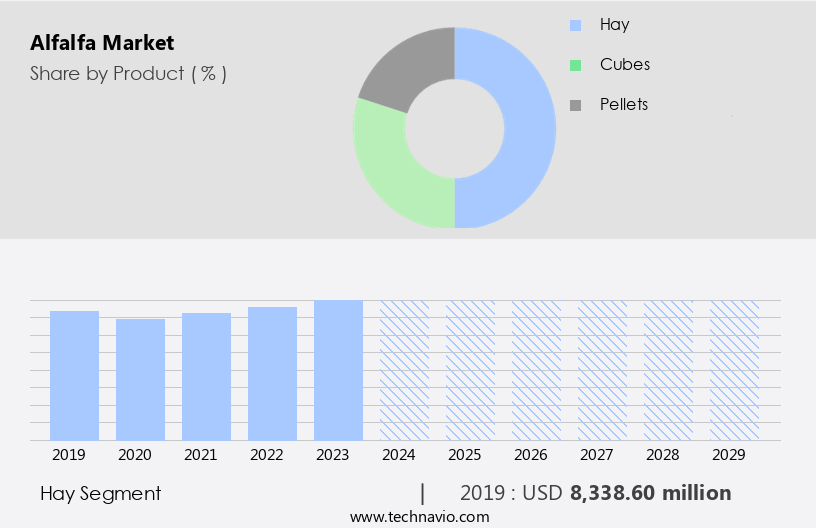
The Hay segment was valued at USD 8.34 billion in 2019 and showed a gradual increase during the forecast period.
Regional Analysis
North America is estimated to contribute 47% to the growth of the global market during the forecast period. Technavio's analysts have elaborately explained the regional trends and drivers that shape the market during the forecast period.
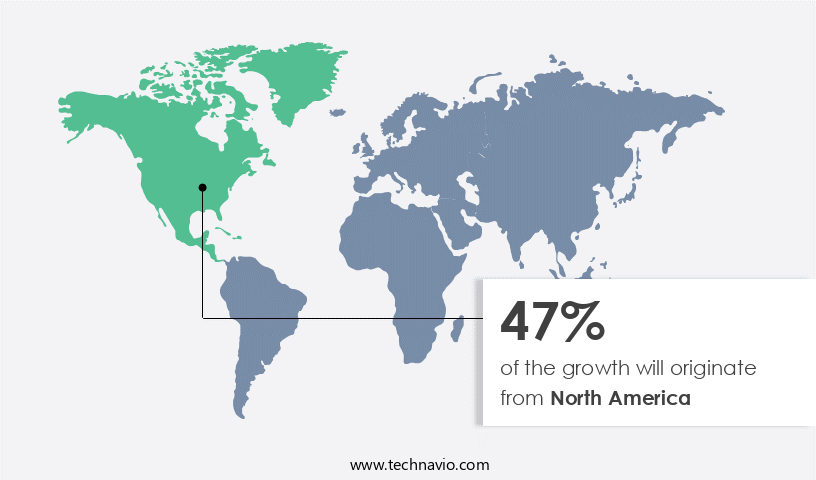
Alfalfa, a leguminous cover crop, is extensively cultivated in North America for various agricultural applications. In the US, particularly in the Western regions, alfalfa occupies approximately 20% of the cropland. The livestock industry's reliance on high-quality alfalfa as a primary feed source for dairy and beef cattle contributes significantly to the market's growth. Alfalfa hay, a significant crop derived from alfalfa, is in high demand due to its superior nutritional profile. Processing techniques for alfalfa include dehydration and pelletization to create alfalfa meal, cubes, and pellets. Weed control and green manure practices are essential for optimal alfalfa growth. The crop's high protein content makes it an essential component of feed formulation for ruminants, such as cattle, and monogastric animals, like pigs and poultry.
Proper storage methods ensure the maintenance of forage quality. Nitrogen fixation through symbiotic relationships with rhizobia bacteria is a sustainable agriculture practice that enhances alfalfa's nutritional value. Vitamin K, A, and E, as well as essential amino acids, contribute to the nutrient-rich profile of alfalfa. Soil health is improved through the addition of alfalfa residues. Quality control measures ensure food safety for human consumption of alfalfa sprouts. Disease management, fiber content, and disease resistance are crucial factors in maintaining alfalfa's forage quality. Mineral content and pest management are essential for optimal crop growth. Precision farming techniques and crop rotation contribute to yield optimization.
Animal feed applications, including erosion control, and the production of alfalfa seed further expand the market's scope. Alfalfa's crude protein content makes it an essential component of livestock feed. The increasing population and demand for milk products across North America continue to drive the market's growth.
Market Dynamics
Our researchers analyzed the data with 2024 as the base year, along with the key drivers, trends, and challenges. A holistic analysis of drivers will help companies refine their marketing strategies to gain a competitive advantage.
What are the Alfalfa market drivers leading to the rise in the adoption of Industry?
- The increasing population of cattle in farms significantly drives the market demand. Alfalfa, a legume known for its ability to fix nitrogen from the atmosphere, plays a significant role in sustainable agriculture, particularly for beef and dairy cattle farming. This process enhances soil health and reduces the need for synthetic fertilizers. In the US, the USDA reports that as of January 2024, there are approximately 9.36 million dairy cows, and the demand for milk and dairy products continues to grow. Similarly, in India, the cattle population is projected to reach 307.6 million by the end of 2024, driven by factors such as economic revival, changing dietary preferences, and urbanization.
- Quality control measures ensure the production of safe and nutritious alfalfa products for both human consumption and livestock feed. The consumption of alfalfa hay, maize, hay, soybeans, and other feed crops continues to grow as farmers seek to optimize their livestock production.
What are the Alfalfa market trends shaping the Industry?
- The trend in the agricultural market is shifting towards an increased demand for forage crops. This demand is driven by various factors, including the growing need for animal nutrition and the expansion of the dairy and livestock industries. Alfalfa, a popular forage crop, is widely traded on international markets due to its high nutritional value and demand from the dairy industry. Over the past two decades, global trade in alfalfa hay and dehydrated alfalfa has significantly increased, surpassing its status as a minor export crop.
- Alfalfa's fiber content, disease resistance, and mineral content, including vitamin E, make it an essential feed source for livestock. Effective disease management, weed management, and pest control are crucial for maintaining high-quality alfalfa crops. The ash content in alfalfa further enhances its nutritional value, making it a preferred choice for livestock producers worldwide. The international hay trade has approximately doubled in the past 16 years, expanding at an average annual rate of around 266,000 MT. Key markets include Asia, primarily Japan, China, and Korea, where the rapid expansion of modern dairy farms drives demand. Middle Eastern countries, such as Saudi Arabia and the UAE, also contribute to the market due to their limited water resources for local agriculture.
How does Alfalfa market face challenges during its growth?
- The stringent regulations pose a significant challenge to the industry's growth, requiring companies to adhere to rigorous compliance measures in order to operate effectively. The market faces regulatory challenges due to stringent regulations imposed by bodies such as the USDA and those in Europe and Southeast Asia. These regulations ensure the safe use of alfalfa in feedstocks, with organic alfalfa production adhering to specific standards. For instance, the National Organic Program (NOP) requires organic alfalfa to be grown, labeled, and marketed according to defined standards, which include the use of approved inputs like non-synthetic biological materials and a limited number of synthetic materials.
- Alfalfa's role in precision farming, yield optimization through crop rotation, and its use as animal feed and erosion control make it a crucial component in agriculture. Alfalfa extracts and pellets contribute to improving moisture content and crude protein levels in animal feed. Despite regulatory hurdles, the market's potential lies in its applications in the agriculture and animal feed industries.
Exclusive Customer Landscape
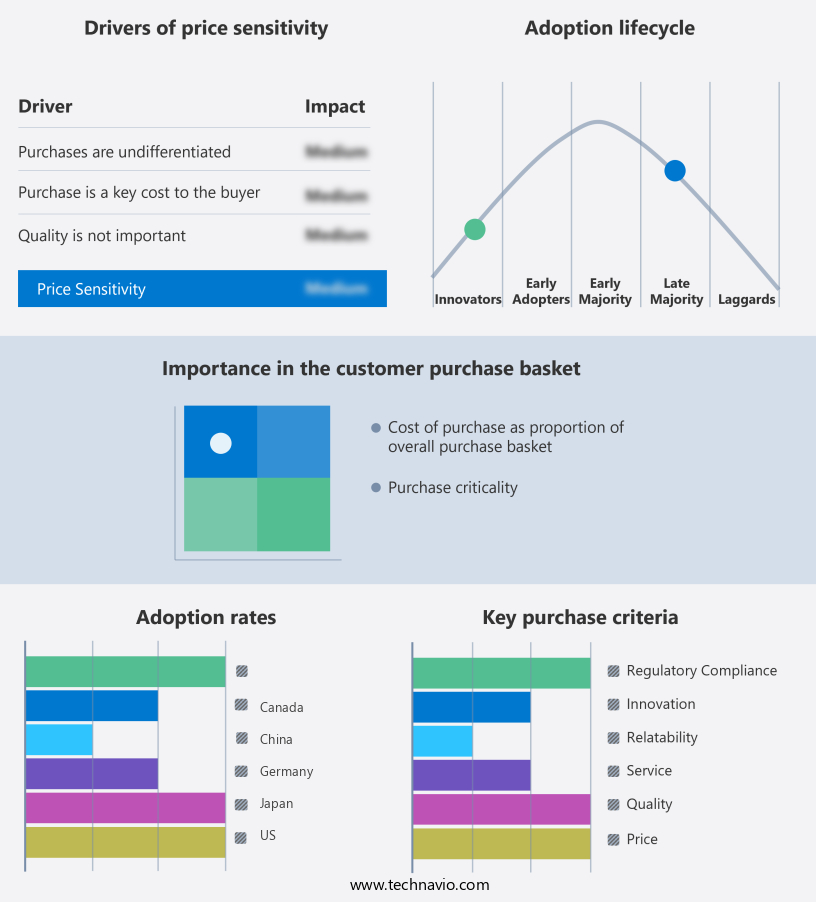
The alfalfa market forecasting report includes the adoption lifecycle of the market, covering from the innovator's stage to the laggard's stage. It focuses on adoption rates in different regions based on penetration. Furthermore, the alfalfa market report also includes key purchase criteria and drivers of price sensitivity to help companies evaluate and develop their market growth analysis strategies.
Customer Landscape
Key Companies & Market Insights
Companies are implementing various strategies, such as strategic alliances, alfalfa market forecast, partnerships, mergers and acquisitions, geographical expansion, and product/service launches, to enhance their presence in the industry.
Accomazzo Co. - The company specializes in producing and supplying alfalfa hay in pellet and bale forms, utilizing advanced agricultural techniques to ensure optimal nutrient content and consistency.
The industry research and growth report includes detailed analyses of the competitive landscape of the market and information about key companies, including:
- Accomazzo Co.
- Al Dahra ACX Inc.
- Alfalfa Monegros S.L.
- Anderson Hay and Grain Co. Inc.
- Barr AG Ltd.
- Border Valley Trading
- Cubeit Hay
- Green Prairie International Inc.
- Gruppo Carli
- Hay USA Inc.
- Haykingdom Inc.
- M and C Hay
- Mitsubishi Corp.
- MULTIFEEDS
- Nafosa
- Oxbow Animal Health
- S and W Seed Co.
- SL Follen Co.
- Standlee Premium Products LLC
Qualitative and quantitative analysis of companies has been conducted to help clients understand the wider business environment as well as the strengths and weaknesses of key industry players. Data is qualitatively analyzed to categorize companies as pure play, category-focused, industry-focused, and diversified; it is quantitatively analyzed to categorize companies as dominant, leading, strong, tentative, and weak.
Recent Development and News in Alfalfa Market
- In January 2024, ForageGen, a leading alfalfa seed producer, announced the launch of a new alfalfa variety, Alfalfa Xtra, engineered for enhanced nutritional content and drought resistance (ForageGen Press Release).
- In March 2024, Monsanto and DuPont Pioneer, two major agribusiness players, entered into a strategic collaboration to co-develop and commercialize genetically modified alfalfa varieties, combining their respective research and development capabilities (Reuters).
- In April 2025, BrightFarms, a hydroponic produce company, completed a USD 100 million funding round to expand its alfalfa production capacity and enter new markets, with a focus on supplying fresh, locally grown alfalfa to grocery chains (Bloomberg).
- In May 2025, the European Commission approved the cultivation of genetically modified alfalfa in the European Union, marking a significant policy shift that could boost the region's alfalfa production and competitiveness (European Commission Press Release).
Research Analyst Overview
Alfalfa, a perennial legume, continues to be a dynamic force in various sectors due to its versatility and nutritional value. Alfalfa hay and dehydrated alfalfa are essential components in animal feed, providing crucial fiber content, disease resistance, and vitamin E for beef and dairy cattle. Disease management and pest control are ongoing concerns in alfalfa production, with research focusing on developing disease-resistant varieties and effective pest management strategies. Fiber content and vitamin E are vital for maintaining optimal animal health, while mineral content and ash content contribute to overall nutritional value. Weed management and pest control are integral parts of alfalfa cultivation, with precision farming techniques and crop rotation playing a significant role in yield optimization.
Processing techniques, such as dehydration and pelletizing, extend the applications of alfalfa beyond animal feed. Alfalfa meal is used as a soil amendment, while alfalfa cubes and alfalfa extracts serve as valuable ingredients in organic farming and sustainable agriculture. Food safety and quality control are paramount in the market, with vitamin A and amino acid profile being essential nutrients for human consumption in alfalfa sprouts. Nitrogen fixation and soil health are crucial aspects of alfalfa's role in sustainable agriculture. Moisture content and storage methods are essential factors in maintaining alfalfa's quality and value. Ongoing research and innovation continue to unfold in the market, with a focus on improving forage quality, fiber content, disease resistance, and animal feed efficiency.
The Alfalfa Market is expanding, driven by demand for high-protein feed solutions like alfalfa pellets, which offer convenience, extended shelf life, and consistent nutrition. These pellets play a crucial role in optimizing dry matter intake among livestock, helping improve digestion and productivity in dairy and beef operations. Modern harvesting techniques such as precision cutting, optimal drying, and baling technology are enhancing crop quality and preserving nutrient content.
The Alfalfa Market is evolving, driven by strategic alfalfa marketing and advances in alfalfa genetics that enhance yield and resilience. Challenges such as alfalfa diseases, alfalfa pests, alfalfa insects, and alfalfa weeds continue to impact production, prompting ongoing alfalfa research. Understanding alfalfa economics and navigating alfalfa regulations are crucial for market players across the alfalfa supply chain. Rising alfalfa demand influences alfalfa prices, while global interest in alfalfa sustainability fuels innovation. Emerging alfalfa technology and alfalfa innovation are streamlining cultivation and distribution. Robust alfalfa market analysis provides actionable insights, helping stakeholders adapt to trends and capitalize on growth opportunities.
Dive into Technavio's robust research methodology, blending expert interviews, extensive data synthesis, and validated models for unparalleled Alfalfa Market insights. See full methodology.
|
Market Scope |
|
|
Report Coverage |
Details |
|
Page number |
206 |
|
Base year |
2024 |
|
Historic period |
2019-2023 |
|
Forecast period |
2025-2029 |
|
Growth momentum & CAGR |
Accelerate at a CAGR of 6.4% |
|
Market growth 2025-2029 |
USD 8.22 billion |
|
Market structure |
Fragmented |
|
YoY growth 2024-2025(%) |
6.0 |
|
Key countries |
US, Canada, China, India, Australia, Mexico, France, Japan, Brazil, and Germany |
|
Competitive landscape |
Leading Companies, Market Positioning of Companies, Competitive Strategies, and Industry Risks |
What are the Key Data Covered in this Alfalfa Market Research and Growth Report?
- CAGR of the Alfalfa industry during the forecast period
- Detailed information on factors that will drive the growth and forecasting between 2025 and 2029
- Precise estimation of the size of the market and its contribution of the industry in focus to the parent market
- Accurate predictions about upcoming growth and trends and changes in consumer behaviour
- Growth of the market across North America, APAC, Europe, South America, and Middle East and Africa
- Thorough analysis of the market's competitive landscape and detailed information about companies
- Comprehensive analysis of factors that will challenge the alfalfa market growth of industry companies
We can help! Our analysts can customize this alfalfa market research report to meet your requirements.
 RIA -
RIA - 
