Aloe Vera Juice Market Analysis, Size, and Forecast 2024-2028: North America (Canada and Mexico), Europe (France, Germany, and UK), Middle East and Africa (UAE), APAC (China, India, Indonesia, Japan, Malaysia, South Korea, and Thailand), South America (Brazil), and Rest of World (ROW)

Aloe Vera Juice Market Analysis, Size, and Forecast 2024-2028:
North America (Canada and Mexico), Europe (France, Germany, and UK), Middle East and Africa (UAE), APAC (China, India, Indonesia, Japan, Malaysia, South Korea, and Thailand), South America (Brazil), and Rest of World (ROW)

Published: Jul 2024 130 Pages SKU: IRTNTR74388

Market Overview at a Glance

$768.1 Mn
Market Opportunity
11.64%
CAGR
10.11
YoY growth 2023-2024(%)

Aloe Vera Juice Market Size 2024-2028

The aloe vera juice market size is forecast to increase by USD 768.1 million, at a CAGR of 11.64% between 2023 and 2028.

  • The market is witnessing significant growth, driven by the increasing number of organized retail outlets. These retail channels provide easy accessibility and convenience to consumers, thereby fueling the demand for Aloe Vera juice. Another key trend shaping the market is the adoption of innovative and sustainable food packaging solutions. Producers are focusing on eco-friendly and recyclable packaging to cater to the growing consumer preference for environmentally friendly products. However, the market faces challenges due to stringent regulations on the production and labeling of Aloe Vera juice.
  • Compliance with these regulations can add to the production costs, potentially impacting the competitiveness of market players. Companies seeking to capitalize on market opportunities should focus on adhering to regulatory requirements and offering innovative, sustainable packaging solutions to meet evolving consumer preferences. Additionally, strategic partnerships and collaborations with retailers can help expand market reach and increase brand visibility.

What will be the Size of the Aloe Vera Juice Market during the forecast period?

Aloe Vera Juice Market Size

Explore in-depth regional segment analysis with market size data - historical 2018-2022 and forecasts 2024-2028 - in the full report.  
Request Free Sample

The dynamic the market continues to evolve, driven by the diverse applications of this versatile plant across various sectors. Aloe vera, renowned for its natural ingredients and amino acids, is increasingly sought after in skincare products for its ability to enhance skin hydration and promote elastin synthesis. In the realm of health and wellness, aloe vera gel finds its place as a functional food ingredient, contributing to digestive health and immune system support. The supply chain management of aloe vera juice is a critical aspect of the market, with a focus on maintaining quality control through leaf processing techniques such as outer leaf fillet extraction and aseptic processing.

These methods ensure the preservation of the antioxidant properties and antimicrobial benefits of the aloe vera plant. Retail channels have played a significant role in the market's growth, with an increasing number of supermarkets and health food stores stocking aloe vera juice and related products. Consumer perception continues to shift towards natural ingredients, driving demand for organic aloe vera and cold-pressed juice. The market's unfolding patterns extend to the pharmaceutical industry, where aloe vera concentrate and extracts are used in herbal remedies and cosmeceutical ingredients for wound healing and skin regeneration. The potential for product differentiation through pricing strategies and brand positioning is significant, as companies explore new applications for aloe vera in areas such as hair care and collagen synthesis.

The evolving nature of the market is further highlighted by the development of new technologies, such as gel stabilization and aloe vera powder production, which enhance the product's shelf life and functionality. The market's continuous dynamism underscores the potential for ongoing innovation and growth in this sector.

How is this Aloe Vera Juice Industry segmented?

The aloe vera juice industry research report provides comprehensive data (region-wise segment analysis), with forecasts and estimates in "USD million" for the period 2024-2028, as well as historical data from 2018-2022 for the following segments.

  • Distribution Channel
    • Offline
    • Online
  • Application
    • Beverages
    • Nutraceuticals
    • Cosmetics
    • Pharmaceuticals
  • Consumer Segment
    • Health-Conscious Consumers
    • General Consumers
    • Fitness Enthusiasts
  • Geography
    • North America
      • US
      • Canada
      • Mexico
    • Europe
      • France
      • Germany
      • UK
    • Middle East and Africa
      • UAE
    • APAC
      • China
      • India
      • Indonesia
      • Japan
      • Malaysia
      • South Korea
      • Thailand
    • South America
      • Brazil
    • Rest of World (ROW)

By Distribution Channel Insights

The offline segment is estimated to witness significant growth during the forecast period.

The market is characterized by the dominance of the offline distribution channel, which includes brick-and-mortar outlets such as hypermarkets, supermarkets, grocery stores, and convenience stores. In 2023, this segment accounted for the largest market share. Organized retail, which includes hypermarkets and supermarkets, offers consumers ease of purchase and a wide range of options. Major players in this sector, like Tesco Plc (Tesco), Carrefour Group, and Target Brands Corp. (Target), offer various brands of aloe vera juice worldwide. Aloe vera juice is prized for its antioxidant properties, making it a popular choice for health and wellness enthusiasts. Its anti-inflammatory properties make it a valuable ingredient in hair care and skincare products.

Aloe vera gel, derived from the leaf fillet through fillet extraction and aseptic processing, is used in various applications, including beverages, dietary supplements, and functional foods. Quality control is crucial in the production of aloe vera juice, as it involves leaf processing, gel stabilization, and extract concentration. Natural ingredients, such as amino acids and elastin synthesis, contribute to the product's health benefits. The market also includes conventional aloe vera, organic aloe vera, and aloe vera pharmaceuticals. The market's growth is driven by consumer perception, with an increasing focus on natural ingredients and immune system support. The market also caters to the demand for sunburn relief, digestive health, and collagen synthesis.

Cold-pressed juice and cosmeceutical ingredients are emerging trends. Product differentiation is essential in the market, with various brands offering unique selling propositions. Distribution networks play a crucial role in reaching consumers, with e-commerce platforms and traditional retail channels coexisting. Storage conditions and shelf life are critical factors in maintaining product quality. In conclusion, the market is a dynamic and evolving industry, driven by consumer demand for natural ingredients and health benefits. The market's growth is underpinned by various trends, including the increasing popularity of functional foods, natural ingredients, and cosmeceuticals. The market's future looks promising, with opportunities for innovation and product differentiation.

Aloe Vera Juice Market Size

Request Free Sample

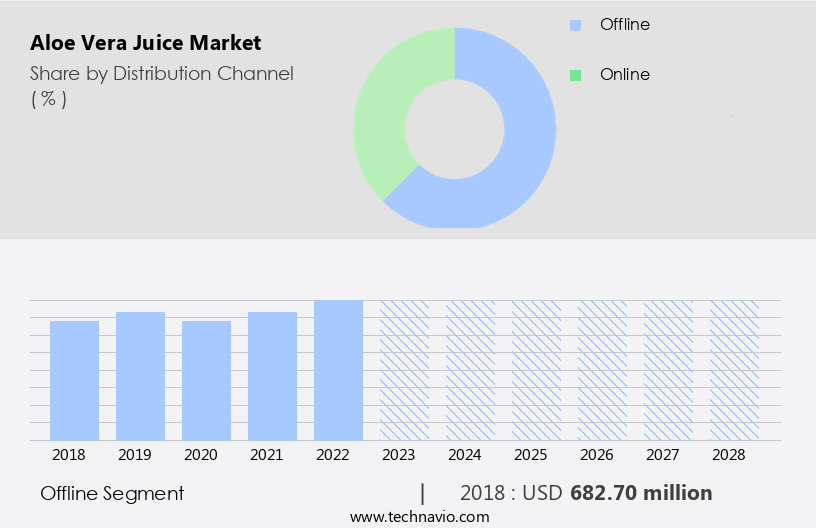
The Offline segment was valued at USD 682.70 million in 2018 and showed a gradual increase during the forecast period.

Regional Analysis

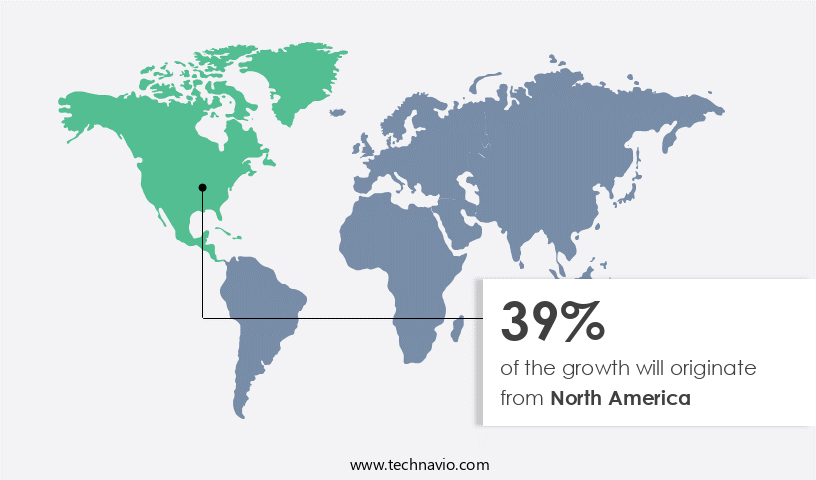
North America is estimated to contribute 39% to the growth of the global market during the forecast period.Technavio's analysts have elaborately explained the regional trends and drivers that shape the market during the forecast period.

Aloe Vera Juice Market Share by Geography

 Request Free Sample

Market Dynamics

Our researchers analyzed the data with 2023 as the base year, along with the key drivers, trends, and challenges. A holistic analysis of drivers will help companies refine their marketing strategies to gain a competitive advantage.

B2B aloe beverage solutions utilize natural extraction technologies for wellness benefits. Aloe vera juice opportunities 2024 include aloe drinks for health stores and organic aloe beverages, meeting consumer needs. Aloe supply chain tools enhance distribution, while aloe vera competitive insights highlight key suppliers. Sustainable aloe farming supports eco-friendly beverage trends. Aloe vera regulatory standards 2024-2028 shape aloe juice demand in Asia-Pacific 2024. Premium aloe juice products and aloe market forecasts drive adoption. Aloe beverages for retail and custom aloe formulations target niches. Aloe juice market barriers and strategies address taste challenges, with aloe sourcing innovations and aloe cost efficiency boosting margins. Aloe market intelligence and functional beverage advancements fuel expansion.

What are the key market drivers leading to the rise in the adoption of Aloe Vera Juice Industry?

  • The expanding presence of well-organized retail outlets serves as the primary catalyst for market growth. 
  • The market has experienced significant growth due to the increasing penetration of organized retailing in major countries such as the US and India. Supermarkets, hypermarkets, convenience stores, and discount stores have emerged as key distribution and marketing channels for aloe vera juice. The rise in urbanization in regions like APAC and South America has led to an increase in the number of organized retailing outlets in these areas, further boosting market growth. In the US alone, the number of supermarkets grew by 6% between 2018 and 2021.
  • Some major countries with a high degree of organized retailing penetration include Brazil, the UK, Germany, Italy, Spain, China, Canada, France, Australia, and Japan. This trend is beneficial for companies operating in the market.

What are the market trends shaping the Aloe Vera Juice Industry?

  • The increasing preference for innovative and sustainable packaging solutions is a notable trend in the current market. This shift towards eco-friendly and technologically advanced packaging is mandatory for businesses seeking to stay competitive.
  • The market has experienced significant growth due to increasing consumer awareness about the health benefits of this natural beverage. The outer leaf fillet is extracted through fillet processing, ensuring the highest quality of the gel. Aloe Vera juice is known for its antioxidant properties, making it an excellent ingredient for various health and wellness products, including dietary supplements and hair care items. companies are focusing on aseptic processing to maintain the juice's quality and freshness. This method ensures that the juice is free from contamination and preserves its nutritional value. Moreover, the juice's anti-inflammatory properties make it a popular ingredient in beverage formulations.
  • To attract consumers, companies are implementing pricing strategies that cater to various market segments. They are also emphasizing quality control measures to meet consumer expectations and maintain brand reputation. Innovative packaging solutions are essential in the market, as they not only protect the juice but also enhance its appeal to consumers. Eco-friendly and recyclable packaging options are gaining popularity due to growing concerns about sustainability. In conclusion, the market is driven by increasing consumer demand for natural and healthy beverage options. companies are focusing on product innovation, quality, and sustainable packaging to meet consumer preferences and stay competitive.

What challenges does the Aloe Vera Juice Industry face during its growth?

  • The strict regulations imposed on the production and marketing of aloe vera juice represent a significant challenge to the industry's growth. In order to comply with these stringent rules, companies must invest heavily in research and development, as well as adhere to rigorous quality control measures. This not only increases production costs but also limits the industry's ability to scale up and reach larger markets. Therefore, finding ways to navigate these regulations while maintaining product quality and consumer trust is essential for the continued growth and success of the aloe vera juice industry. 
  • Aloe Vera juice, derived from the succulent aloe vera plant, is a popular natural beverage and functional food recognized for its numerous health benefits. The market for this product is driven by consumer demand for natural ingredients and functional foods. Aloe Vera juice contains essential amino acids, antioxidants, and minerals, making it an excellent addition to a healthy diet. The production and supply chain management of Aloe Vera juice involve careful handling of the plant to ensure the highest quality gel. Retail channels, including supermarkets and health food stores, are the primary outlets for this product.
  • Proper storage conditions are crucial to preserve its nutritional value and antimicrobial properties. Regulations play a significant role in the production and marketing of Aloe Vera juice. In the US, the USDA enforces guidelines for product description, packaging, and labeling. The European Union (EU) has similar regulations, such as Council Directive 2001/112/EC, which sets standards for production, composition, and labeling of fruit juices and similar products. The skincare industry also utilizes Aloe Vera gel as a key ingredient due to its ability to promote elastin synthesis and improve skin hydration. As a result, Aloe Vera juice finds applications in both food and cosmetic industries.
  • In conclusion, the market is fueled by consumer perception, health benefits, and regulatory compliance. Proper supply chain management and storage conditions are essential to maintain the product's quality and meet consumer expectations.

Exclusive Customer Landscape

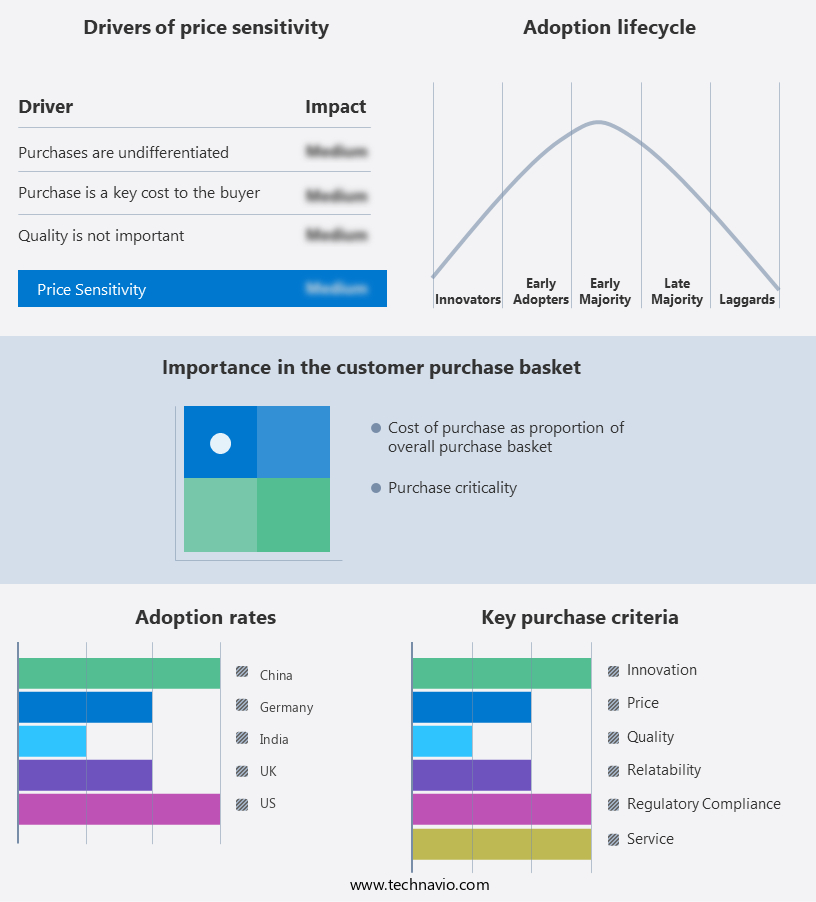
The aloe vera juice market forecasting report includes the adoption lifecycle of the market, covering from the innovator's stage to the laggard's stage. It focuses on adoption rates in different regions based on penetration. Furthermore, the aloe vera juice market report also includes key purchase criteria and drivers of price sensitivity to help companies evaluate and develop their market growth analysis strategies.

Aloe Vera Juice Market Share by Geography

 Customer Landscape

Key Companies & Market Insights

Companies are implementing various strategies, such as strategic alliances, aloe vera juice market forecast, partnerships, mergers and acquisitions, geographical expansion, and product/service launches, to enhance their presence in the industry.

ALO Drinks - The company specializes in producing high-quality aloe vera juice, including the popular Alo Original product. This beverage offers numerous health benefits, making it a top choice for consumers seeking natural and effective hydration solutions. With a commitment to purity and sustainability, the company's aloe vera juice undergoes rigorous testing to ensure the highest standards of quality and consistency.

The industry research and growth report includes detailed analyses of the competitive landscape of the market and information about key companies, including:

  • ALO Drinks
  • Aloe Drink For Life
  • Aloe Farms Inc.
  • AlterFood
  • Atlantia Aloe
  • ESI srl
  • Forever Living Products International LLC
  • Fruit of the Earth
  • GraceKennedy Ltd.
  • Keumkang B and F Co. Ltd.
  • Lily of the Desert
  • OKF Co.
  • Patanjali Ayurved Ltd.
  • RITA Food and Drink Co. Ltd.
  • Savia
  • Simplee
  • Suja Life LLC
  • Tulip International Inc.
  • Vitamin Well Group

Qualitative and quantitative analysis of companies has been conducted to help clients understand the wider business environment as well as the strengths and weaknesses of key industry players. Data is qualitatively analyzed to categorize companies as pure play, category-focused, industry-focused, and diversified; it is quantitatively analyzed to categorize companies as dominant, leading, strong, tentative, and weak.

Recent Development and News in Aloe Vera Juice Market

  • In January 2024, PepsiCo's Quaker Oats division announced the launch of a new line of Aloe Vera flavored oatmeal, incorporating the health benefits of Aloe Vera into their popular breakfast product (Quaker Press Release). This strategic move aimed to cater to the growing consumer trend towards functional foods and beverages.
  • In March 2024, Herbalife Nutrition, a leading nutrition company, entered into a partnership with a major South Korean retailer, Emart, to expand its distribution network in the Asian market (Herbalife Nutrition Press Release). This collaboration marked a significant geographic expansion for the company, increasing its reach and market share in the region.
  • In May 2024, Aloe Gloe, a leading Aloe Vera juice brand, secured a strategic investment of USD15 million from a prominent venture capital firm, Signia Venture Partners (VentureBeat). The funding would be used to accelerate product innovation, marketing efforts, and geographic expansion.
  • In April 2025, the European Food Safety Authority (EFSA) approved the health claim for Aloe Vera's role in maintaining normal bowel function (EFSA Press Release). This regulatory approval opened the door for Aloe Vera juice manufacturers to make this claim on their product labels in the European Union, potentially driving growth within the region.

Research Analyst Overview

  • Aloe Vera juice, a popular health beverage, experiences dynamic market activity driven by various factors. Retail partnerships expand distribution channels, enabling wider reach for consumers. Tax regulations and import/export restrictions impact production capacity and pricing strategies. Intellectual property protection through patent filings and licensing agreements ensure brand awareness and product innovation. Harvesting methods and cultivation techniques influence product formulations and efficacy testing. Safety and toxicity testing are crucial for regulatory affairs, while marketing communications engage customer loyalty. Sales promotion and packaging design attract consumers, and distribution channels include wholesale and direct sales. Joint ventures and manufacturing processes optimize production capacity, while raw material supply and ingredient sourcing ensure quality.
  • Clinical trials and efficacy testing validate product benefits, and sustainability practices enhance brand reputation. Pricing strategies balance affordability and profitability, and patent protection safeguards formulation development. Distribution channels, customs duties, and export regulations shape international trade, and ingredient sourcing and raw material supply influence formulation development. Regulatory affairs and safety testing ensure compliance, and product innovation drives market growth.

Dive into Technavio's robust research methodology, blending expert interviews, extensive data synthesis, and validated models for unparalleled Aloe Vera Juice Market insights. See full methodology.

Market Scope

Report Coverage

Details

Page number

130

Base year

2023

Historic period

2018-2022

Forecast period

2024-2028

Growth momentum & CAGR

Accelerate at a CAGR of 11.64%

Market growth 2024-2028

USD 768.1 million

Market structure

Fragmented

YoY growth 2023-2024(%)

10.11

Key countries

US, China, Germany, UK, and India

Competitive landscape

Leading Companies, Market Positioning of Companies, Competitive Strategies, and Industry Risks

Request Free Sample

What are the Key Data Covered in this Aloe Vera Juice Market Research and Growth Report?

  • CAGR of the Aloe Vera Juice industry during the forecast period
  • Detailed information on factors that will drive the growth and forecasting between 2024 and 2028
  • Precise estimation of the size of the market and its contribution of the industry in focus to the parent market
  • Accurate predictions about upcoming growth and trends and changes in consumer behaviour
  • Growth of the market across North America, Europe, APAC, Middle East and Africa, and South America
  • Thorough analysis of the market's competitive landscape and detailed information about companies
  • Comprehensive analysis of factors that will challenge the aloe vera juice market growth of industry companies

We can help! Our analysts can customize this aloe vera juice market research report to meet your requirements.

Get in touch

1 Executive Summary

  • 1.1 Market overview
    • Executive Summary - Chart on Market Overview
    • Executive Summary - Data Table on Market Overview
    • Executive Summary - Chart on Global Market Characteristics
    • Executive Summary - Chart on Market by Geography
    • Executive Summary - Chart on Market Segmentation by Distribution Channel
    • Executive Summary - Chart on Incremental Growth
    • Executive Summary - Data Table on Incremental Growth
    • Executive Summary - Chart on Company Market Positioning

2 Market Landscape

  • 2.1 Market ecosystem
    • Parent Market
    • Data Table on - Parent Market
  • 2.2 Market characteristics
    • Market characteristics analysis
  • 2.3 Value chain analysis
    • Value Chain Analysis

3 Market Sizing

  • 3.1 Market definition
    • Offerings of companies included in the market definition
  • 3.2 Market segment analysis
    • Market segments
  • 3.3 Market size 2023
    • 3.4 Market outlook: Forecast for 2023-2028
      • Chart on Global - Market size and forecast 2023-2028 ($ million)
      • Data Table on Global - Market size and forecast 2023-2028 ($ million)
      • Chart on Global Market: Year-over-year growth 2023-2028 (%)
      • Data Table on Global Market: Year-over-year growth 2023-2028 (%)

    4 Historic Market Size

    • 4.1 Global Aloe Vera Juice Market 2018 - 2022
      • Historic Market Size - Data Table on Global Aloe Vera Juice Market 2018 - 2022 ($ million)
    • 4.2 Distribution Channel segment analysis 2018 - 2022
      • Historic Market Size - Distribution Channel Segment 2018 - 2022 ($ million)
    • 4.3 Geography segment analysis 2018 - 2022
      • Historic Market Size - Geography Segment 2018 - 2022 ($ million)
    • 4.4 Country segment analysis 2018 - 2022
      • Historic Market Size - Country Segment 2018 - 2022 ($ million)

    5 Five Forces Analysis

    • 5.1 Five forces summary
      • Five forces analysis - Comparison between 2023 and 2028
    • 5.2 Bargaining power of buyers
      • Bargaining power of buyers - Impact of key factors 2023 and 2028
    • 5.3 Bargaining power of suppliers
      • Bargaining power of suppliers - Impact of key factors in 2023 and 2028
    • 5.4 Threat of new entrants
      • Threat of new entrants - Impact of key factors in 2023 and 2028
    • 5.5 Threat of substitutes
      • Threat of substitutes - Impact of key factors in 2023 and 2028
    • 5.6 Threat of rivalry
      • Threat of rivalry - Impact of key factors in 2023 and 2028
    • 5.7 Market condition
      • Chart on Market condition - Five forces 2023 and 2028

    6 Market Segmentation by Distribution Channel

    • 6.1 Market segments
      • Chart on Distribution Channel - Market share (2023-2028) (%)
      • Data Table on Distribution Channel - Market share (2023-2028) (%)
    • 6.2 Comparison by Distribution Channel
      • Chart on Comparison by Distribution Channel
      • Data Table on Comparison by Distribution Channel
    • 6.3 Offline - Market size and forecast (2023-2028)
      • Chart on Offline - Market size and forecast (2023-2028) ($ million)
      • Data Table on Offline - Market size and forecast (2023-2028) ($ million)
      • Chart on Offline - Year-over-year growth (2023-2028) (%)
      • Data Table on Offline - Year-over-year growth (2023-2028) (%)
    • 6.4 Online - Market size and forecast (2023-2028)
      • Chart on Online - Market size and forecast (2023-2028) ($ million)
      • Data Table on Online - Market size and forecast (2023-2028) ($ million)
      • Chart on Online - Year-over-year growth (2023-2028) (%)
      • Data Table on Online - Year-over-year growth (2023-2028) (%)
    • 6.5 Market opportunity by Distribution Channel
      • Market opportunity by Distribution Channel ($ million)
      • Data Table on Market opportunity by Distribution Channel ($ million)

    7 Market Segmentation by Application

    • 7.1 Market segments
      • Chart on Application - Market share (2023-2028) (%)
      • Data Table on Application - Market share (2023-2028) (%)
    • 7.2 Comparison by Application
      • Chart on Comparison by Application
      • Data Table on Comparison by Application
    • 7.3 Beverages - Market size and forecast (2023-2028)
      • Chart on Beverages - Market size and forecast (2023-2028) ($ million)
      • Data Table on Beverages - Market size and forecast (2023-2028) ($ million)
      • Chart on Beverages - Year-over-year growth (2023-2028) (%)
      • Data Table on Beverages - Year-over-year growth (2023-2028) (%)
    • 7.4 Nutraceuticals - Market size and forecast (2023-2028)
      • Chart on Nutraceuticals - Market size and forecast (2023-2028) ($ million)
      • Data Table on Nutraceuticals - Market size and forecast (2023-2028) ($ million)
      • Chart on Nutraceuticals - Year-over-year growth (2023-2028) (%)
      • Data Table on Nutraceuticals - Year-over-year growth (2023-2028) (%)
    • 7.5 Cosmetics - Market size and forecast (2023-2028)
      • Chart on Cosmetics - Market size and forecast (2023-2028) ($ million)
      • Data Table on Cosmetics - Market size and forecast (2023-2028) ($ million)
      • Chart on Cosmetics - Year-over-year growth (2023-2028) (%)
      • Data Table on Cosmetics - Year-over-year growth (2023-2028) (%)
    • 7.6 Pharmaceuticals - Market size and forecast (2023-2028)
      • Chart on Pharmaceuticals - Market size and forecast (2023-2028) ($ million)
      • Data Table on Pharmaceuticals - Market size and forecast (2023-2028) ($ million)
      • Chart on Pharmaceuticals - Year-over-year growth (2023-2028) (%)
      • Data Table on Pharmaceuticals - Year-over-year growth (2023-2028) (%)
    • 7.7 Market opportunity by Application
      • Market opportunity by Application ($ million)
      • Data Table on Market opportunity by Application ($ million)

    8 Market Segmentation by Consumer Segment

    • 8.1 Market segments
      • Chart on Consumer Segment - Market share (2023-2028) (%)
      • Data Table on Consumer Segment - Market share (2023-2028) (%)
    • 8.2 Comparison by Consumer Segment
      • Chart on Comparison by Consumer Segment
      • Data Table on Comparison by Consumer Segment
    • 8.3 Health-Conscious Consumers - Market size and forecast (2023-2028)
      • Chart on Health-Conscious Consumers - Market size and forecast (2023-2028) ($ million)
      • Data Table on Health-Conscious Consumers - Market size and forecast (2023-2028) ($ million)
      • Chart on Health-Conscious Consumers - Year-over-year growth (2023-2028) (%)
      • Data Table on Health-Conscious Consumers - Year-over-year growth (2023-2028) (%)
    • 8.4 General Consumers - Market size and forecast (2023-2028)
      • Chart on General Consumers - Market size and forecast (2023-2028) ($ million)
      • Data Table on General Consumers - Market size and forecast (2023-2028) ($ million)
      • Chart on General Consumers - Year-over-year growth (2023-2028) (%)
      • Data Table on General Consumers - Year-over-year growth (2023-2028) (%)
    • 8.5 Fitness Enthusiasts - Market size and forecast (2023-2028)
      • Chart on Fitness Enthusiasts - Market size and forecast (2023-2028) ($ million)
      • Data Table on Fitness Enthusiasts - Market size and forecast (2023-2028) ($ million)
      • Chart on Fitness Enthusiasts - Year-over-year growth (2023-2028) (%)
      • Data Table on Fitness Enthusiasts - Year-over-year growth (2023-2028) (%)
    • 8.6 Market opportunity by Consumer Segment
      • Market opportunity by Consumer Segment ($ million)
      • Data Table on Market opportunity by Consumer Segment ($ million)

    9 Customer Landscape

    • 9.1 Customer landscape overview
      • Analysis of price sensitivity, lifecycle, customer purchase basket, adoption rates, and purchase criteria

    10 Geographic Landscape

    • 10.1 Geographic segmentation
      • Chart on Market share by geography 2023-2028 (%)
      • Data Table on Market share by geography 2023-2028 (%)
    • 10.2 Geographic comparison
      • Chart on Geographic comparison
      • Data Table on Geographic comparison
    • 10.3 North America - Market size and forecast 2023-2028
      • Chart on North America - Market size and forecast 2023-2028 ($ million)
      • Data Table on North America - Market size and forecast 2023-2028 ($ million)
      • Chart on North America - Year-over-year growth 2023-2028 (%)
      • Data Table on North America - Year-over-year growth 2023-2028 (%)
    • 10.4 Europe - Market size and forecast 2023-2028
      • Chart on Europe - Market size and forecast 2023-2028 ($ million)
      • Data Table on Europe - Market size and forecast 2023-2028 ($ million)
      • Chart on Europe - Year-over-year growth 2023-2028 (%)
      • Data Table on Europe - Year-over-year growth 2023-2028 (%)
    • 10.5 APAC - Market size and forecast 2023-2028
      • Chart on APAC - Market size and forecast 2023-2028 ($ million)
      • Data Table on APAC - Market size and forecast 2023-2028 ($ million)
      • Chart on APAC - Year-over-year growth 2023-2028 (%)
      • Data Table on APAC - Year-over-year growth 2023-2028 (%)
    • 10.6 Middle East and Africa - Market size and forecast 2023-2028
      • Chart on Middle East and Africa - Market size and forecast 2023-2028 ($ million)
      • Data Table on Middle East and Africa - Market size and forecast 2023-2028 ($ million)
      • Chart on Middle East and Africa - Year-over-year growth 2023-2028 (%)
      • Data Table on Middle East and Africa - Year-over-year growth 2023-2028 (%)
    • 10.7 South America - Market size and forecast 2023-2028
      • Chart on South America - Market size and forecast 2023-2028 ($ million)
      • Data Table on South America - Market size and forecast 2023-2028 ($ million)
      • Chart on South America - Year-over-year growth 2023-2028 (%)
      • Data Table on South America - Year-over-year growth 2023-2028 (%)
    • 10.8 US - Market size and forecast 2023-2028
      • Chart on US - Market size and forecast 2023-2028 ($ million)
      • Data Table on US - Market size and forecast 2023-2028 ($ million)
      • Chart on US - Year-over-year growth 2023-2028 (%)
      • Data Table on US - Year-over-year growth 2023-2028 (%)
    • 10.9 China - Market size and forecast 2023-2028
      • Chart on China - Market size and forecast 2023-2028 ($ million)
      • Data Table on China - Market size and forecast 2023-2028 ($ million)
      • Chart on China - Year-over-year growth 2023-2028 (%)
      • Data Table on China - Year-over-year growth 2023-2028 (%)
    • 10.10 Germany - Market size and forecast 2023-2028
      • Chart on Germany - Market size and forecast 2023-2028 ($ million)
      • Data Table on Germany - Market size and forecast 2023-2028 ($ million)
      • Chart on Germany - Year-over-year growth 2023-2028 (%)
      • Data Table on Germany - Year-over-year growth 2023-2028 (%)
    • 10.11 UK - Market size and forecast 2023-2028
      • Chart on UK - Market size and forecast 2023-2028 ($ million)
      • Data Table on UK - Market size and forecast 2023-2028 ($ million)
      • Chart on UK - Year-over-year growth 2023-2028 (%)
      • Data Table on UK - Year-over-year growth 2023-2028 (%)
    • 10.12 India - Market size and forecast 2023-2028
      • Chart on India - Market size and forecast 2023-2028 ($ million)
      • Data Table on India - Market size and forecast 2023-2028 ($ million)
      • Chart on India - Year-over-year growth 2023-2028 (%)
      • Data Table on India - Year-over-year growth 2023-2028 (%)
    • 10.13 Market opportunity by geography
      • Market opportunity by geography ($ million)
      • Data Tables on Market opportunity by geography ($ million)
    • 10.14 US - Market size and forecast (2023-2028)
      • Chart on US - Market size and forecast (2023-2028) ($ million)
      • Data Table on US - Market size and forecast (2023-2028) ($ million)
      • Chart on US - Year-over-year growth (2023-2028) (%)
      • Data Table on US - Year-over-year growth (2023-2028) (%)
    • 10.15 Malaysia - Market size and forecast (2023-2028)
      • Chart on Malaysia - Market size and forecast (2023-2028) ($ million)
      • Data Table on Malaysia - Market size and forecast (2023-2028) ($ million)
      • Chart on Malaysia - Year-over-year growth (2023-2028) (%)
      • Data Table on Malaysia - Year-over-year growth (2023-2028) (%)
    • 10.16 Indonesia - Market size and forecast (2023-2028)
      • Chart on Indonesia - Market size and forecast (2023-2028) ($ million)
      • Data Table on Indonesia - Market size and forecast (2023-2028) ($ million)
      • Chart on Indonesia - Year-over-year growth (2023-2028) (%)
      • Data Table on Indonesia - Year-over-year growth (2023-2028) (%)
    • 10.17 South Korea - Market size and forecast (2023-2028)
      • Chart on South Korea - Market size and forecast (2023-2028) ($ million)
      • Data Table on South Korea - Market size and forecast (2023-2028) ($ million)
      • Chart on South Korea - Year-over-year growth (2023-2028) (%)
      • Data Table on South Korea - Year-over-year growth (2023-2028) (%)
    • 10.18 France - Market size and forecast (2023-2028)
      • Chart on France - Market size and forecast (2023-2028) ($ million)
      • Data Table on France - Market size and forecast (2023-2028) ($ million)
      • Chart on France - Year-over-year growth (2023-2028) (%)
      • Data Table on France - Year-over-year growth (2023-2028) (%)
    • 10.19 Canada - Market size and forecast (2023-2028)
      • Chart on Canada - Market size and forecast (2023-2028) ($ million)
      • Data Table on Canada - Market size and forecast (2023-2028) ($ million)
      • Chart on Canada - Year-over-year growth (2023-2028) (%)
      • Data Table on Canada - Year-over-year growth (2023-2028) (%)
    • 10.20 Brazil - Market size and forecast (2023-2028)
      • Chart on Brazil - Market size and forecast (2023-2028) ($ million)
      • Data Table on Brazil - Market size and forecast (2023-2028) ($ million)
      • Chart on Brazil - Year-over-year growth (2023-2028) (%)
      • Data Table on Brazil - Year-over-year growth (2023-2028) (%)
    • 10.21 Thailand - Market size and forecast (2023-2028)
      • Chart on Thailand - Market size and forecast (2023-2028) ($ million)
      • Data Table on Thailand - Market size and forecast (2023-2028) ($ million)
      • Chart on Thailand - Year-over-year growth (2023-2028) (%)
      • Data Table on Thailand - Year-over-year growth (2023-2028) (%)
    • 10.22 UAE - Market size and forecast (2023-2028)
      • Chart on UAE - Market size and forecast (2023-2028) ($ million)
      • Data Table on UAE - Market size and forecast (2023-2028) ($ million)
      • Chart on UAE - Year-over-year growth (2023-2028) (%)
      • Data Table on UAE - Year-over-year growth (2023-2028) (%)
    • 10.23 Mexico - Market size and forecast (2023-2028)
      • Chart on Mexico - Market size and forecast (2023-2028) ($ million)
      • Data Table on Mexico - Market size and forecast (2023-2028) ($ million)
      • Chart on Mexico - Year-over-year growth (2023-2028) (%)
      • Data Table on Mexico - Year-over-year growth (2023-2028) (%)
    • 10.24 Japan - Market size and forecast (2023-2028)
      • Chart on Japan - Market size and forecast (2023-2028) ($ million)
      • Data Table on Japan - Market size and forecast (2023-2028) ($ million)
      • Chart on Japan - Year-over-year growth (2023-2028) (%)
      • Data Table on Japan - Year-over-year growth (2023-2028) (%)
    • 10.25 Rest of World (ROW) - Market size and forecast (2023-2028)
      • Chart on Rest of World (ROW) - Market size and forecast (2023-2028) ($ million)
      • Data Table on Rest of World (ROW) - Market size and forecast (2023-2028) ($ million)
      • Chart on Rest of World (ROW) - Year-over-year growth (2023-2028) (%)
      • Data Table on Rest of World (ROW) - Year-over-year growth (2023-2028) (%)

    11 Drivers, Challenges, and Opportunity/Restraints

    • 11.1 Market drivers
      • 11.2 Market challenges
        • 11.3 Impact of drivers and challenges
          • Impact of drivers and challenges in 2023 and 2028
        • 11.4 Market opportunities/restraints

          12 Competitive Landscape

          • 12.1 Overview
            • 12.2 Competitive Landscape
              • Overview on criticality of inputs and factors of differentiation
            • 12.3 Landscape disruption
              • Overview on factors of disruption
            • 12.4 Industry risks
              • Impact of key risks on business

            13 Competitive Analysis

            • 13.1 Companies profiled
              • Companies covered
            • 13.2 Market positioning of companies
              • Matrix on companies position and classification
            • 13.3 Aloe Drink For Life
              • Aloe Drink For Life - Overview
              • Aloe Drink For Life - Product / Service
              • Aloe Drink For Life - Key offerings
            • 13.4 Aloe Farms Inc.
              • Aloe Farms Inc. - Overview
              • Aloe Farms Inc. - Product / Service
              • Aloe Farms Inc. - Key offerings
            • 13.5 Forever Living Products International LLC
              • Forever Living Products International LLC - Overview
              • Forever Living Products International LLC - Product / Service
              • Forever Living Products International LLC - Key offerings
            • 13.6 GraceKennedy Ltd.
              • GraceKennedy Ltd. - Overview
              • GraceKennedy Ltd. - Business segments
              • GraceKennedy Ltd. - Key offerings
              • GraceKennedy Ltd. - Segment focus
            • 13.7 Lily of the Desert
              • Lily of the Desert - Overview
              • Lily of the Desert - Product / Service
              • Lily of the Desert - Key offerings
            • 13.8 OKF Co.
              • OKF Co. - Overview
              • OKF Co. - Product / Service
              • OKF Co. - Key offerings
            • 13.9 Patanjali Ayurved Ltd.
              • Patanjali Ayurved Ltd. - Overview
              • Patanjali Ayurved Ltd. - Product / Service
              • Patanjali Ayurved Ltd. - Key offerings
            • 13.10 Savia
              • Savia - Overview
              • Savia - Product / Service
              • Savia - Key offerings
            • 13.11 Simplee
              • Simplee - Overview
              • Simplee - Product / Service
              • Simplee - Key offerings
            • 13.12 Tulip International Inc.
              • Tulip International Inc. - Overview
              • Tulip International Inc. - Product / Service
              • Tulip International Inc. - Key offerings

            14 Appendix

            • 14.1 Scope of the report
              • 14.2 Inclusions and exclusions checklist
                • Inclusions checklist
                • Exclusions checklist
              • 14.3 Currency conversion rates for US$
                • Currency conversion rates for US$
              • 14.4 Research methodology
                • Research methodology
              • 14.5 Data procurement
                • Information sources
              • 14.6 Data validation
                • Data validation
              • 14.7 Validation techniques employed for market sizing
                • Validation techniques employed for market sizing
              • 14.8 Data synthesis
                • Data synthesis
              • 14.9 360 degree market analysis
                • 360 degree market analysis
              • 14.10 List of abbreviations
                • List of abbreviations

              Research Methodology

              Technavio presents a detailed picture of the market by way of study, synthesis, and summation of data from multiple sources. The analysts have presented the various facets of the market with a particular focus on identifying the key industry influencers. The data thus presented is comprehensive, reliable, and the result of extensive research, both primary and secondary.

              INFORMATION SOURCES

              Primary sources

              • Manufacturers and suppliers
              • Channel partners
              • Industry experts
              • Strategic decision makers

              Secondary sources

              • Industry journals and periodicals
              • Government data
              • Financial reports of key industry players
              • Historical data
              • Press releases

              DATA ANALYSIS

              Data Synthesis

              • Collation of data
              • Estimation of key figures
              • Analysis of derived insights

              Data Validation

              • Triangulation with data models
              • Reference against proprietary databases
              • Corroboration with industry experts

              REPORT WRITING

              Qualitative

              • Market drivers
              • Market challenges
              • Market trends
              • Five forces analysis

              Quantitative

              • Market size and forecast
              • Market segmentation
              • Geographical insights
              • Competitive landscape

              Interested in this report?

              Get your sample now to see our research methodology and insights!

              Download Now

              Frequently Asked Questions

              Aloe Vera Juice market growth will increase by $ 768.1 mn during 2024-2028.

              The Aloe Vera Juice market is expected to grow at a CAGR of 11.64% during 2024-2028.

              Aloe Vera Juice market is segmented by Distribution Channel( Offline, Online) Application( Beverages, Nutraceuticals, Cosmetics, Pharmaceuticals)

              ALO Drinks, Aloe Drink For Life, Aloe Farms Inc., AlterFood, Atlantia Aloe, ESI srl, Forever Living Products International LLC, Fruit of the Earth, GraceKennedy Ltd., Keumkang B and F Co. Ltd., Lily of the Desert, OKF Co., Patanjali Ayurved Ltd., RITA Food and Drink Co. Ltd., Savia, Simplee, Suja Life LLC, Tulip International Inc., Vitamin Well Group are a few of the key vendors in the Aloe Vera Juice market.

              North America will register the highest growth rate of 39% among the other regions. Therefore, the Aloe Vera Juice market in North America is expected to garner significant business opportunities for the vendors during the forecast period.

              US, Malaysia, Indonesia, Germany, UK, South Korea, France, Canada, Brazil, Thailand, UAE, Mexico, China, Japan, India

              • Growing number of organized retail outletsOrganized retailers witnessed growth in major countries such as the US and India is the driving factor this market.
              • which is extremely beneficial for vendors operating in the global aloe vera juice market. Supermarkets is the driving factor this market.
              • hypermarkets is the driving factor this market.
              • convenience stores is the driving factor this market.
              • and discount stores have become major sources of distribution and marketing of aloe vera juice.An increase in urbanization in regions such as APAC and South America has positively influenced the rise in the number of organized retailing outlets in these regions. Also is the driving factor this market.
              • the number of supermarkets in the US grew by 6% during 2018-2021. Moreover is the driving factor this market.
              • Brazil is the driving factor this market.
              • the UK is the driving factor this market.
              • Germany is the driving factor this market.
              • Italy is the driving factor this market.
              • Spain is the driving factor this market.
              • China is the driving factor this market.
              • Canada is the driving factor this market.
              • France is the driving factor this market.
              • Australia is the driving factor this market.
              • and Japan are some major countries with a high degree of penetration of organized retailing outlets within their territories. Thus is the driving factor this market.
              • an increase in the number of organized retail outlets globally is expected to foster the growth of the global aloe vera juice market during the forecast period. is the driving factor this market.

              The Aloe Vera Juice market vendors should focus on grabbing business opportunities from the Offline segment as it accounted for the largest market share in the base year.