Alternating Current Power System Market Analysis, Size, and Forecast 2026-2030: APAC (China, India, and Japan), North America (US, Canada, and Mexico), Europe (Germany, France, and Italy), South America (Brazil and Argentina), Middle East and Africa (Saudi Arabia, Turkey, and South Africa), and Rest of World (ROW)

Alternating Current Power System Market Analysis, Size, and Forecast 2026-2030:
APAC (China, India, and Japan), North America (US, Canada, and Mexico), Europe (Germany, France, and Italy), South America (Brazil and Argentina), Middle East and Africa (Saudi Arabia, Turkey, and South Africa), and Rest of World (ROW)

Published: Mar 2026 297 Pages SKU: IRTNTR74904

Market Overview at a Glance

$72.21 B
Market Opportunity
5.1%
CAGR 2025 - 2030
62.1%
APAC Growth
$208.11 B
Three-phase segment 2024

Alternating Current Power System Market Size 2026-2030

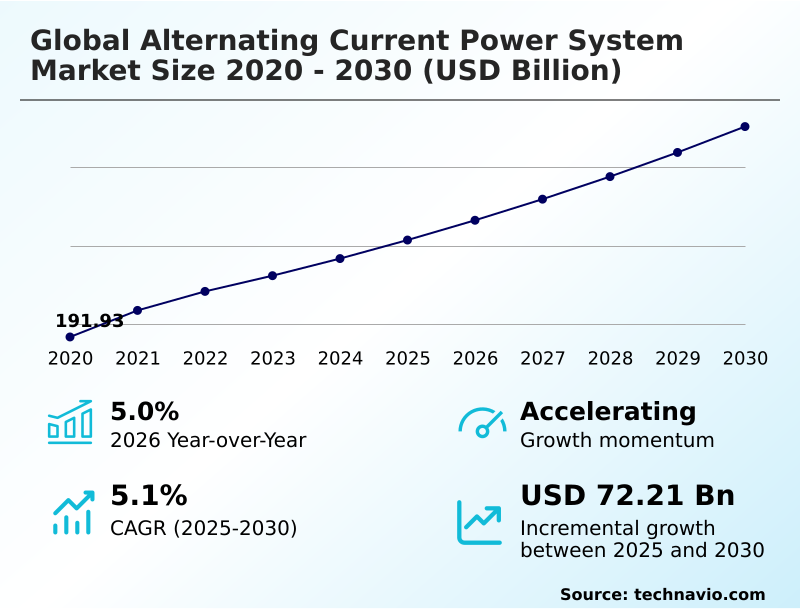
The alternating current power system market size is valued to increase by USD 72.21 billion, at a CAGR of 5.1% from 2025 to 2030. High-density hyperscale data centers and rise of AI-native AC power distribution units will drive the alternating current power system market.

Major Market Trends & Insights

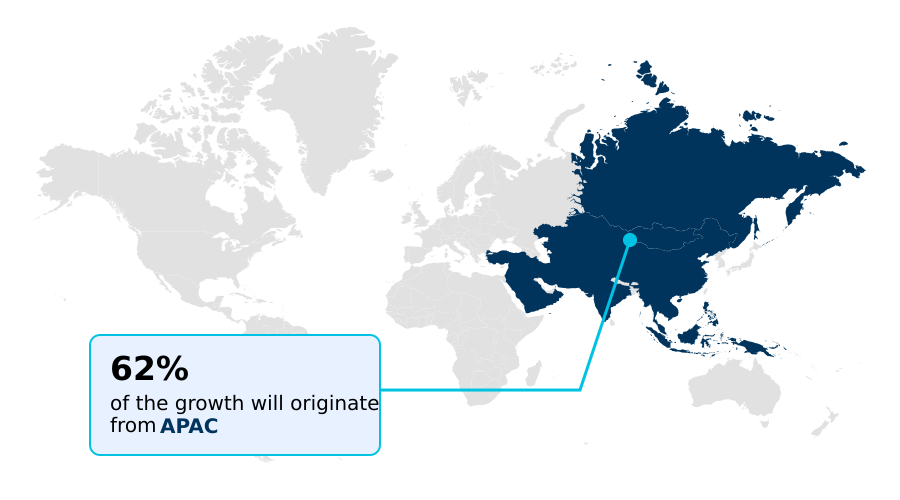
  • APAC dominated the market and accounted for a 62.1% growth during the forecast period.
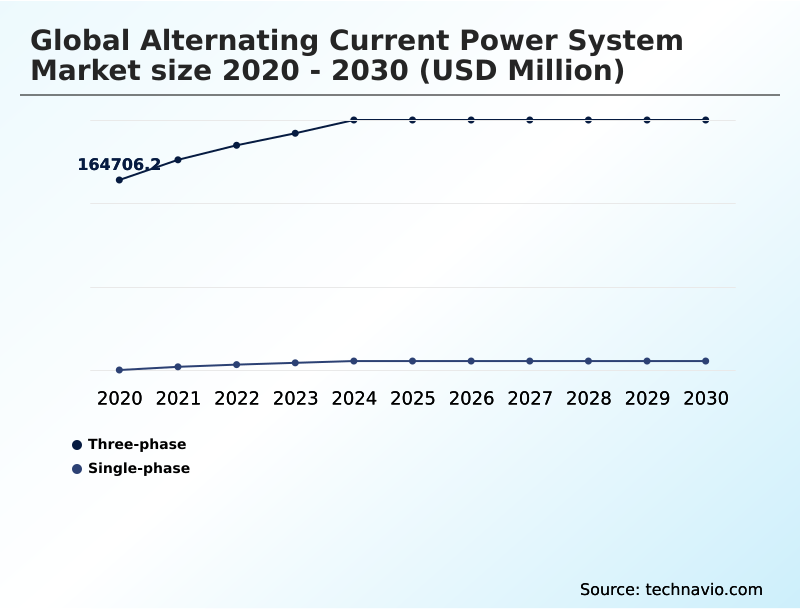
  • By Type - Three-phase segment was valued at USD 208.11 billion in 2024
  • By End-user - Non-residential segment accounted for the largest market revenue share in 2024

Market Size & Forecast

  • Market Opportunities: USD 133.89 billion
  • Market Future Opportunities: USD 72.21 billion
  • CAGR from 2025 to 2030 : 5.1%

Market Summary

  • The alternating current power system market is undergoing a profound structural transformation, driven by the dual imperatives of grid modernization and the aggressive integration of variable renewable energy sources.
  • This expansion is fundamentally characterized by a shift from traditional, centralized power architectures toward highly flexible, intelligent AC networks capable of managing bi-directional power flow and high-frequency fluctuations from inverter-based resources (IBRs). As nations strive to meet decarbonization targets, the replacement of aging fossil-fuel-based generation necessitates a massive overhaul of existing AC infrastructure.
  • This includes the deployment of advanced power conditioning systems and solid state transformers (SST) to maintain voltage stability. One key business scenario involves a utility deploying grid-forming (GFM) inverters and flexible AC transmission systems (FACTS) to manage a portfolio of decentralized energy resources.
  • This allows the utility to improve power quality management, prevent outages from weak-AC conditions, and defer costly physical upgrades, thereby enhancing grid resilience and financial performance in an era of rapid energy transition.
  • This digital pivot, combined with the expansion of ultra-high-voltage AC (UHVAC) networks in emerging economies, underscores the convergence of power electronics and digital controls as the primary engine of market evolution.

What will be the Size of the Alternating Current Power System Market during the forecast period?

Get Key Insights on Market Forecast (PDF) Request Free Sample

How is the Alternating Current Power System Market Segmented?

The alternating current power system industry research report provides comprehensive data (region-wise segment analysis), with forecasts and estimates in "USD million" for the period 2026-2030, as well as historical data from 2020-2024 for the following segments.

  • Type
    • Three-phase
    • Single-phase
  • End-user
    • Non-residential
    • Residential
  • Product
    • Switchgear
    • Generator
    • UPS
    • PDU
    • Others
  • Geography
    • APAC
      • China
      • India
      • Japan
    • North America
      • US
      • Canada
      • Mexico
    • Europe
      • Germany
      • France
      • Italy
    • South America
      • Brazil
      • Argentina
    • Middle East and Africa
      • Saudi Arabia
      • Turkey
      • South Africa
    • Rest of World (ROW)

By Type Insights

The three-phase segment is estimated to witness significant growth during the forecast period.

Three-phase power systems form the backbone of industrial and utility-scale power infrastructure, providing the high-capacity energy essential for heavy machinery, large-scale motors, and expansive commercial facilities.

These systems utilize three distinct alternating currents, offering constant and efficient power flow that reduces motor vibration and allows for more economical wiring compared to high-power single-phase setups.

The primary driver is the global expansion of energy-intensive industries, including semiconductor fabrication and data centers. As metropolitan areas grow, demand for robust three-phase distribution networks to support high-rise buildings and transit systems escalates.

Projects involving high-voltage substations with sophisticated protection systems are increasing, highlighting the role of three-phase infrastructure in enabling efficient power evacuation for utility-scale renewables and industrial hubs, supporting voltage requirements up to 765 kilovolts.

The integration of wide-bandgap semiconductors and digital twin testing is enhancing the reliability of three-phase inverters and converters, allowing for more precise grid synchronization and power quality management.

Request Free Sample

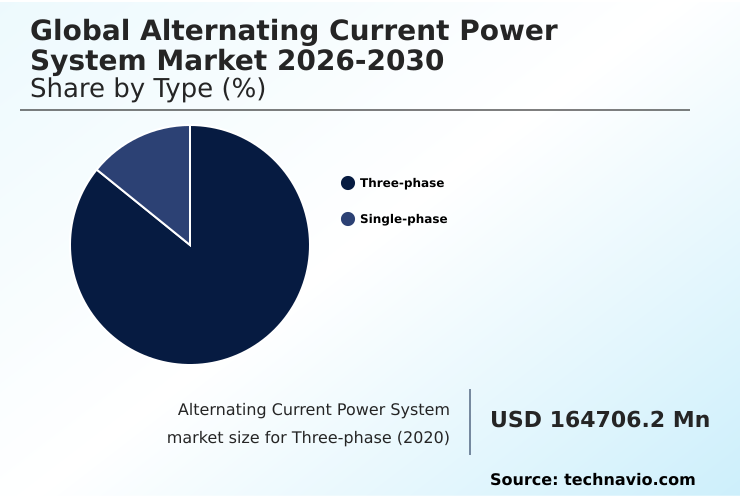
The Three-phase segment was valued at USD 208.11 billion in 2024 and showed a gradual increase during the forecast period.

Request Free Sample

Regional Analysis

APAC is estimated to contribute 62.1% to the growth of the global market during the forecast period.Technavio’s analysts have elaborately explained the regional trends and drivers that shape the market during the forecast period.

See How Alternating Current Power System Market Demand is Rising in APAC Request Free Sample

The APAC region represents the most dynamic geography, contributing to approximately 85% of global electricity demand growth and holding a dominant market share of 62%.

Rapid urbanization and manufacturing expansion in China and India are creating an insatiable appetite for robust and scalable AC power infrastructure, including three-phase power systems and high-voltage AC (HVAC) transmission networks.

This demand is amplified by a surge in data center installations, which are a primary driver for advanced uninterruptible power supplies (UPS) and power conditioning systems in Japan and Southeast Asia.

The proliferation of 5G telecommunications infrastructure also requires specialized gas-insulated switchgear (GIS) and modular power solutions to ensure uninterrupted service.

While facing some supply chain challenges, the region's overall trajectory is defined by rapid expansion and the adoption of smart grid technologies and advanced power semiconductor technologies to leapfrog legacy systems.

Market Dynamics

Our researchers analyzed the data with 2025 as the base year, along with the key drivers, trends, and challenges. A holistic analysis of drivers will help companies refine their marketing strategies to gain a competitive advantage.

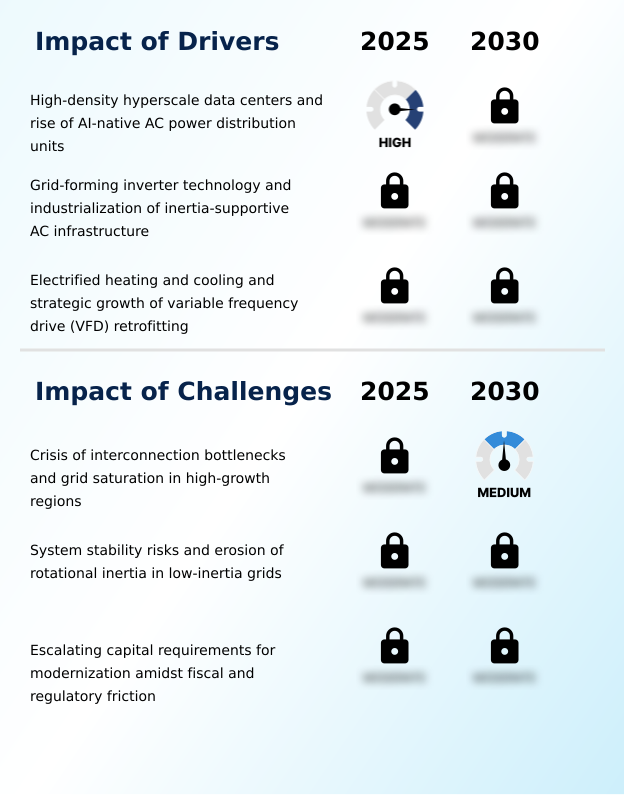
  • The strategic deployment of advanced alternating current power systems is becoming central to global economic competitiveness, driven by the intense energy needs of high-density hyperscale data center power and the rise of AI-native AC power distribution units. To support this, grid-forming inverter technology for decarbonization is being adopted to stabilize networks as they integrate more renewables.
  • In parallel, electrified heating with VFD retrofitting is enhancing energy efficiency in buildings. The backbone of this transformation is the use of digital twin for grid virtualization, which allows for predictive modeling and management. Key hardware innovations like solid state transformers in AC grids are enabling more flexible and efficient power conversion.
  • Ensuring cyber-physical resilience in power systems is a top priority, addressed through AI-enabled security frameworks. Operationally, managing interconnection queue bottlenecks is a major focus, alongside efforts to mitigate rotational inertia erosion risks. Addressing the capital requirements for grid modernization remains a persistent challenge. The market is seeing a clear divergence between three-phase vs single-phase power efficiency for different applications.
  • The reliability of UPS systems for critical infrastructure and the intelligence of PDU for server rack power management are non-negotiable. Modern switchgear for alternating current loads and generators for standby power redundancy provide essential control and backup. Furthermore, AC to AC converters for industrial machinery are crucial for operational continuity.
  • Both residential AC power system upgrades and non-residential power quality management are experiencing growth, facilitated by smart grid technologies for AC networks and HVAC transmission for renewable integration. Modernization efforts have demonstrated the ability to reduce grid losses by a figure that is more than double the efficiency gains from previous-generation hardware, directly improving operational profitability for utilities.

What are the key market drivers leading to the rise in the adoption of Alternating Current Power System Industry?

  • The market is significantly driven by the demands of high-density hyperscale data centers and the corresponding rise of AI-native AC power distribution units.

  • Market growth is significantly propelled by the rise of high-density hyperscale data centers, which require AI-native high-density power distribution units (PDUs) to manage unprecedented thermal and electrical loads.
  • This segment alone is driving a market expansion valued at over four times its previous state, as operators adopt intelligent AC power management systems for real-time monitoring.
  • Another key driver is the transition toward grid-forming (GFM) inverters to industrialize inertia-supportive AC infrastructure, which stabilizes grids with high renewable penetration.
  • Furthermore, the strategic adoption of electrified heating and cooling, coupled with the demand for variable frequency drive (VFD) retrofitting, is transforming AC motor control systems.
  • VFD retrofits often provide a return on investment within 18 months through reduced electricity consumption, turning passive AC systems into active, energy-optimizing assets, especially when integrated with industrial internet of things (IIoT) platforms.

What are the market trends shaping the Alternating Current Power System Industry?

  • The institutionalization of digital twin technology is transforming network management. This is coupled with a move toward high-fidelity grid virtualization for enhanced predictive analytics.

  • Key trends are reshaping the alternating current power system market, led by the institutionalization of digital twin technology. This shift from static modeling to dynamic, real-time virtual replicas enables predictive fault management, with some large grid operators successfully reducing maintenance costs by approximately 30% and extending the operational life of assets like transformers by up to 20%.
  • Another significant trend is the proliferation of solid state transformers (SST) and hybrid AC-DC conversion nodes. Utilizing advanced power semiconductor technologies, SSTs provide superior voltage regulation and facilitate bi-directional power flow, which is crucial for integrating renewable inputs.
  • Concurrently, the expansion of cyber-physical resilience through AI-enabled zero-trust security is becoming standard, moving beyond perimeter defenses to protect increasingly digitized and connected grid infrastructure from automated threats. This includes advanced substation automation and power quality management techniques.

What challenges does the Alternating Current Power System Industry face during its growth?

  • A critical challenge affecting industry growth is the crisis of interconnection bottlenecks, which leads to grid saturation in high-growth regions.

  • The market faces critical challenges, primarily the crisis of interconnection queue management, where backlogs have surged to approximately 2,500 gigawatts globally. This congestion stalls new renewable projects due to the physical saturation of existing AC transmission infrastructure. A second major challenge is the erosion of rotational inertia as traditional synchronous generators are replaced by inverter-based resources (IBRs).
  • This transition increases sensitivity to weak-AC conditions and the risk of instability, necessitating a redesign of protective schemes and the deployment of grid-enhancing technologies (GETS). Finally, the market is constrained by immense financial pressure, with a requirement to add or replace approximately 80 million kilometers of power lines.
  • This, combined with regulatory friction and the fiscal fragility of distribution utilities, creates a formidable barrier to mobilizing the necessary capital for grid modernization and advanced hosting-capacity analytics.

Exclusive Technavio Analysis on Customer Landscape

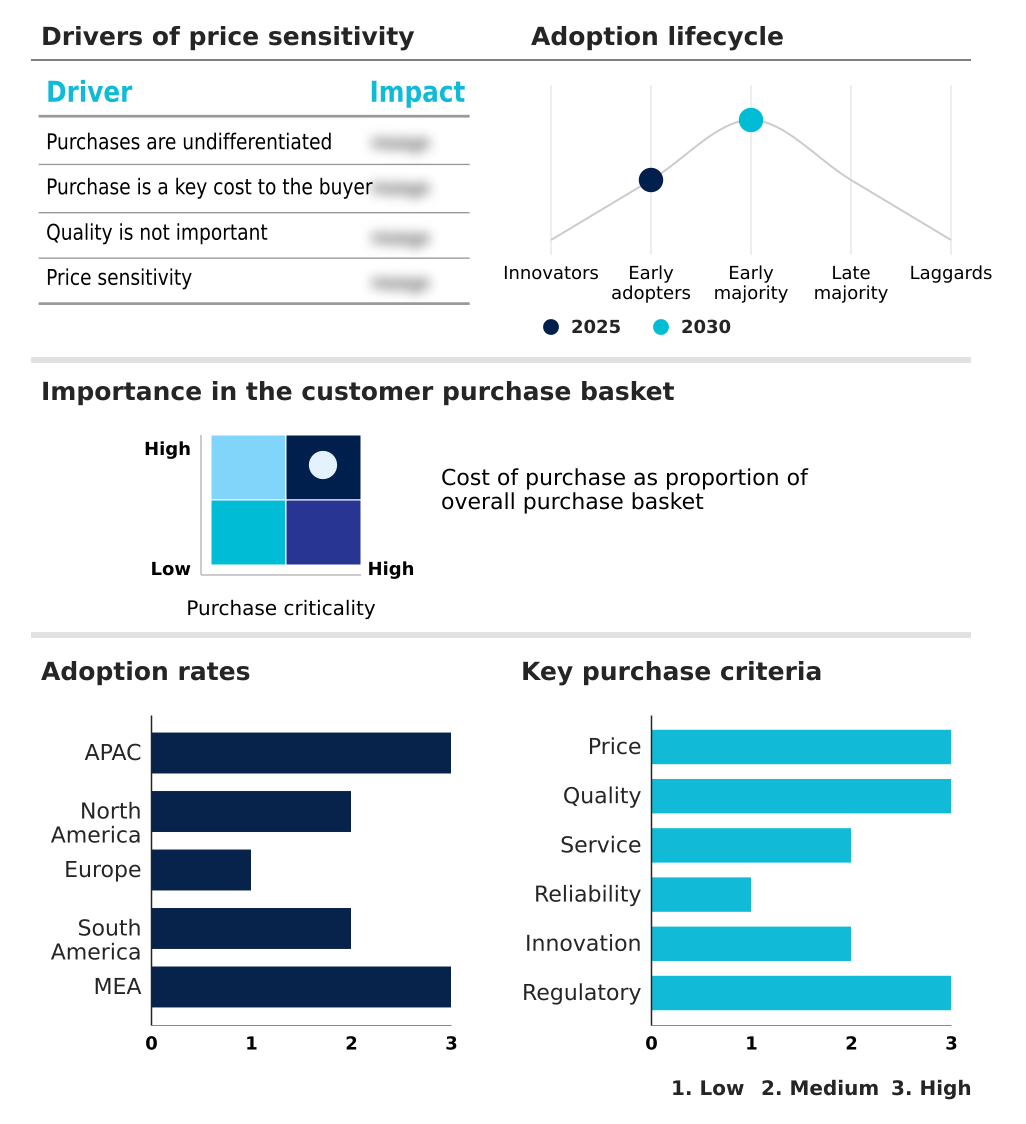
The alternating current power system market forecasting report includes the adoption lifecycle of the market, covering from the innovator’s stage to the laggard’s stage. It focuses on adoption rates in different regions based on penetration. Furthermore, the alternating current power system market report also includes key purchase criteria and drivers of price sensitivity to help companies evaluate and develop their market growth analysis strategies.

Customer Landscape of Alternating Current Power System Industry

Competitive Landscape

Companies are implementing various strategies, such as strategic alliances, alternating current power system market forecast, partnerships, mergers and acquisitions, geographical expansion, and product/service launches, to enhance their presence in the industry.

ABB Ltd. - Offerings include high-efficiency power conversion and grid stability solutions, with a focus on enhancing excitation and synchronization technologies for complex industrial and utility-scale operations.

The industry research and growth report includes detailed analyses of the competitive landscape of the market and information about key companies, including:

  • ABB Ltd.
  • Advanced Energy Industries
  • AEG Power Solutions BV
  • AMETEK Inc.
  • Borri SpA
  • Delta Electronics Inc.
  • Eaton Corp. Plc
  • EnerSys
  • Fuji Electric Co. Ltd.
  • GE Vernova Inc.
  • Generac Power Systems Inc.
  • Hitachi Energy Ltd.
  • Keysight Technologies Inc.
  • Legrand SA
  • LS ELECTRIC Co. Ltd.
  • Mitsubishi Electric Corp.
  • Schaefer Inc.
  • Schneider Electric SE
  • Toshiba Corp.
  • Vertiv Holdings Co.

Qualitative and quantitative analysis of companies has been conducted to help clients understand the wider business environment as well as the strengths and weaknesses of key industry players. Data is qualitatively analyzed to categorize companies as pure play, category-focused, industry-focused, and diversified; it is quantitatively analyzed to categorize companies as dominant, leading, strong, tentative, and weak.

Recent Development and News in Alternating current power system market

  • In April 2025, ABB announced a strategic partnership with E.ON, Germany's largest DSO, to supply next-generation, sulfur-hexafluoride-free air-insulated switchgear for its secondary distribution network.
  • In March 2025, Hartek Group secured cumulative orders worth USD 80.8 million across nine Indian states to strengthen regional and interstate transmission networks with high-voltage substations.
  • In February 2025, TE Connectivity finalized its USD 2.3 billion acquisition of Richards Manufacturing, a move designed to broaden its footprint in the electrical utilities sector and support critical grid infrastructure upgrades.
  • In September 2024, GE Vernova unveiled its GridBeats Automation and Protection System (APS), a software-defined grid solution designed to modernize electrical substations by consolidating multiple protection and control applications onto a single digital platform.

Dive into Technavio’s robust research methodology, blending expert interviews, extensive data synthesis, and validated models for unparalleled Alternating Current Power System Market insights. See full methodology.

Market Scope
Page number 297
Base year 2025
Historic period 2020-2024
Forecast period 2026-2030
Growth momentum & CAGR Accelerate at a CAGR of 5.1%
Market growth 2026-2030 USD 72211.0 million
Market structure Fragmented
YoY growth 2025-2026(%) 5.0%
Key countries China, India, Japan, South Korea, Australia, Indonesia, US, Canada, Mexico, Germany, France, Italy, UK, Spain, The Netherlands, Brazil, Argentina, Chile, Saudi Arabia, Turkey, South Africa, UAE and Israel
Competitive landscape Leading Companies, Market Positioning of Companies, Competitive Strategies, and Industry Risks

Request Free Sample

Research Analyst Overview

  • The alternating current power system market is pivoting toward intelligent, digitized infrastructure, moving beyond conventional hardware to integrated systems. The core of this evolution lies in the adoption of digital twin technology and smart grid technologies, which enable predictive and automated grid management. This shift has allowed some operators to achieve a 30% reduction in maintenance costs.
  • Key enabling hardware includes grid-forming (gfm) inverters and solid state transformers (sst), which are critical for integrating variable inverter-based resources (ibrs) and ensuring grid stability. The deployment of flexible ac transmission systems (facts) and reactive power compensation assets addresses issues of bi-directional power flow and voltage control.
  • In high-demand environments like data centers, high-density power distribution is managed through advanced power distribution units (pdu) and modular power solutions. Security is paramount, with a focus on ai-enabled zero-trust security and cyber-physical resilience.
  • The market continues to rely on foundational components like three-phase power systems, uninterruptible power supplies (ups), and synchronous generators, but with enhanced capabilities driven by new power semiconductor technologies and advanced power conditioning systems.
  • Upgrades are also evident in gas-insulated switchgear (gis), medium-voltage ac drives, and high-voltage ac (hvac) transmission networks, while grid-enhancing technologies (gets) are being deployed to maximize existing infrastructure capacity.

What are the Key Data Covered in this Alternating Current Power System Market Research and Growth Report?

  • What is the expected growth of the Alternating Current Power System Market between 2026 and 2030?

    • USD 72.21 billion, at a CAGR of 5.1%

  • What segmentation does the market report cover?

    • The report is segmented by Type (Three-phase, and Single-phase), End-user (Non-residential, and Residential), Product (Switchgear, Generator, UPS, PDU, and Others) and Geography (APAC, North America, Europe, South America, Middle East and Africa)

  • Which regions are analyzed in the report?

    • APAC, North America, Europe, South America and Middle East and Africa

  • What are the key growth drivers and market challenges?

    • High-density hyperscale data centers and rise of AI-native AC power distribution units, Crisis of interconnection bottlenecks and grid saturation in high-growth regions

  • Who are the major players in the Alternating Current Power System Market?

    • ABB Ltd., Advanced Energy Industries, AEG Power Solutions BV, AMETEK Inc., Borri SpA, Delta Electronics Inc., Eaton Corp. Plc, EnerSys, Fuji Electric Co. Ltd., GE Vernova Inc., Generac Power Systems Inc., Hitachi Energy Ltd., Keysight Technologies Inc., Legrand SA, LS ELECTRIC Co. Ltd., Mitsubishi Electric Corp., Schaefer Inc., Schneider Electric SE, Toshiba Corp. and Vertiv Holdings Co.

Market Research Insights

  • The market dynamics for alternating current power systems are shaped by the critical need for AC power infrastructure modernization and the management of increasingly complex energy flows. The global transition toward renewable sources is a major factor, with electricity demand projected to grow 2.5 times faster than overall energy demand.
  • This shift necessitates intelligent AC power management and inertia-supportive AC infrastructure to stabilize grids. In regions transitioning to green energy, system losses can average as high as 16%, creating a significant incentive for investment in advanced hosting-capacity analytics and predictive fault management systems.
  • The emergence of hybrid AC-DC conversion nodes and automated thermal management further reflects a move toward more efficient and resilient power distribution networks capable of supporting both legacy systems and next-generation demands.

We can help! Our analysts can customize this alternating current power system market research report to meet your requirements.

Get in touch

1. Executive Summary

1.1 Market overview

Executive Summary - Chart on Market Overview
Executive Summary - Data Table on Market Overview
Executive Summary - Chart on Global Market Characteristics
Executive Summary - Chart on Market by Geography
Executive Summary - Chart on Market Segmentation by Type
Executive Summary - Chart on Market Segmentation by End-user
Executive Summary - Chart on Market Segmentation by Product
Executive Summary - Chart on Incremental Growth
Executive Summary - Data Table on Incremental Growth
Executive Summary - Chart on Company Market Positioning

2. Technavio Analysis

2.1 Analysis of price sensitivity, lifecycle, customer purchase basket, adoption rates, and purchase criteria

2.2 Criticality of inputs and Factors of differentiation

Chart on Overview on criticality of inputs and factors of differentiation

2.3 Factors of disruption

Chart on Overview on factors of disruption

2.4 Impact of drivers and challenges

Chart on Impact of drivers and challenges in 2025 and 2030

3. Market Landscape

3.1 Market ecosystem

Chart on Parent Market
Data Table on - Parent Market

3.2 Market characteristics

Chart on Market characteristics analysis

3.3 Value chain analysis

Chart on Value chain analysis

4. Market Sizing

4.1 Market definition

Data Table on Offerings of companies included in the market definition

4.2 Market segment analysis

Market segments

4.3 Market size 2025

4.4 Market outlook: Forecast for 2025-2030

Chart on Global - Market size and forecast 2025-2030 ($ million)
Data Table on Global - Market size and forecast 2025-2030 ($ million)
Chart on Global Market: Year-over-year growth 2025-2030 (%)
Data Table on Global Market: Year-over-year growth 2025-2030 (%)

5. Historic Market Size

5.1 Global Alternating Current Power System Market 2020 - 2024

Historic Market Size - Data Table on Global Alternating Current Power System Market 2020 - 2024 ($ million)

5.2 Type segment analysis 2020 - 2024

Historic Market Size - Type Segment 2020 - 2024 ($ million)

5.3 End-user segment analysis 2020 - 2024

Historic Market Size - End-user Segment 2020 - 2024 ($ million)

5.4 Product segment analysis 2020 - 2024

Historic Market Size - Product Segment 2020 - 2024 ($ million)

5.5 Geography segment analysis 2020 - 2024

Historic Market Size - Geography Segment 2020 - 2024 ($ million)

5.6 Country segment analysis 2020 - 2024

Historic Market Size - Country Segment 2020 - 2024 ($ million)

6. Qualitative Analysis

6.1 Impact of AI in global alternating current power system market

7. Five Forces Analysis

7.1 Five forces summary

Five forces analysis - Comparison between 2025 and 2030

7.2 Bargaining power of buyers

Bargaining power of buyers - Impact of key factors 2025 and 2030

7.3 Bargaining power of suppliers

Bargaining power of suppliers - Impact of key factors in 2025 and 2030

7.4 Threat of new entrants

Threat of new entrants - Impact of key factors in 2025 and 2030

7.5 Threat of substitutes

Threat of substitutes - Impact of key factors in 2025 and 2030

7.6 Threat of rivalry

Threat of rivalry - Impact of key factors in 2025 and 2030

7.7 Market condition

Chart on Market condition - Five forces 2025 and 2030

8. Market Segmentation by Type

8.1 Market segments

Chart on Type - Market share 2025-2030 (%)
Data Table on Type - Market share 2025-2030 (%)

8.2 Comparison by Type

Chart on Comparison by Type
Data Table on Comparison by Type

8.3 Three-phase - Market size and forecast 2025-2030

Chart on Three-phase - Market size and forecast 2025-2030 ($ million)
Data Table on Three-phase - Market size and forecast 2025-2030 ($ million)
Chart on Three-phase - Year-over-year growth 2025-2030 (%)
Data Table on Three-phase - Year-over-year growth 2025-2030 (%)

8.4 Single-phase - Market size and forecast 2025-2030

Chart on Single-phase - Market size and forecast 2025-2030 ($ million)
Data Table on Single-phase - Market size and forecast 2025-2030 ($ million)
Chart on Single-phase - Year-over-year growth 2025-2030 (%)
Data Table on Single-phase - Year-over-year growth 2025-2030 (%)

8.5 Market opportunity by Type

Market opportunity by Type ($ million)
Data Table on Market opportunity by Type ($ million)

9. Market Segmentation by End-user

9.1 Market segments

Chart on End-user - Market share 2025-2030 (%)
Data Table on End-user - Market share 2025-2030 (%)

9.2 Comparison by End-user

Chart on Comparison by End-user
Data Table on Comparison by End-user

9.3 Non-residential - Market size and forecast 2025-2030

Chart on Non-residential - Market size and forecast 2025-2030 ($ million)
Data Table on Non-residential - Market size and forecast 2025-2030 ($ million)
Chart on Non-residential - Year-over-year growth 2025-2030 (%)
Data Table on Non-residential - Year-over-year growth 2025-2030 (%)

9.4 Residential - Market size and forecast 2025-2030

Chart on Residential - Market size and forecast 2025-2030 ($ million)
Data Table on Residential - Market size and forecast 2025-2030 ($ million)
Chart on Residential - Year-over-year growth 2025-2030 (%)
Data Table on Residential - Year-over-year growth 2025-2030 (%)

9.5 Market opportunity by End-user

Market opportunity by End-user ($ million)
Data Table on Market opportunity by End-user ($ million)

10. Market Segmentation by Product

10.1 Market segments

Chart on Product - Market share 2025-2030 (%)
Data Table on Product - Market share 2025-2030 (%)

10.2 Comparison by Product

Chart on Comparison by Product
Data Table on Comparison by Product

10.3 Switchgear - Market size and forecast 2025-2030

Chart on Switchgear - Market size and forecast 2025-2030 ($ million)
Data Table on Switchgear - Market size and forecast 2025-2030 ($ million)
Chart on Switchgear - Year-over-year growth 2025-2030 (%)
Data Table on Switchgear - Year-over-year growth 2025-2030 (%)

10.4 Generator - Market size and forecast 2025-2030

Chart on Generator - Market size and forecast 2025-2030 ($ million)
Data Table on Generator - Market size and forecast 2025-2030 ($ million)
Chart on Generator - Year-over-year growth 2025-2030 (%)
Data Table on Generator - Year-over-year growth 2025-2030 (%)

10.5 UPS - Market size and forecast 2025-2030

Chart on UPS - Market size and forecast 2025-2030 ($ million)
Data Table on UPS - Market size and forecast 2025-2030 ($ million)
Chart on UPS - Year-over-year growth 2025-2030 (%)
Data Table on UPS - Year-over-year growth 2025-2030 (%)

10.6 PDU - Market size and forecast 2025-2030

Chart on PDU - Market size and forecast 2025-2030 ($ million)
Data Table on PDU - Market size and forecast 2025-2030 ($ million)
Chart on PDU - Year-over-year growth 2025-2030 (%)
Data Table on PDU - Year-over-year growth 2025-2030 (%)

10.7 Others - Market size and forecast 2025-2030

Chart on Others - Market size and forecast 2025-2030 ($ million)
Data Table on Others - Market size and forecast 2025-2030 ($ million)
Chart on Others - Year-over-year growth 2025-2030 (%)
Data Table on Others - Year-over-year growth 2025-2030 (%)

10.8 Market opportunity by Product

Market opportunity by Product ($ million)
Data Table on Market opportunity by Product ($ million)

11. Customer Landscape

11.1 Customer landscape overview

Analysis of price sensitivity, lifecycle, customer purchase basket, adoption rates, and purchase criteria

12. Geographic Landscape

12.1 Geographic segmentation

Chart on Market share by geography 2025-2030 (%)
Data Table on Market share by geography 2025-2030 (%)

12.2 Geographic comparison

Chart on Geographic comparison
Data Table on Geographic comparison

12.3 APAC - Market size and forecast 2025-2030

Chart on APAC - Market size and forecast 2025-2030 ($ million)
Data Table on APAC - Market size and forecast 2025-2030 ($ million)
Chart on APAC - Year-over-year growth 2025-2030 (%)
Data Table on APAC - Year-over-year growth 2025-2030 (%)
Chart on Regional Comparison - APAC
Data Table on Regional Comparison - APAC

12.3.1 China - Market size and forecast 2025-2030

Chart on China - Market size and forecast 2025-2030 ($ million)
Data Table on China - Market size and forecast 2025-2030 ($ million)
Chart on China - Year-over-year growth 2025-2030 (%)
Data Table on China - Year-over-year growth 2025-2030 (%)

12.3.2 India - Market size and forecast 2025-2030

Chart on India - Market size and forecast 2025-2030 ($ million)
Data Table on India - Market size and forecast 2025-2030 ($ million)
Chart on India - Year-over-year growth 2025-2030 (%)
Data Table on India - Year-over-year growth 2025-2030 (%)

12.3.3 Japan - Market size and forecast 2025-2030

Chart on Japan - Market size and forecast 2025-2030 ($ million)
Data Table on Japan - Market size and forecast 2025-2030 ($ million)
Chart on Japan - Year-over-year growth 2025-2030 (%)
Data Table on Japan - Year-over-year growth 2025-2030 (%)

12.3.4 South Korea - Market size and forecast 2025-2030

Chart on South Korea - Market size and forecast 2025-2030 ($ million)
Data Table on South Korea - Market size and forecast 2025-2030 ($ million)
Chart on South Korea - Year-over-year growth 2025-2030 (%)
Data Table on South Korea - Year-over-year growth 2025-2030 (%)

12.3.5 Australia - Market size and forecast 2025-2030

Chart on Australia - Market size and forecast 2025-2030 ($ million)
Data Table on Australia - Market size and forecast 2025-2030 ($ million)
Chart on Australia - Year-over-year growth 2025-2030 (%)
Data Table on Australia - Year-over-year growth 2025-2030 (%)

12.3.6 Indonesia - Market size and forecast 2025-2030

Chart on Indonesia - Market size and forecast 2025-2030 ($ million)
Data Table on Indonesia - Market size and forecast 2025-2030 ($ million)
Chart on Indonesia - Year-over-year growth 2025-2030 (%)
Data Table on Indonesia - Year-over-year growth 2025-2030 (%)

12.4 North America - Market size and forecast 2025-2030

Chart on North America - Market size and forecast 2025-2030 ($ million)
Data Table on North America - Market size and forecast 2025-2030 ($ million)
Chart on North America - Year-over-year growth 2025-2030 (%)
Data Table on North America - Year-over-year growth 2025-2030 (%)
Chart on Regional Comparison - North America
Data Table on Regional Comparison - North America

12.4.1 US - Market size and forecast 2025-2030

Chart on US - Market size and forecast 2025-2030 ($ million)
Data Table on US - Market size and forecast 2025-2030 ($ million)
Chart on US - Year-over-year growth 2025-2030 (%)
Data Table on US - Year-over-year growth 2025-2030 (%)

12.4.2 Canada - Market size and forecast 2025-2030

Chart on Canada - Market size and forecast 2025-2030 ($ million)
Data Table on Canada - Market size and forecast 2025-2030 ($ million)
Chart on Canada - Year-over-year growth 2025-2030 (%)
Data Table on Canada - Year-over-year growth 2025-2030 (%)

12.4.3 Mexico - Market size and forecast 2025-2030

Chart on Mexico - Market size and forecast 2025-2030 ($ million)
Data Table on Mexico - Market size and forecast 2025-2030 ($ million)
Chart on Mexico - Year-over-year growth 2025-2030 (%)
Data Table on Mexico - Year-over-year growth 2025-2030 (%)

12.5 Europe - Market size and forecast 2025-2030

Chart on Europe - Market size and forecast 2025-2030 ($ million)
Data Table on Europe - Market size and forecast 2025-2030 ($ million)
Chart on Europe - Year-over-year growth 2025-2030 (%)
Data Table on Europe - Year-over-year growth 2025-2030 (%)
Chart on Regional Comparison - Europe
Data Table on Regional Comparison - Europe

12.5.1 Germany - Market size and forecast 2025-2030

Chart on Germany - Market size and forecast 2025-2030 ($ million)
Data Table on Germany - Market size and forecast 2025-2030 ($ million)
Chart on Germany - Year-over-year growth 2025-2030 (%)
Data Table on Germany - Year-over-year growth 2025-2030 (%)

12.5.2 France - Market size and forecast 2025-2030

Chart on France - Market size and forecast 2025-2030 ($ million)
Data Table on France - Market size and forecast 2025-2030 ($ million)
Chart on France - Year-over-year growth 2025-2030 (%)
Data Table on France - Year-over-year growth 2025-2030 (%)

12.5.3 Italy - Market size and forecast 2025-2030

Chart on Italy - Market size and forecast 2025-2030 ($ million)
Data Table on Italy - Market size and forecast 2025-2030 ($ million)
Chart on Italy - Year-over-year growth 2025-2030 (%)
Data Table on Italy - Year-over-year growth 2025-2030 (%)

12.5.4 UK - Market size and forecast 2025-2030

Chart on UK - Market size and forecast 2025-2030 ($ million)
Data Table on UK - Market size and forecast 2025-2030 ($ million)
Chart on UK - Year-over-year growth 2025-2030 (%)
Data Table on UK - Year-over-year growth 2025-2030 (%)

12.5.5 Spain - Market size and forecast 2025-2030

Chart on Spain - Market size and forecast 2025-2030 ($ million)
Data Table on Spain - Market size and forecast 2025-2030 ($ million)
Chart on Spain - Year-over-year growth 2025-2030 (%)
Data Table on Spain - Year-over-year growth 2025-2030 (%)

12.5.6 The Netherlands - Market size and forecast 2025-2030

Chart on The Netherlands - Market size and forecast 2025-2030 ($ million)
Data Table on The Netherlands - Market size and forecast 2025-2030 ($ million)
Chart on The Netherlands - Year-over-year growth 2025-2030 (%)
Data Table on The Netherlands - Year-over-year growth 2025-2030 (%)

12.6 South America - Market size and forecast 2025-2030

Chart on South America - Market size and forecast 2025-2030 ($ million)
Data Table on South America - Market size and forecast 2025-2030 ($ million)
Chart on South America - Year-over-year growth 2025-2030 (%)
Data Table on South America - Year-over-year growth 2025-2030 (%)
Chart on Regional Comparison - South America
Data Table on Regional Comparison - South America

12.6.1 Brazil - Market size and forecast 2025-2030

Chart on Brazil - Market size and forecast 2025-2030 ($ million)
Data Table on Brazil - Market size and forecast 2025-2030 ($ million)
Chart on Brazil - Year-over-year growth 2025-2030 (%)
Data Table on Brazil - Year-over-year growth 2025-2030 (%)

12.6.2 Argentina - Market size and forecast 2025-2030

Chart on Argentina - Market size and forecast 2025-2030 ($ million)
Data Table on Argentina - Market size and forecast 2025-2030 ($ million)
Chart on Argentina - Year-over-year growth 2025-2030 (%)
Data Table on Argentina - Year-over-year growth 2025-2030 (%)

12.6.3 Chile - Market size and forecast 2025-2030

Chart on Chile - Market size and forecast 2025-2030 ($ million)
Data Table on Chile - Market size and forecast 2025-2030 ($ million)
Chart on Chile - Year-over-year growth 2025-2030 (%)
Data Table on Chile - Year-over-year growth 2025-2030 (%)

12.7 Middle East and Africa - Market size and forecast 2025-2030

Chart on Middle East and Africa - Market size and forecast 2025-2030 ($ million)
Data Table on Middle East and Africa - Market size and forecast 2025-2030 ($ million)
Chart on Middle East and Africa - Year-over-year growth 2025-2030 (%)
Data Table on Middle East and Africa - Year-over-year growth 2025-2030 (%)
Chart on Regional Comparison - Middle East and Africa
Data Table on Regional Comparison - Middle East and Africa

12.7.1 Saudi Arabia - Market size and forecast 2025-2030

Chart on Saudi Arabia - Market size and forecast 2025-2030 ($ million)
Data Table on Saudi Arabia - Market size and forecast 2025-2030 ($ million)
Chart on Saudi Arabia - Year-over-year growth 2025-2030 (%)
Data Table on Saudi Arabia - Year-over-year growth 2025-2030 (%)

12.7.2 Turkey - Market size and forecast 2025-2030

Chart on Turkey - Market size and forecast 2025-2030 ($ million)
Data Table on Turkey - Market size and forecast 2025-2030 ($ million)
Chart on Turkey - Year-over-year growth 2025-2030 (%)
Data Table on Turkey - Year-over-year growth 2025-2030 (%)

12.7.3 South Africa - Market size and forecast 2025-2030

Chart on South Africa - Market size and forecast 2025-2030 ($ million)
Data Table on South Africa - Market size and forecast 2025-2030 ($ million)
Chart on South Africa - Year-over-year growth 2025-2030 (%)
Data Table on South Africa - Year-over-year growth 2025-2030 (%)

12.7.4 UAE - Market size and forecast 2025-2030

Chart on UAE - Market size and forecast 2025-2030 ($ million)
Data Table on UAE - Market size and forecast 2025-2030 ($ million)
Chart on UAE - Year-over-year growth 2025-2030 (%)
Data Table on UAE - Year-over-year growth 2025-2030 (%)

12.7.5 Israel - Market size and forecast 2025-2030

Chart on Israel - Market size and forecast 2025-2030 ($ million)
Data Table on Israel - Market size and forecast 2025-2030 ($ million)
Chart on Israel - Year-over-year growth 2025-2030 (%)
Data Table on Israel - Year-over-year growth 2025-2030 (%)

12.8 Market opportunity by geography

Market opportunity by geography ($ million)
Data Tables on Market opportunity by geography ($ million)

13. Drivers, Challenges, and Opportunity

13.1 Market drivers

High-density hyperscale data centers and rise of AI-native AC power distribution units
Grid-forming inverter technology and industrialization of inertia-supportive AC infrastructure
Electrified heating and cooling and strategic growth of variable frequency drive (VFD) retrofitting

13.2 Market challenges

Crisis of interconnection bottlenecks and grid saturation in high-growth regions
System stability risks and erosion of rotational inertia in low-inertia grids
Escalating capital requirements for modernization amidst fiscal and regulatory friction

13.3 Impact of drivers and challenges

Impact of drivers and challenges in 2025 and 2030

13.4 Market opportunities

Institutionalization of digital twin technology and high-fidelity grid virtualization
Increase in SST and hybrid AC-DC conversion nodes
Expansion of cyber-physical resilience and AI-enabled zero-trust security

14. Competitive Landscape

14.1 Overview

14.2

Overview on criticality of inputs and factors of differentiation

14.3 Landscape disruption

Overview on factors of disruption

14.4 Industry risks

Impact of key risks on business

15. Competitive Analysis

15.1 Companies profiled

Companies covered

15.2 Company ranking index

15.3 Market positioning of companies

Matrix on companies position and classification

15.4 ABB Ltd.

ABB Ltd. - Overview
ABB Ltd. - Business segments
ABB Ltd. - Key news
ABB Ltd. - Key offerings
ABB Ltd. - Segment focus
SWOT

15.5 Advanced Energy Industries

Advanced Energy Industries - Overview
Advanced Energy Industries - Business segments
Advanced Energy Industries - Key offerings
Advanced Energy Industries - Segment focus
SWOT

15.6 AEG Power Solutions BV

AEG Power Solutions BV - Overview
AEG Power Solutions BV - Product / Service
AEG Power Solutions BV - Key offerings
SWOT

15.7 AMETEK Inc.

AMETEK Inc. - Overview
AMETEK Inc. - Business segments
AMETEK Inc. - Key news
AMETEK Inc. - Key offerings
AMETEK Inc. - Segment focus
SWOT

15.8 Borri SpA

Borri SpA - Overview
Borri SpA - Product / Service
Borri SpA - Key offerings
SWOT

15.9 Eaton Corp. Plc

Eaton Corp. Plc - Overview
Eaton Corp. Plc - Business segments
Eaton Corp. Plc - Key news
Eaton Corp. Plc - Key offerings
Eaton Corp. Plc - Segment focus
SWOT

15.10 EnerSys

EnerSys - Overview
EnerSys - Business segments
EnerSys - Key news
EnerSys - Key offerings
EnerSys - Segment focus
SWOT

15.11 GE Vernova Inc.

GE Vernova Inc. - Overview
GE Vernova Inc. - Business segments
GE Vernova Inc. - Key offerings
GE Vernova Inc. - Segment focus
SWOT

15.12 Generac Power Systems Inc.

Generac Power Systems Inc. - Overview
Generac Power Systems Inc. - Business segments
Generac Power Systems Inc. - Key news
Generac Power Systems Inc. - Key offerings
Generac Power Systems Inc. - Segment focus
SWOT

15.13 Hitachi Energy Ltd.

Hitachi Energy Ltd. - Overview
Hitachi Energy Ltd. - Product / Service
Hitachi Energy Ltd. - Key offerings
SWOT

15.14 Mitsubishi Electric Corp.

Mitsubishi Electric Corp. - Overview
Mitsubishi Electric Corp. - Business segments
Mitsubishi Electric Corp. - Key offerings
Mitsubishi Electric Corp. - Segment focus
SWOT

15.15 Schaefer Inc.

Schaefer Inc. - Overview
Schaefer Inc. - Product / Service
Schaefer Inc. - Key offerings
SWOT

15.16 Schneider Electric SE

Schneider Electric SE - Overview
Schneider Electric SE - Business segments
Schneider Electric SE - Key news
Schneider Electric SE - Key offerings
Schneider Electric SE - Segment focus
SWOT

15.17 Toshiba Corp.

Toshiba Corp. - Overview
Toshiba Corp. - Product / Service
Toshiba Corp. - Key news
Toshiba Corp. - Key offerings
SWOT

15.18 Vertiv Holdings Co.

Vertiv Holdings Co. - Overview
Vertiv Holdings Co. - Business segments
Vertiv Holdings Co. - Key offerings
Vertiv Holdings Co. - Segment focus
SWOT

16. Appendix

16.1 Scope of the report

Market definition
Objectives
Notes and caveats

16.2 Inclusions and exclusions checklist

Inclusions checklist
Exclusions checklist

16.3 Currency conversion rates for US$

16.4 Research methodology

16.5 Data procurement

Information sources

16.6 Data validation

16.7 Validation techniques employed for market sizing

16.8 Data synthesis

16.9 360 degree market analysis

16.10 List of abbreviations

Research Methodology

Technavio presents a detailed picture of the market by way of study, synthesis, and summation of data from multiple sources. The analysts have presented the various facets of the market with a particular focus on identifying the key industry influencers. The data thus presented is comprehensive, reliable, and the result of extensive research, both primary and secondary.

INFORMATION SOURCES

Primary sources

  • Manufacturers and suppliers
  • Channel partners
  • Industry experts
  • Strategic decision makers

Secondary sources

  • Industry journals and periodicals
  • Government data
  • Financial reports of key industry players
  • Historical data
  • Press releases

DATA ANALYSIS

Data Synthesis

  • Collation of data
  • Estimation of key figures
  • Analysis of derived insights

Data Validation

  • Triangulation with data models
  • Reference against proprietary databases
  • Corroboration with industry experts

REPORT WRITING

Qualitative

  • Market drivers
  • Market challenges
  • Market trends
  • Five forces analysis

Quantitative

  • Market size and forecast
  • Market segmentation
  • Geographical insights
  • Competitive landscape

Interested in this report?

Get your sample now to see our research methodology and insights!

Download Now

Frequently Asked Questions

Alternating Current Power System market growth will increase by USD 72211.0 million during 2026-2030.

The Alternating Current Power System market is expected to grow at a CAGR of 5.1% during 2026-2030.

Alternating Current Power System market is segmented by Type (Three-phase, Single-phase) End-user (Non-residential, Residential) Product (Switchgear, Generator, UPS, PDU, Others)

ABB Ltd., Advanced Energy Industries, AEG Power Solutions BV, AMETEK Inc., Borri SpA, Delta Electronics Inc., Eaton Corp. Plc, EnerSys, Fuji Electric Co. Ltd., GE Vernova Inc., Generac Power Systems Inc., Hitachi Energy Ltd., Keysight Technologies Inc., Legrand SA, LS ELECTRIC Co. Ltd., Mitsubishi Electric Corp., Schaefer Inc., Schneider Electric SE, Toshiba Corp., Vertiv Holdings Co. are a few of the key vendors in the Alternating Current Power System market.

APAC will register the highest growth rate of 62.1% among the other regions. Therefore, the Alternating Current Power System market in APAC is expected to garner significant business opportunities for the vendors during the forecast period.

China, India, Japan, South Korea, Australia, Indonesia, US, Canada, Mexico, Germany, France, Italy, UK, Spain, The Netherlands, Brazil, Argentina, Chile, Saudi Arabia, Turkey, South Africa, UAE, Israel

  • High-density hyperscale data centers and rise of AI-native AC power distribution units is the driving factor this market.

The Alternating Current Power System market vendors should focus on grabbing business opportunities from the Type segment as it accounted for the largest market share in the base year.
RIA - Research AI Assistant
Ask RIA