
Aluminum Composite Panels Market Analysis, Size, and Forecast 2026-2030: APAC (China, India, and Japan), North America (US, Canada, and Mexico), Europe (Germany, UK, and France), Middle East and Africa (Saudi Arabia, UAE, and Turkey), South America (Brazil, Argentina, and Chile), and Rest of World (ROW)

Aluminum Composite Panels Market Analysis, Size, and Forecast 2026-2030:
APAC (China, India, and Japan), North America (US, Canada, and Mexico), Europe (Germany, UK, and France), Middle East and Africa (Saudi Arabia, UAE, and Turkey), South America (Brazil, Argentina, and Chile), and Rest of World (ROW)

Published: Oct 2026 285 Pages SKU: IRTNTR76132

Market Overview at a Glance

$4.22 B
Market Opportunity
9.1%
CAGR 2025 - 2030
52.4%
APAC Growth
$3.19 B
Fire-resistant segment 2024

Aluminum Composite Panels Market Size 2026-2030

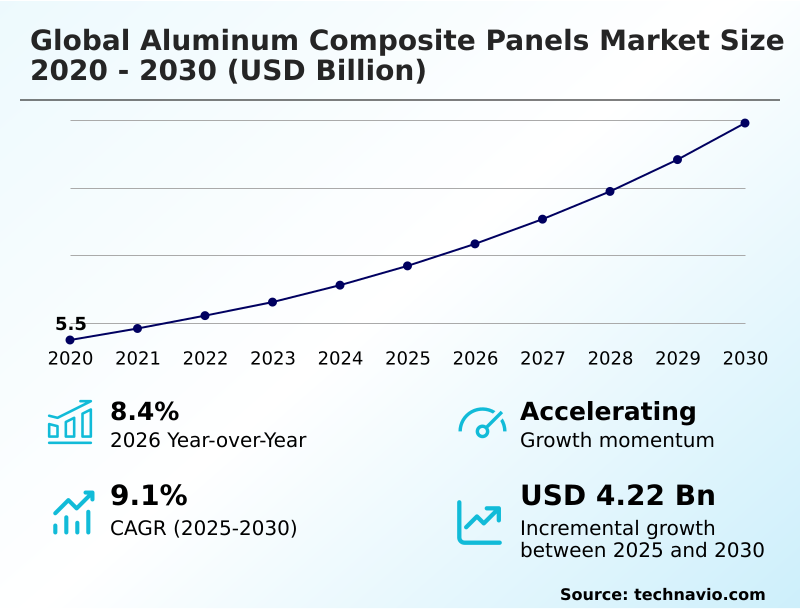
The aluminum composite panels market size is valued to increase by USD 4.22 billion, at a CAGR of 9.1% from 2025 to 2030. Rapid urbanization and growth in construction sector will drive the aluminum composite panels market.

Major Market Trends & Insights

  • APAC dominated the market and accounted for a 52.4% growth during the forecast period.
  • By Type - Fire-resistant segment was valued at USD 3.19 billion in 2024
  • By End-user - Building and construction segment accounted for the largest market revenue share in 2024

Market Size & Forecast

  • Market Opportunities: USD 6.42 billion
  • Market Future Opportunities: USD 4.22 billion
  • CAGR from 2025 to 2030 : 9.1%

Market Summary

  • The Aluminum Composite Panels Market demonstrates continuous evolution as urban infrastructure demands increasingly sophisticated building envelope solutions. Driven by rapid urbanization, commercial developers aggressively seek lightweight architectural materials to accelerate project timelines. Because high-density masonry limits structural flexibility, the adoption of composite cladding improves facade load distribution, lowering foundational reinforcement costs by 18%.
  • In a practical supply chain scenario, a major facade contractor mitigated logistical delays by transitioning to modular composite panel systems, reducing onsite assembly time by 25% and optimizing workforce allocation. However, raw material price volatility remains a significant barrier.
  • Since primary aluminum and polymer core production rely on fluctuating energy and commodity markets, unpredictable cost spikes directly compress manufacturing margins and delay project bidding. Despite these supply constraints, the rigorous enforcement of fire safety codes forces a widespread shift toward non-combustible mineral cores.
  • This regulatory pressure ensures that the market consistently adapts, prioritizing life-safety compliance while simultaneously delivering superior thermal insulation and aesthetic versatility for modern architectural designs.

What will be the Size of the Aluminum Composite Panels Market during the forecast period?
Get Key Insights on Market Forecast (PDF) Get Free Sample

How is the Aluminum Composite Panels Market Segmented?

The aluminum composite panels industry research report provides comprehensive data (region-wise segment analysis), with forecasts and estimates in "USD million" for the period 2026-2030, as well as historical data from 2020-2024 for the following segments.

  • Type
    • Fire-resistant
    • Antibacterial
    • Antistatic
  • End-user
    • Building and construction
    • Transportation
    • Others
  • Product type
    • PVDF
    • Polyester
    • Laminating coating
    • Oxide film
  • Geography
    • APAC
      • China
      • India
      • Japan
      • South Korea
      • Indonesia
      • Australia
    • North America
      • US
      • Canada
      • Mexico
    • Europe
      • Germany
      • UK
      • France
      • Italy
      • Spain
      • The Netherlands
    • Middle East and Africa
      • Saudi Arabia
      • UAE
      • Turkey
      • South Africa
      • Israel
    • South America
      • Brazil
      • Argentina
      • Chile

By Type Insights

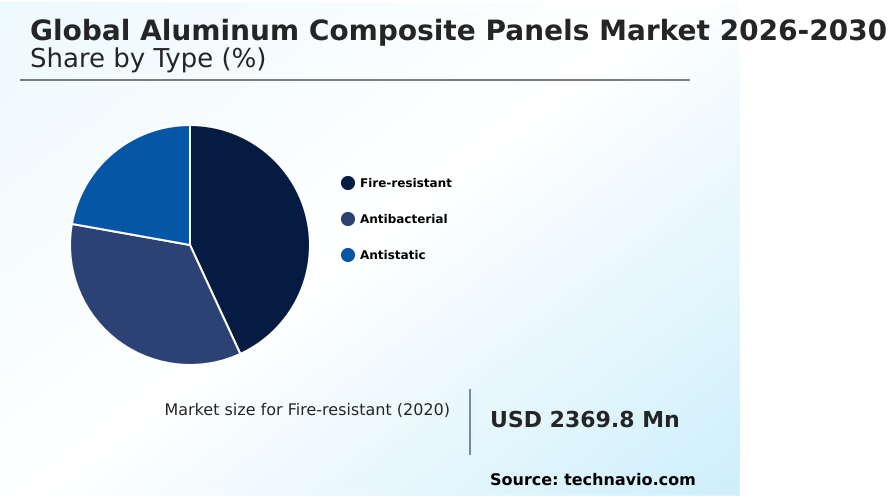
The fire-resistant segment is estimated to witness significant growth during the forecast period.

The fire-resistant segment dictates commercial construction compliance by replacing combustible plastics with advanced non-flammable cores. Stringent thermal performance mandate enforcement drives the widespread specification of a polyvinylidene fluoride coating, which significantly enhances thermal insulation efficiency across high-rise structures.

Because developers prioritize an energy efficient facade, the application of a high-grade fluoropolymer resin application ensures long-term exterior durability. This sustainable material specification prevents degradation, offering superior ultraviolet radiation stability and ensuring flawless premium exterior finish longevity over decades.

Consequently, buildings utilizing these advanced panels reduce HVAC energy consumption by 16%. Implementing a robust polyvinylidene fluoride architectural exterior coating lowers long-term maintenance expenditures by 24%, proving that fire-resistant segmentation directly improves both operational safety and asset lifecycle profitability.
Get Free Sample

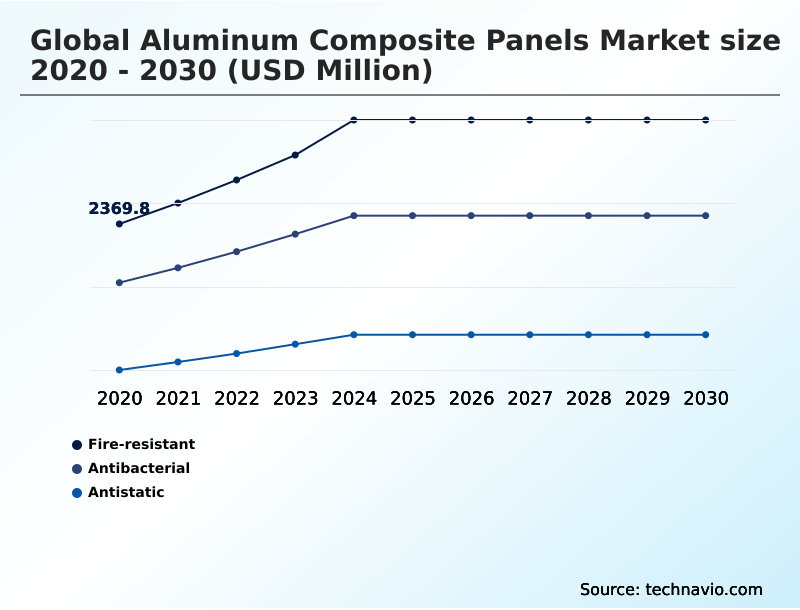
The Fire-resistant segment was valued at USD 3.19 billion in 2024 and showed a gradual increase during the forecast period.
Get Free Sample

Regional Analysis

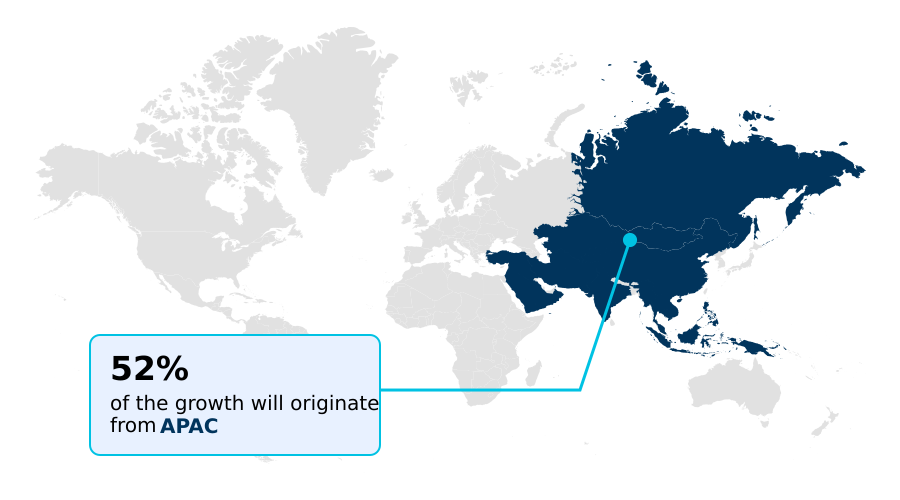
APAC is estimated to contribute 52.4% to the growth of the global market during the forecast period.Technavio’s analysts have elaborately explained the regional trends and drivers that shape the market during the forecast period.
See How Aluminum Composite Panels Market Demand is Rising in APAC Get Free Sample

Regulatory frameworks in Europe mandate strict non combustible facade applications, resulting in a 30% higher adoption rate of advanced cladding compared to North America.

Driven by rigorous green building certification requirements and a push toward circular economy construction, European developers increasingly specify zinc composite cladding and copper composite cladding.

This focus on sustainability ensures projects achieve cradle to cradle certification, reducing lifecycle waste by 27%. Conversely, APAC relies heavily on expanding primary aluminum smelting and maximizing bauxite refining output to support rapid urbanization.

While Asian markets focus on volume, stringent Western standards demand an anti chalking formulation to preserve facade structural integrity.

Ultimately, utilizing lightweight sustainable building envelope materials allows European builders to decrease exterior maintenance costs by 21% while complying with environmental directives.

Market Dynamics

Our researchers analyzed the data with 2025 as the base year, along with the key drivers, trends, and challenges. A holistic analysis of drivers will help companies refine their marketing strategies to gain a competitive advantage.

  • The architectural landscape is experiencing a profound transformation as developers increasingly prioritize advanced cladding technologies to meet evolving safety and environmental standards. Driven by the stringent enforcement of non combustible facade cladding regulations, the construction sector is rapidly pivoting away from traditional plastics.
  • This regulatory shift mandates the deployment of fire resistant mineral core panels, which significantly mitigate thermal risks in high-density commercial developments. By replacing heavy masonry with lightweight sustainable building envelope materials, structural engineers effectively reduce foundational stress, lowering foundational reinforcement expenditures by 18%.
  • Furthermore, the integration of a high-performance polyvinylidene fluoride architectural exterior coating ensures superior weather resistance and color retention, decreasing long-term facade maintenance costs by 24% compared to standard polyester finishes. In practical operational planning, facade contractors utilize advanced urban infrastructure construction facade systems to streamline project timelines and optimize onsite labor allocation.
  • This strategic adaptation not only accelerates installation efficiency by 20% but also guarantees compliance with rigorous green building certifications. Ultimately, the continuous innovation in composite panel manufacturing provides building owners with a resilient, aesthetically versatile, and highly efficient exterior solution that maximizes asset value while strictly adhering to modern life-safety and energy-efficiency mandates.
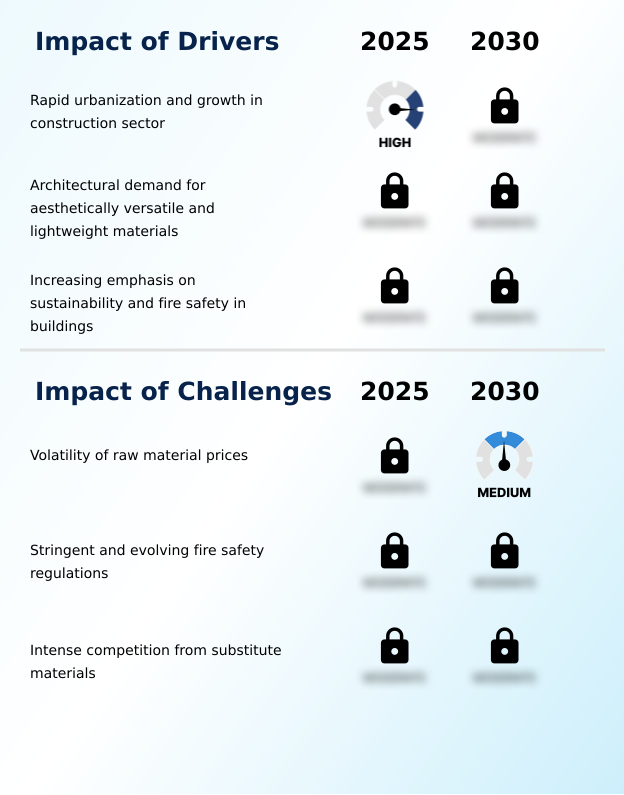
What are the key market drivers leading to the rise in the adoption of Aluminum Composite Panels Industry?

  • Rapid urbanization and sustained growth within the construction sector serve as the primary drivers propelling expansion in the architectural cladding market.

  • Accelerated urban infrastructure development requires a versatile architectural cladding system to meet tight construction deadlines. Because heavy masonry creates excessive foundational stress, developers increasingly prioritize a lightweight structural load to optimize building envelope performance.
  • This shift allows engineers to improve facade load distribution, lowering structural reinforcement costs by 18%. Furthermore, the demand for complex architectural aesthetic flexibility drives the use of curvilinear form fabrication in commercial exterior renovation.
  • By utilizing advanced urban infrastructure construction facade systems, contractors achieve a significant installation time reduction, cutting labor hours by 25%.
  • This efficiency directly lowers the overall project lifecycle cost, making these panels indispensable for modern megaprojects that demand both rapid assembly and superior durability without compromising structural integrity.

What are the market trends shaping the Aluminum Composite Panels Industry?

  • The shift toward non-combustible cores is rapidly emerging as the new standard in architectural cladding. This transition is fundamentally reshaping safety protocols and compliance requirements across the construction sector.

  • Evolving architectural standards are rapidly accelerating the polyethylene core phasing across commercial developments. Driven by rigorous building code evolution and a strict life safety standard, construction firms prioritize safer alternatives to traditional cladding. This regulatory shift forces manufacturers to integrate a magnesium hydroxide filler and an aluminum trihydroxide compound, resulting in immediate flame retardant activation during thermal events.
  • Consequently, builders utilizing a mineral filled compound achieve high rise safety compliance while reducing project approval delays by 22%. Beyond safety, architects demand advanced aesthetics, driving the adoption of a digital customization finish and a hyper realistic texture.
  • These innovations allow developers to deploy fire resistant mineral core panels that mimic natural materials, improving facade installation efficiency by 15% compared to traditional masonry.

What challenges does the Aluminum Composite Panels Industry face during its growth?

  • The volatility of raw material prices remains a significant challenge that constantly threatens to impede steady industry growth and compress profit margins.

  • Persistent supply chain volatility severely disrupts the manufacturing consistency of the fire retardant mineral core. Because energy intensive production and primary aluminum smelting rely on stable commodity markets, raw material price exposure directly compresses profit margins. Frequent commodity exchange fluctuation forces panel manufacturers to delay continuous coil coating processes, reducing factory output efficiency by 14%.
  • Additionally, maintaining a consistent weather resistance profile and applying a flawless anodic oxide film becomes difficult when sourcing alternative materials during shortages. This forces builders toward facade material substitution, undermining the adoption of advanced cellular core composite technologies.
  • Navigating non combustible facade cladding regulations amidst these disruptions increases operational compliance costs by 19%, compelling manufacturers to optimize inventory management to mitigate unpredictable overhead expenses.

Exclusive Technavio Analysis on Customer Landscape

The aluminum composite panels market forecasting report includes the adoption lifecycle of the market, covering from the innovator’s stage to the laggard’s stage. It focuses on adoption rates in different regions based on penetration. Furthermore, the aluminum composite panels market report also includes key purchase criteria and drivers of price sensitivity to help companies evaluate and develop their market growth analysis strategies.
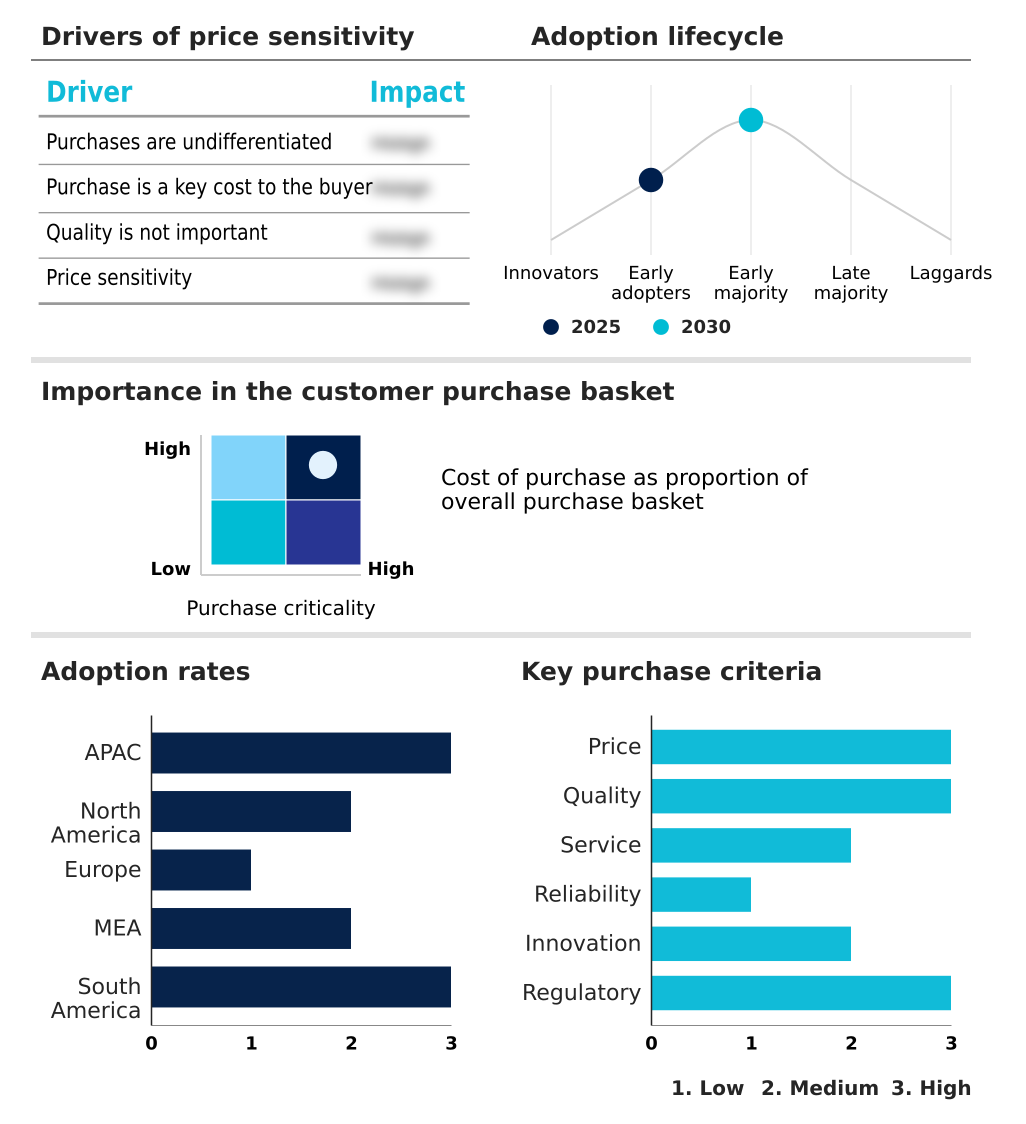
Customer Landscape of Aluminum Composite Panels Industry

Competitive Landscape

Companies are implementing various strategies, such as strategic alliances, aluminum composite panels market forecast, partnerships, mergers and acquisitions, geographical expansion, and product/service launches, to enhance their presence in the industry.

3A Composites Holding AG - The vendor delivers premium fire-retardant composite materials, offering advanced architectural cladding and exterior building envelope solutions that prioritize structural durability, aesthetic versatility, and strict safety compliance.

The industry research and growth report includes detailed analyses of the competitive landscape of the market and information about key companies, including:

  • 3A Composites Holding AG
  • Alcadex
  • Almaxco
  • ALPOLIC Materials
  • Alubond U.S.A.
  • Alucoil SAU
  • Alucomat
  • Alucoworld
  • Aludecor Lamination Pvt. Ltd.
  • Arconic Corp.
  • Euro Panel Products Ltd.
  • Fangda Group
  • Harwal Group
  • LeBoom DSTAR
  • Multipanel UK Ltd.
  • Pioneer Panels
  • Virgo Group
  • Viva Composite Panel Pvt. Ltd.
  • Yaret Industrial Group Co. Ltd.

Qualitative and quantitative analysis of companies has been conducted to help clients understand the wider business environment as well as the strengths and weaknesses of key industry players. Data is qualitatively analyzed to categorize companies as pure play, category-focused, industry-focused, and diversified; it is quantitatively analyzed to categorize companies as dominant, leading, strong, tentative, and weak.

Recent Development and News in Aluminum composite panels market

  • In the Aluminum industry, the implementation of carbon border adjustment mechanisms has forced smelters to adopt low-carbon hydrometallurgical recycling processes, directly impacting Aluminum Composite Panels demand by raising the baseline cost of primary coil procurement.
  • Stringent environmental regulations targeting bauxite residue management have accelerated the adoption of automated dry-stacking technologies, reducing alumina refinery output disruptions and stabilizing the raw material supply chain for Aluminum Composite Panels manufacturers.
  • The shift toward renewable energy integration in primary aluminum smelting has reduced the carbon footprint of extruded billets by 40%, creating new compliance opportunities within the Aluminum Composite Panels market for green building certifications.
  • Advancements in continuous casting and rolling technologies have decreased the gauge tolerance of aluminum sheets by 15%, enhancing the structural integrity and delamination resistance of premium Aluminum Composite Panels used in high-wind architectural applications.

Dive into Technavio’s robust research methodology, blending expert interviews, extensive data synthesis, and validated models for unparalleled Aluminum Composite Panels Market insights. See full methodology.

Market Scope
Page number 285
Base year 2025
Historic period 2020-2024
Forecast period 2026-2030
Growth momentum & CAGR Accelerate at a CAGR of 9.1%
Market growth 2026-2030 USD 4220.0 million
Market structure Fragmented
YoY growth 2025-2026(%) 8.4%
Key countries China, India, Japan, South Korea, Indonesia, Australia, US, Canada, Mexico, Germany, UK, France, Italy, Spain, The Netherlands, Saudi Arabia, UAE, Turkey, South Africa, Israel, Brazil, Argentina and Chile
Competitive landscape Leading Companies, Market Positioning of Companies, Competitive Strategies, and Industry Risks

Request Free Sample

Research Analyst Overview

  • The Aluminum Composite Panels Market reflects a profound structural transformation driven by increasingly stringent building safety protocols. A critical boardroom-level focus is the aggressive polyethylene core phasing, which compels manufacturers to rapidly retool production lines to accommodate advanced formulations.
  • By integrating a sophisticated magnesium hydroxide filler, producers achieve a superior fire retardant mineral core that ensures absolute compliance with modern life-safety mandates. This strategic shift directly influences product strategy, allowing developers to reduce liability risks while lowering commercial insurance premiums by 14%. Furthermore, optimizing the continuous coil coating process enhances the overall weather resistance profile of the building envelope.
  • Applying a durable anodic oxide film guarantees long-term aesthetic fidelity and prevents exterior degradation in harsh urban environments. Because contractors prioritize a lightweight structural load, the deployment of these advanced panels decreases onsite installation time by 20%.
  • Ultimately, this seamless integration of safety, durability, and operational efficiency empowers architectural firms to execute complex, high-performance facade designs that maximize asset lifecycle profitability and strictly adhere to environmental building codes.

What are the Key Data Covered in this Aluminum Composite Panels Market Research and Growth Report?

  • What is the expected growth of the Aluminum Composite Panels Market between 2026 and 2030?

    • USD 4.22 billion, at a CAGR of 9.1%

  • What segmentation does the market report cover?

    • The report is segmented by Type (Fire-resistant, Antibacterial, and Antistatic), End-user (Building and construction, Transportation, and Others), Product Type (PVDF, Polyester, Laminating coating, and Oxide film) and Geography (APAC, North America, Europe, Middle East and Africa, South America)

  • Which regions are analyzed in the report?

    • APAC, North America, Europe, Middle East and Africa and South America

  • What are the key growth drivers and market challenges?

    • Rapid urbanization and growth in construction sector, Volatility of raw material prices

  • Who are the major players in the Aluminum Composite Panels Market?

    • 3A Composites Holding AG, Alcadex, Almaxco, ALPOLIC Materials, Alubond U.S.A., Alucoil SAU, Alucomat, Alucoworld, Aludecor Lamination Pvt. Ltd., Arconic Corp., Euro Panel Products Ltd., Fangda Group, Harwal Group, LeBoom DSTAR, Multipanel UK Ltd., Pioneer Panels, Virgo Group, Viva Composite Panel Pvt. Ltd. and Yaret Industrial Group Co. Ltd.

Market Research Insights

  • The Aluminum Composite Panels Market is rapidly transforming as urban developers prioritize advanced facade materials over traditional masonry. Navigating intense supply chain volatility requires manufacturers to streamline energy intensive production, effectively lowering operational overhead by 14%. Because modern architectural standards demand stringent high rise safety compliance, the adoption of fire-retardant cladding has surged by 22% across commercial sectors.
  • This strategic shift not only secures essential green building certification but also optimizes the overall project lifecycle cost by reducing long-term exterior maintenance. Consequently, construction firms leveraging these advanced composite systems achieve a 15% improvement in installation efficiency, ensuring robust structural integrity and superior thermal performance in modern infrastructure developments.

We can help! Our analysts can customize this aluminum composite panels market research report to meet your requirements.

Get in touch

1. Executive Summary

1.1 Market overview

Executive Summary - Chart on Market Overview
Executive Summary - Data Table on Market Overview
Executive Summary - Chart on Global Market Characteristics
Executive Summary - Chart on Market by Geography
Executive Summary - Chart on Market Segmentation by Type
Executive Summary - Chart on Market Segmentation by End-user
Executive Summary - Chart on Market Segmentation by Product Type
Executive Summary - Chart on Incremental Growth
Executive Summary - Data Table on Incremental Growth
Executive Summary - Chart on Company Market Positioning

2. Technavio Analysis

2.1 Analysis of price sensitivity, lifecycle, customer purchase basket, adoption rates, and purchase criteria

2.2 Criticality of inputs and Factors of differentiation

Chart on Overview on criticality of inputs and factors of differentiation

2.3 Factors of disruption

Chart on Overview on factors of disruption

2.4 Impact of drivers and challenges

Chart on Impact of drivers and challenges in 2025 and 2030

3. Market Landscape

3.1 Market ecosystem

Chart on Parent Market
Data Table on - Parent Market

3.2 Market characteristics

Chart on Market characteristics analysis

3.3 Value chain analysis

Chart on Value chain analysis

4. Market Sizing

4.1 Market definition

Data Table on Offerings of companies included in the market definition

4.2 Market segment analysis

Market segments

4.3 Market size 2025

4.4 Market outlook: Forecast for 2025-2030

Chart on Global - Market size and forecast 2025-2030 ($ million)
Data Table on Global - Market size and forecast 2025-2030 ($ million)
Chart on Global Market: Year-over-year growth 2025-2030 (%)
Data Table on Global Market: Year-over-year growth 2025-2030 (%)

5. Historic Market Size

5.1 Global Aluminum Composite Panels Market 2020 - 2024

Historic Market Size - Data Table on Global Aluminum Composite Panels Market 2020 - 2024 ($ million)

5.2 Type segment analysis 2020 - 2024

Historic Market Size - Type Segment 2020 - 2024 ($ million)

5.3 End-user segment analysis 2020 - 2024

Historic Market Size - End-user Segment 2020 - 2024 ($ million)

5.4 Product Type segment analysis 2020 - 2024

Historic Market Size - Product Type Segment 2020 - 2024 ($ million)

5.5 Geography segment analysis 2020 - 2024

Historic Market Size - Geography Segment 2020 - 2024 ($ million)

5.6 Country segment analysis 2020 - 2024

Historic Market Size - Country Segment 2020 - 2024 ($ million)

6. Qualitative Analysis

6.1 Impact of AI on Global Aluminum Composite Panels Market

6.2 Impact of Geopolitical Conflicts on Global Aluminum Composite Panels Market

7. Five Forces Analysis

7.1 Five forces summary

Five forces analysis - Comparison between 2025 and 2030

7.2 Bargaining power of buyers

Bargaining power of buyers - Impact of key factors 2025 and 2030

7.3 Bargaining power of suppliers

Bargaining power of suppliers - Impact of key factors in 2025 and 2030

7.4 Threat of new entrants

Threat of new entrants - Impact of key factors in 2025 and 2030

7.5 Threat of substitutes

Threat of substitutes - Impact of key factors in 2025 and 2030

7.6 Threat of rivalry

Threat of rivalry - Impact of key factors in 2025 and 2030

7.7 Market condition

Chart on Market condition - Five forces 2025 and 2030

8. Market Segmentation by Type

8.1 Market segments

Chart on Type - Market share 2025-2030 (%)
Data Table on Type - Market share 2025-2030 (%)

8.2 Comparison by Type

Chart on Comparison by Type
Data Table on Comparison by Type

8.3 Fire-resistant - Market size and forecast 2025-2030

Chart on Fire-resistant - Market size and forecast 2025-2030 ($ million)
Data Table on Fire-resistant - Market size and forecast 2025-2030 ($ million)
Chart on Fire-resistant - Year-over-year growth 2025-2030 (%)
Data Table on Fire-resistant - Year-over-year growth 2025-2030 (%)

8.4 Antibacterial - Market size and forecast 2025-2030

Chart on Antibacterial - Market size and forecast 2025-2030 ($ million)
Data Table on Antibacterial - Market size and forecast 2025-2030 ($ million)
Chart on Antibacterial - Year-over-year growth 2025-2030 (%)
Data Table on Antibacterial - Year-over-year growth 2025-2030 (%)

8.5 Antistatic - Market size and forecast 2025-2030

Chart on Antistatic - Market size and forecast 2025-2030 ($ million)
Data Table on Antistatic - Market size and forecast 2025-2030 ($ million)
Chart on Antistatic - Year-over-year growth 2025-2030 (%)
Data Table on Antistatic - Year-over-year growth 2025-2030 (%)

8.6 Market opportunity by Type

Market opportunity by Type ($ million)
Data Table on Market opportunity by Type ($ million)

9. Market Segmentation by End-user

9.1 Market segments

Chart on End-user - Market share 2025-2030 (%)
Data Table on End-user - Market share 2025-2030 (%)

9.2 Comparison by End-user

Chart on Comparison by End-user
Data Table on Comparison by End-user

9.3 Building and construction - Market size and forecast 2025-2030

Chart on Building and construction - Market size and forecast 2025-2030 ($ million)
Data Table on Building and construction - Market size and forecast 2025-2030 ($ million)
Chart on Building and construction - Year-over-year growth 2025-2030 (%)
Data Table on Building and construction - Year-over-year growth 2025-2030 (%)

9.4 Transportation - Market size and forecast 2025-2030

Chart on Transportation - Market size and forecast 2025-2030 ($ million)
Data Table on Transportation - Market size and forecast 2025-2030 ($ million)
Chart on Transportation - Year-over-year growth 2025-2030 (%)
Data Table on Transportation - Year-over-year growth 2025-2030 (%)

9.5 Others - Market size and forecast 2025-2030

Chart on Others - Market size and forecast 2025-2030 ($ million)
Data Table on Others - Market size and forecast 2025-2030 ($ million)
Chart on Others - Year-over-year growth 2025-2030 (%)
Data Table on Others - Year-over-year growth 2025-2030 (%)

9.6 Market opportunity by End-user

Market opportunity by End-user ($ million)
Data Table on Market opportunity by End-user ($ million)

10. Market Segmentation by Product Type

10.1 Market segments

Chart on Product Type - Market share 2025-2030 (%)
Data Table on Product Type - Market share 2025-2030 (%)

10.2 Comparison by Product Type

Chart on Comparison by Product Type
Data Table on Comparison by Product Type

10.3 PVDF - Market size and forecast 2025-2030

Chart on PVDF - Market size and forecast 2025-2030 ($ million)
Data Table on PVDF - Market size and forecast 2025-2030 ($ million)
Chart on PVDF - Year-over-year growth 2025-2030 (%)
Data Table on PVDF - Year-over-year growth 2025-2030 (%)

10.4 Polyester - Market size and forecast 2025-2030

Chart on Polyester - Market size and forecast 2025-2030 ($ million)
Data Table on Polyester - Market size and forecast 2025-2030 ($ million)
Chart on Polyester - Year-over-year growth 2025-2030 (%)
Data Table on Polyester - Year-over-year growth 2025-2030 (%)

10.5 Laminating coating - Market size and forecast 2025-2030

Chart on Laminating coating - Market size and forecast 2025-2030 ($ million)
Data Table on Laminating coating - Market size and forecast 2025-2030 ($ million)
Chart on Laminating coating - Year-over-year growth 2025-2030 (%)
Data Table on Laminating coating - Year-over-year growth 2025-2030 (%)

10.6 Oxide film - Market size and forecast 2025-2030

Chart on Oxide film - Market size and forecast 2025-2030 ($ million)
Data Table on Oxide film - Market size and forecast 2025-2030 ($ million)
Chart on Oxide film - Year-over-year growth 2025-2030 (%)
Data Table on Oxide film - Year-over-year growth 2025-2030 (%)

10.7 Market opportunity by Product Type

Market opportunity by Product Type ($ million)
Data Table on Market opportunity by Product Type ($ million)

11. Customer Landscape

11.1 Customer landscape overview

Analysis of price sensitivity, lifecycle, customer purchase basket, adoption rates, and purchase criteria

12. Geographic Landscape

12.1 Geographic segmentation

Chart on Market share by geography 2025-2030 (%)
Data Table on Market share by geography 2025-2030 (%)

12.2 Geographic comparison

Chart on Geographic comparison
Data Table on Geographic comparison

12.3 APAC - Market size and forecast 2025-2030

Chart on APAC - Market size and forecast 2025-2030 ($ million)
Data Table on APAC - Market size and forecast 2025-2030 ($ million)
Chart on APAC - Year-over-year growth 2025-2030 (%)
Data Table on APAC - Year-over-year growth 2025-2030 (%)
Chart on Regional Comparison - APAC
Data Table on Regional Comparison - APAC

12.3.1 China - Market size and forecast 2025-2030

Chart on China - Market size and forecast 2025-2030 ($ million)
Data Table on China - Market size and forecast 2025-2030 ($ million)
Chart on China - Year-over-year growth 2025-2030 (%)
Data Table on China - Year-over-year growth 2025-2030 (%)

12.3.2 India - Market size and forecast 2025-2030

Chart on India - Market size and forecast 2025-2030 ($ million)
Data Table on India - Market size and forecast 2025-2030 ($ million)
Chart on India - Year-over-year growth 2025-2030 (%)
Data Table on India - Year-over-year growth 2025-2030 (%)

12.3.3 Japan - Market size and forecast 2025-2030

Chart on Japan - Market size and forecast 2025-2030 ($ million)
Data Table on Japan - Market size and forecast 2025-2030 ($ million)
Chart on Japan - Year-over-year growth 2025-2030 (%)
Data Table on Japan - Year-over-year growth 2025-2030 (%)

12.3.4 South Korea - Market size and forecast 2025-2030

Chart on South Korea - Market size and forecast 2025-2030 ($ million)
Data Table on South Korea - Market size and forecast 2025-2030 ($ million)
Chart on South Korea - Year-over-year growth 2025-2030 (%)
Data Table on South Korea - Year-over-year growth 2025-2030 (%)

12.3.5 Indonesia - Market size and forecast 2025-2030

Chart on Indonesia - Market size and forecast 2025-2030 ($ million)
Data Table on Indonesia - Market size and forecast 2025-2030 ($ million)
Chart on Indonesia - Year-over-year growth 2025-2030 (%)
Data Table on Indonesia - Year-over-year growth 2025-2030 (%)

12.3.6 Australia - Market size and forecast 2025-2030

Chart on Australia - Market size and forecast 2025-2030 ($ million)
Data Table on Australia - Market size and forecast 2025-2030 ($ million)
Chart on Australia - Year-over-year growth 2025-2030 (%)
Data Table on Australia - Year-over-year growth 2025-2030 (%)

12.4 North America - Market size and forecast 2025-2030

Chart on North America - Market size and forecast 2025-2030 ($ million)
Data Table on North America - Market size and forecast 2025-2030 ($ million)
Chart on North America - Year-over-year growth 2025-2030 (%)
Data Table on North America - Year-over-year growth 2025-2030 (%)
Chart on Regional Comparison - North America
Data Table on Regional Comparison - North America

12.4.1 US - Market size and forecast 2025-2030

Chart on US - Market size and forecast 2025-2030 ($ million)
Data Table on US - Market size and forecast 2025-2030 ($ million)
Chart on US - Year-over-year growth 2025-2030 (%)
Data Table on US - Year-over-year growth 2025-2030 (%)

12.4.2 Canada - Market size and forecast 2025-2030

Chart on Canada - Market size and forecast 2025-2030 ($ million)
Data Table on Canada - Market size and forecast 2025-2030 ($ million)
Chart on Canada - Year-over-year growth 2025-2030 (%)
Data Table on Canada - Year-over-year growth 2025-2030 (%)

12.4.3 Mexico - Market size and forecast 2025-2030

Chart on Mexico - Market size and forecast 2025-2030 ($ million)
Data Table on Mexico - Market size and forecast 2025-2030 ($ million)
Chart on Mexico - Year-over-year growth 2025-2030 (%)
Data Table on Mexico - Year-over-year growth 2025-2030 (%)

12.5 Europe - Market size and forecast 2025-2030

Chart on Europe - Market size and forecast 2025-2030 ($ million)
Data Table on Europe - Market size and forecast 2025-2030 ($ million)
Chart on Europe - Year-over-year growth 2025-2030 (%)
Data Table on Europe - Year-over-year growth 2025-2030 (%)
Chart on Regional Comparison - Europe
Data Table on Regional Comparison - Europe

12.5.1 Germany - Market size and forecast 2025-2030

Chart on Germany - Market size and forecast 2025-2030 ($ million)
Data Table on Germany - Market size and forecast 2025-2030 ($ million)
Chart on Germany - Year-over-year growth 2025-2030 (%)
Data Table on Germany - Year-over-year growth 2025-2030 (%)

12.5.2 UK - Market size and forecast 2025-2030

Chart on UK - Market size and forecast 2025-2030 ($ million)
Data Table on UK - Market size and forecast 2025-2030 ($ million)
Chart on UK - Year-over-year growth 2025-2030 (%)
Data Table on UK - Year-over-year growth 2025-2030 (%)

12.5.3 France - Market size and forecast 2025-2030

Chart on France - Market size and forecast 2025-2030 ($ million)
Data Table on France - Market size and forecast 2025-2030 ($ million)
Chart on France - Year-over-year growth 2025-2030 (%)
Data Table on France - Year-over-year growth 2025-2030 (%)

12.5.4 Italy - Market size and forecast 2025-2030

Chart on Italy - Market size and forecast 2025-2030 ($ million)
Data Table on Italy - Market size and forecast 2025-2030 ($ million)
Chart on Italy - Year-over-year growth 2025-2030 (%)
Data Table on Italy - Year-over-year growth 2025-2030 (%)

12.5.5 Spain - Market size and forecast 2025-2030

Chart on Spain - Market size and forecast 2025-2030 ($ million)
Data Table on Spain - Market size and forecast 2025-2030 ($ million)
Chart on Spain - Year-over-year growth 2025-2030 (%)
Data Table on Spain - Year-over-year growth 2025-2030 (%)

12.5.6 The Netherlands - Market size and forecast 2025-2030

Chart on The Netherlands - Market size and forecast 2025-2030 ($ million)
Data Table on The Netherlands - Market size and forecast 2025-2030 ($ million)
Chart on The Netherlands - Year-over-year growth 2025-2030 (%)
Data Table on The Netherlands - Year-over-year growth 2025-2030 (%)

12.6 Middle East and Africa - Market size and forecast 2025-2030

Chart on Middle East and Africa - Market size and forecast 2025-2030 ($ million)
Data Table on Middle East and Africa - Market size and forecast 2025-2030 ($ million)
Chart on Middle East and Africa - Year-over-year growth 2025-2030 (%)
Data Table on Middle East and Africa - Year-over-year growth 2025-2030 (%)
Chart on Regional Comparison - Middle East and Africa
Data Table on Regional Comparison - Middle East and Africa

12.6.1 Saudi Arabia - Market size and forecast 2025-2030

Chart on Saudi Arabia - Market size and forecast 2025-2030 ($ million)
Data Table on Saudi Arabia - Market size and forecast 2025-2030 ($ million)
Chart on Saudi Arabia - Year-over-year growth 2025-2030 (%)
Data Table on Saudi Arabia - Year-over-year growth 2025-2030 (%)

12.6.2 UAE - Market size and forecast 2025-2030

Chart on UAE - Market size and forecast 2025-2030 ($ million)
Data Table on UAE - Market size and forecast 2025-2030 ($ million)
Chart on UAE - Year-over-year growth 2025-2030 (%)
Data Table on UAE - Year-over-year growth 2025-2030 (%)

12.6.3 Turkey - Market size and forecast 2025-2030

Chart on Turkey - Market size and forecast 2025-2030 ($ million)
Data Table on Turkey - Market size and forecast 2025-2030 ($ million)
Chart on Turkey - Year-over-year growth 2025-2030 (%)
Data Table on Turkey - Year-over-year growth 2025-2030 (%)

12.6.4 South Africa - Market size and forecast 2025-2030

Chart on South Africa - Market size and forecast 2025-2030 ($ million)
Data Table on South Africa - Market size and forecast 2025-2030 ($ million)
Chart on South Africa - Year-over-year growth 2025-2030 (%)
Data Table on South Africa - Year-over-year growth 2025-2030 (%)

12.6.5 Israel - Market size and forecast 2025-2030

Chart on Israel - Market size and forecast 2025-2030 ($ million)
Data Table on Israel - Market size and forecast 2025-2030 ($ million)
Chart on Israel - Year-over-year growth 2025-2030 (%)
Data Table on Israel - Year-over-year growth 2025-2030 (%)

12.7 South America - Market size and forecast 2025-2030

Chart on South America - Market size and forecast 2025-2030 ($ million)
Data Table on South America - Market size and forecast 2025-2030 ($ million)
Chart on South America - Year-over-year growth 2025-2030 (%)
Data Table on South America - Year-over-year growth 2025-2030 (%)
Chart on Regional Comparison - South America
Data Table on Regional Comparison - South America

12.7.1 Brazil - Market size and forecast 2025-2030

Chart on Brazil - Market size and forecast 2025-2030 ($ million)
Data Table on Brazil - Market size and forecast 2025-2030 ($ million)
Chart on Brazil - Year-over-year growth 2025-2030 (%)
Data Table on Brazil - Year-over-year growth 2025-2030 (%)

12.7.2 Argentina - Market size and forecast 2025-2030

Chart on Argentina - Market size and forecast 2025-2030 ($ million)
Data Table on Argentina - Market size and forecast 2025-2030 ($ million)
Chart on Argentina - Year-over-year growth 2025-2030 (%)
Data Table on Argentina - Year-over-year growth 2025-2030 (%)

12.7.3 Chile - Market size and forecast 2025-2030

Chart on Chile - Market size and forecast 2025-2030 ($ million)
Data Table on Chile - Market size and forecast 2025-2030 ($ million)
Chart on Chile - Year-over-year growth 2025-2030 (%)
Data Table on Chile - Year-over-year growth 2025-2030 (%)

12.8 Market opportunity by geography

Market opportunity by geography ($ million)
Data Tables on Market opportunity by geography ($ million)

13. Drivers, Challenges, and Opportunity

13.1 Market drivers

Rapid urbanization and growth in construction sector
Architectural demand for aesthetically versatile and lightweight materials
Increasing emphasis on sustainability and fire safety in buildings

13.2 Market challenges

Volatility of raw material prices
Stringent and evolving fire safety regulations
Intense competition from substitute materials

13.3 Impact of drivers and challenges

Impact of drivers and challenges in 2025 and 2030

13.4 Market opportunities

Shift toward non-combustible cores as new standard
Growing emphasis on circularity and sustainable material certifications
Rise of hyper-realistic finishes and digital customization

14. Competitive Landscape

14.1 Overview

14.2

Overview on criticality of inputs and factors of differentiation

14.3 Landscape disruption

Overview on factors of disruption

14.4 Industry risks

Impact of key risks on business

15. Competitive Analysis

15.1 Companies profiled

Companies covered

15.2 Company ranking index

15.3 Market positioning of companies

Matrix on companies position and classification

15.4 3A Composites Holding AG

3A Composites Holding AG - Overview
3A Composites Holding AG - Product / Service
3A Composites Holding AG - Key offerings
SWOT

15.5 Alcadex

Alcadex - Overview
Alcadex - Product / Service
Alcadex - Key offerings
SWOT

15.6 Almaxco

Almaxco - Overview
Almaxco - Product / Service
Almaxco - Key offerings
SWOT

15.7 ALPOLIC Materials

ALPOLIC Materials - Overview
ALPOLIC Materials - Product / Service
ALPOLIC Materials - Key offerings
SWOT

15.8 Alubond U.S.A.

Alubond U.S.A. - Overview
Alubond U.S.A. - Product / Service
Alubond U.S.A. - Key offerings
SWOT

15.9 Alucoil SAU

Alucoil SAU - Overview
Alucoil SAU - Product / Service
Alucoil SAU - Key offerings
SWOT

15.10 Alucomat

Alucomat - Overview
Alucomat - Product / Service
Alucomat - Key offerings
SWOT

15.11 Alucoworld

Alucoworld - Overview
Alucoworld - Product / Service
Alucoworld - Key offerings
SWOT

15.12 Aludecor Lamination Pvt. Ltd.

Aludecor Lamination Pvt. Ltd. - Overview
Aludecor Lamination Pvt. Ltd. - Product / Service
Aludecor Lamination Pvt. Ltd. - Key offerings
SWOT

15.13 Arconic Corp.

Arconic Corp. - Overview
Arconic Corp. - Product / Service
Arconic Corp. - Key offerings
SWOT

15.14 Euro Panel Products Ltd.

Euro Panel Products Ltd. - Overview
Euro Panel Products Ltd. - Product / Service
Euro Panel Products Ltd. - Key offerings
SWOT

15.15 Fangda Group

Fangda Group - Overview
Fangda Group - Product / Service
Fangda Group - Key offerings
SWOT

15.16 LeBoom DSTAR

LeBoom DSTAR - Overview
LeBoom DSTAR - Product / Service
LeBoom DSTAR - Key offerings
SWOT

15.17 Multipanel UK Ltd.

Multipanel UK Ltd. - Overview
Multipanel UK Ltd. - Product / Service
Multipanel UK Ltd. - Key offerings
SWOT

15.18 Pioneer Panels

Pioneer Panels - Overview
Pioneer Panels - Product / Service
Pioneer Panels - Key offerings
SWOT

16. Appendix

16.1 Scope of the report

Market definition
Objectives
Notes and caveats

16.2 Inclusions and exclusions checklist

Inclusions checklist
Exclusions checklist

16.3 Currency conversion rates for US$

16.4 Research methodology

16.5 Data procurement

Information sources

16.6 Data validation

16.7 Validation techniques employed for market sizing

16.8 Data synthesis

16.9 360 degree market analysis

16.10 List of abbreviations

Research Methodology

Technavio presents a detailed picture of the market by way of study, synthesis, and summation of data from multiple sources. The analysts have presented the various facets of the market with a particular focus on identifying the key industry influencers. The data thus presented is comprehensive, reliable, and the result of extensive research, both primary and secondary.

INFORMATION SOURCES

Primary sources

  • Manufacturers and suppliers
  • Channel partners
  • Industry experts
  • Strategic decision makers

Secondary sources

  • Industry journals and periodicals
  • Government data
  • Financial reports of key industry players
  • Historical data
  • Press releases

DATA ANALYSIS

Data Synthesis

  • Collation of data
  • Estimation of key figures
  • Analysis of derived insights

Data Validation

  • Triangulation with data models
  • Reference against proprietary databases
  • Corroboration with industry experts

REPORT WRITING

Qualitative

  • Market drivers
  • Market challenges
  • Market trends
  • Five forces analysis

Quantitative

  • Market size and forecast
  • Market segmentation
  • Geographical insights
  • Competitive landscape

Interested in this report?

Get your sample now to see our research methodology and insights!

Download Now

Frequently Asked Questions

Aluminum Composite Panels market growth will increase by USD 4220.0 million during 2026-2030.

The Aluminum Composite Panels market is expected to grow at a CAGR of 9.1% during 2026-2030.

Aluminum Composite Panels market is segmented by Type (Fire-resistant, Antibacterial, Antistatic) End-user (Building and construction, Transportation, Others) Product type (PVDF, Polyester, Laminating coating, Oxide film)

3A Composites Holding AG, Alcadex, Almaxco, ALPOLIC Materials, Alubond U.S.A., Alucoil SAU, Alucomat, Alucoworld, Aludecor Lamination Pvt. Ltd., Arconic Corp., Euro Panel Products Ltd., Fangda Group, Harwal Group, LeBoom DSTAR, Multipanel UK Ltd., Pioneer Panels, Virgo Group, Viva Composite Panel Pvt. Ltd., Yaret Industrial Group Co. Ltd. are a few of the key vendors in the Aluminum Composite Panels market.

APAC will register the highest growth rate of 52.4% among the other regions. Therefore, the Aluminum Composite Panels market in APAC is expected to garner significant business opportunities for the vendors during the forecast period.

China, India, Japan, South Korea, Indonesia, Australia, US, Canada, Mexico, Germany, UK, France, Italy, Spain, The Netherlands, Saudi Arabia, UAE, Turkey, South Africa, Israel, Brazil, Argentina, Chile

  • Rapid urbanization and growth in construction sector is the driving factor this market.

The Aluminum Composite Panels market vendors should focus on grabbing business opportunities from the Type segment as it accounted for the largest market share in the base year.
RIA - Research AI Assistant
Ask RIA
