Aluminum Extrusion Market Size 2026-2030
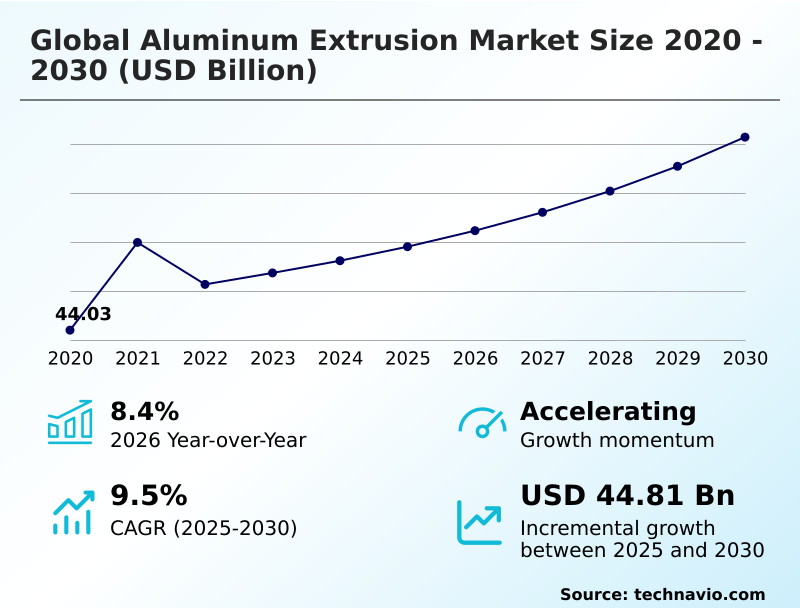
The aluminum extrusion market size is valued to increase by USD 44.81 billion, at a CAGR of 9.5% from 2025 to 2030. Aerospace modernization and unyielding pursuit of fuel efficiency will drive the aluminum extrusion market.
Major Market Trends & Insights
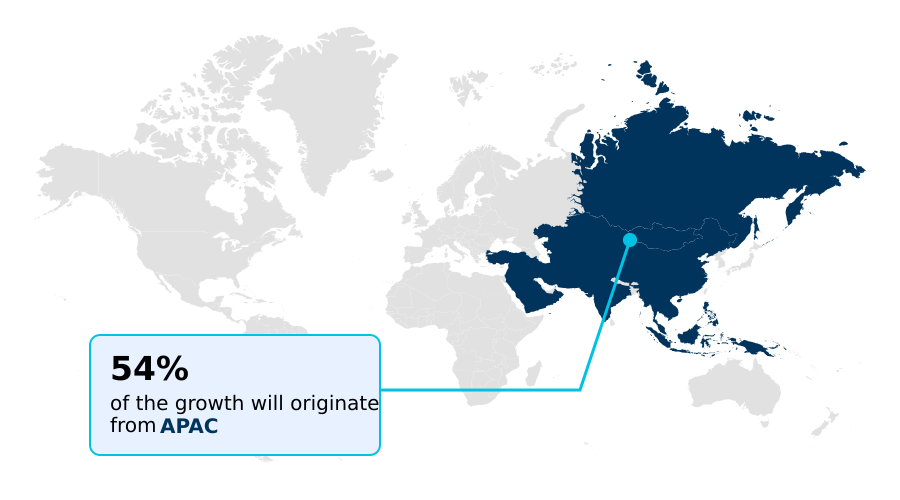
- APAC dominated the market and accounted for a 54.4% growth during the forecast period.
- By End-user - A and T segment was valued at USD 26.79 billion in 2024
- By Product - Mill-finished segment accounted for the largest market revenue share in 2024
Market Size & Forecast
- Market Opportunities: USD 78.96 billion
- Market Future Opportunities: USD 44.81 billion
- CAGR from 2025 to 2030 : 9.5%
Market Summary
- The aluminum extrusion market is undergoing a significant transformation, driven by imperatives for energy efficiency and advanced material performance across key sectors. In the automotive industry, the shift to electric vehicles (EVs) creates substantial demand for lightweighting strategies, where aluminum extrusions are critical for manufacturing battery enclosures and structural components that extend vehicle range.
- Similarly, the building and construction sector leverages thermally broken extrusion profiles to meet stringent green building codes. A primary business scenario involves automotive OEMs collaborating with extruders to co-design custom profiles for new EV platforms, a process that balances structural integrity, thermal management, and manufacturability. This deep integration is essential for optimizing performance.
- However, the industry navigates challenges like the price volatility of aluminum billet and the need for sustainable sourcing of low-carbon primary aluminum. Adherence to circular economy principles is no longer optional but a core competitive differentiator, influencing supply chain decisions and investment in advanced recycling technologies to produce high-recycled-content feedstocks. The ability to provide value-added fabrication further enhances market position.
What will be the Size of the Aluminum Extrusion Market during the forecast period?
Get Key Insights on Market Forecast (PDF) Get Free Sample
How is the Aluminum Extrusion Market Segmented?
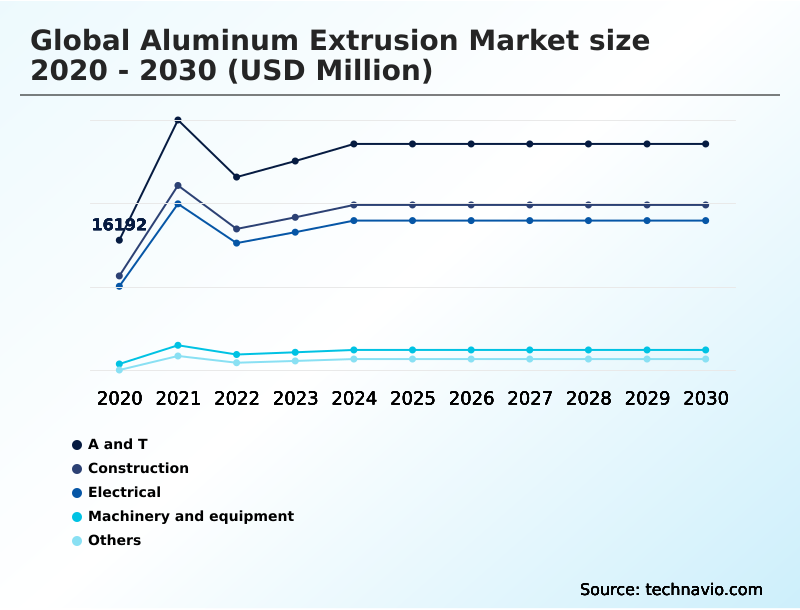
The aluminum extrusion industry research report provides comprehensive data (region-wise segment analysis), with forecasts and estimates in "USD million" for the period 2026-2030, as well as historical data from 2020-2024 for the following segments.
- End-user
- A and T
- Construction
- Electrical
- Machinery and equipment
- Others
- Product
- Mill-finished
- Anodized
- Powder coated
- Grade type
- 6000 series
- 1000 series
- 7000 series
- 2000 series
- Others
- Geography
- APAC
- China
- India
- Japan
- Europe
- Germany
- Italy
- UK
- North America
- US
- Canada
- Mexico
- Middle East and Africa
- Saudi Arabia
- UAE
- Turkey
- South America
- Brazil
- Argentina
- Rest of World (ROW)
- APAC
By End-user Insights
The a and t segment is estimated to witness significant growth during the forecast period.
The A and T segment is a technically demanding driver for the market, centered on vehicle lightweighting strategies. The imperative to enhance fuel efficiency and extend electric vehicle range propels demand for materials with a high strength-to-weight ratio.
Extruded aluminum profiles are integral to applications like body-in-white structures, battery enclosures, and crash management systems. The design flexibility of the extrusion process enables complex, multi-hollow profiles that consolidate functions, simplifying assembly.
A recent automotive platform innovation achieved a ten percent increase in volumetric energy density by using a battery tray system made from interlocking aluminum extrusion profiles.
This highlights the role of advanced fabrication techniques and precision bending in meeting stringent safety and performance standards, utilizing custom profiles for optimal structural integrity.
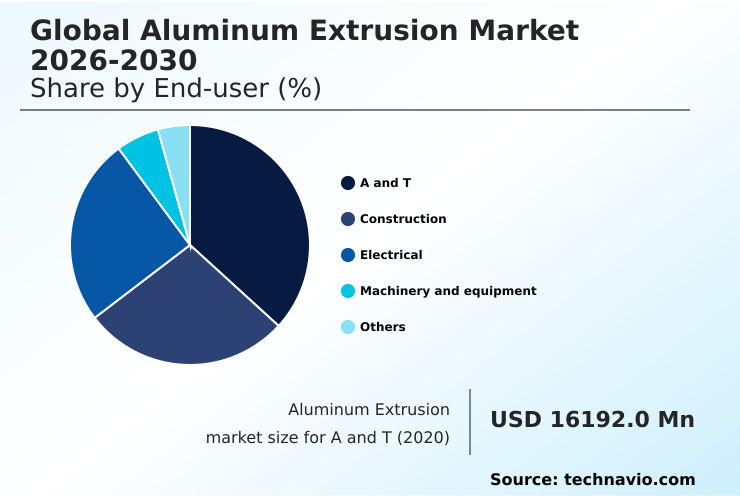
The A and T segment was valued at USD 26.79 billion in 2024 and showed a gradual increase during the forecast period.
Regional Analysis
APAC is estimated to contribute 54.4% to the growth of the global market during the forecast period.Technavio’s analysts have elaborately explained the regional trends and drivers that shape the market during the forecast period.
See How Aluminum Extrusion Market Demand is Rising in APAC Get Free Sample
The geographic landscape of the market is dominated by APAC, which accounts for 54.4% of the incremental growth, largely due to massive infrastructure investments and its position as a global manufacturing hub.
Countries like China and India are major consumers of architectural profiles for construction.
Europe, contributing 23.05% to growth, represents a sophisticated market focused on high-performance industrial profiles and automotive components, driven by stringent environmental regulations and a focus on green building codes.
North America emphasizes value-added fabrication for aerospace and the growing EV sector. The region's focus on sustainable construction materials and lightweighting strategies supports demand for advanced extrusion process capabilities.
The Middle East and Africa are characterized by large-scale construction projects requiring custom-designed aluminum extrusions, while South America is an emerging market with growing industrial applications.
Market Dynamics
Our researchers analyzed the data with 2025 as the base year, along with the key drivers, trends, and challenges. A holistic analysis of drivers will help companies refine their marketing strategies to gain a competitive advantage.
- Strategic positioning in the market increasingly depends on mastering specialized applications and sustainable practices. The demand for high strength-to-weight ratio for EV design is reshaping automotive supply chains, making aluminum extrusion for electric vehicle battery enclosures a critical growth segment.
- Concurrently, the push for energy efficiency in construction elevates the importance of thermally broken profiles for green buildings and custom aluminum extrusion for architectural facades, where both performance and aesthetics are paramount. Companies are leveraging advanced alloys for aerospace structural components to meet rigorous safety and lightweighting standards.
- The market for powder coated aluminum profiles for construction continues to expand due to its durability and design versatility, while precision aluminum extrusions for consumer electronics cater to the demand for sleek, durable, and thermally efficient devices. The adoption of low-carbon aluminum for sustainable manufacturing is becoming a key differentiator, influencing procurement decisions across industries.
- Niche applications, such as corrosion-resistant extrusions for marine applications, offer high-margin opportunities. Leading firms are expanding their value-added fabrication services for extruders to move beyond commodity supply. This includes specializing in 6000 series aluminum extrusions for automotive use and 7000 series aluminum alloys for aerospace, where material properties are non-negotiable.
- The quality of anodized aluminum finishes for architectural use can significantly impact project value. However, firms must navigate aluminum billet pricing and market volatility. Success hinges on expertise in extrusion die design for complex profiles and implementing effective lightweighting strategies using aluminum extrusions. Modular framing systems with t-slot extrusions are enabling flexible factory automation.
- The focus on circular economy in aluminum extrusion production is intensifying, demanding better thermal management with aluminum heat sinks and improved supply chain security for aluminum billets. Firms that excel in these specialized areas are better positioned to capture value, demonstrating performance advantages where custom solutions outperform standard offerings by a significant margin.
What are the key market drivers leading to the rise in the adoption of Aluminum Extrusion Industry?
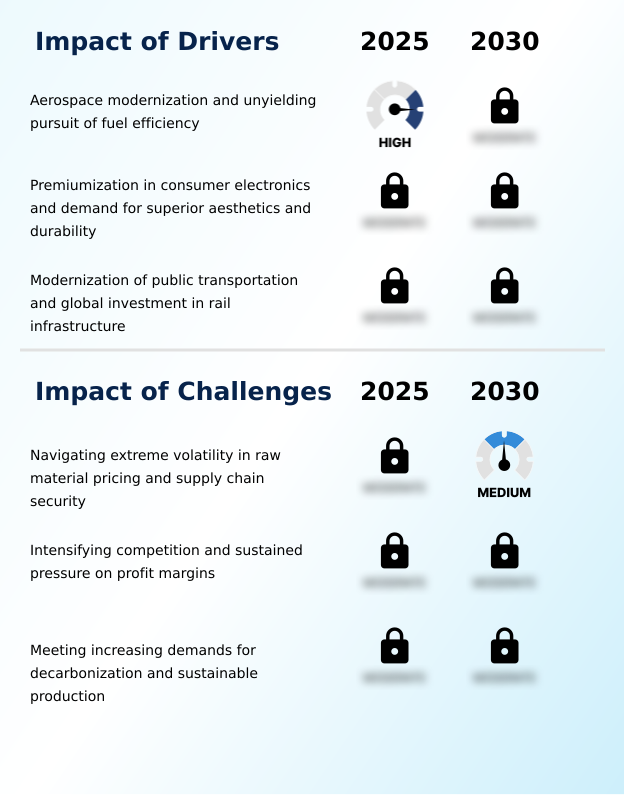
- Aerospace modernization, coupled with the unyielding pursuit of fuel efficiency, is a key driver for the market.
- Market growth is propelled by several key drivers, notably modernization in transportation and the premiumization trend in consumer goods.
- Global investment in public transportation, including high-speed rail, creates consistent demand for large, interlocking aluminum panels for railcar bodies, prized for their ability to reduce operational cost savings and environmental impact.
- In consumer electronics, the unibody chassis of flagship laptops are now crafted from a single 6000-series aluminum extrusion, enabling designs that are fifteen percent thinner and twenty percent more rigid while improving thermal performance through the material's utility as a passive heat sink.
- This pursuit of superior aesthetics and durability with a high-quality surface finish is a powerful force, as design flexibility allows for product differentiation and enhanced structural integrity across a growing range of high-value applications.
What are the market trends shaping the Aluminum Extrusion Industry?
- The market is increasingly defined by the ascendancy of low-carbon and circular aluminum. This shift reflects a strategic move toward sustainable production driven by regulatory and consumer demand.
- Key trends are reshaping the market, with a primary shift toward sustainable production and advanced applications. The focus on a circular economy is driving demand for green aluminum and high-recycled-content feedstocks, supported by advanced scrap sorting and verifiable environmental product declarations.
- In the automotive sector, the transition to electric mobility is a major catalyst, where lightweight integrated structural components are essential for extending battery range. One leading automaker now sources aluminum with a minimum of 75 percent post-consumer scrap for its EV platforms.
- Concurrently, the proliferation of complex, custom-designed aluminum extrusions in green buildings is accelerating, driven by stringent energy efficiency standards. New regulations in some cities now mandate window systems with U-values so low that advanced thermally broken extrusion profiles are a practical necessity, spurring architectural innovation.
What challenges does the Aluminum Extrusion Industry face during its growth?
- Navigating extreme volatility in raw material pricing and ensuring supply chain security are key challenges affecting industry growth.
- The market confronts significant challenges, including raw material volatility and intense competitive pressure that impact profitability. The price of aluminum billet is subject to unpredictable fluctuations, as energy can account for up to a third of primary aluminum production costs, creating major margin management difficulties.
- This supply chain fragility is compounded by intense market fragmentation and competition from low-cost imports, particularly for commodity profiles. This environment has driven profit margins for some extruders to a seven-year low. Furthermore, the industry faces escalating decarbonization pressure, requiring investment in sustainable sourcing strategies and technologies to access certified low-carbon aluminum.
- Navigating this landscape demands a focus on vertical integration or differentiation through high-value, specialized products to escape the pricing pressures of the commodity segment.
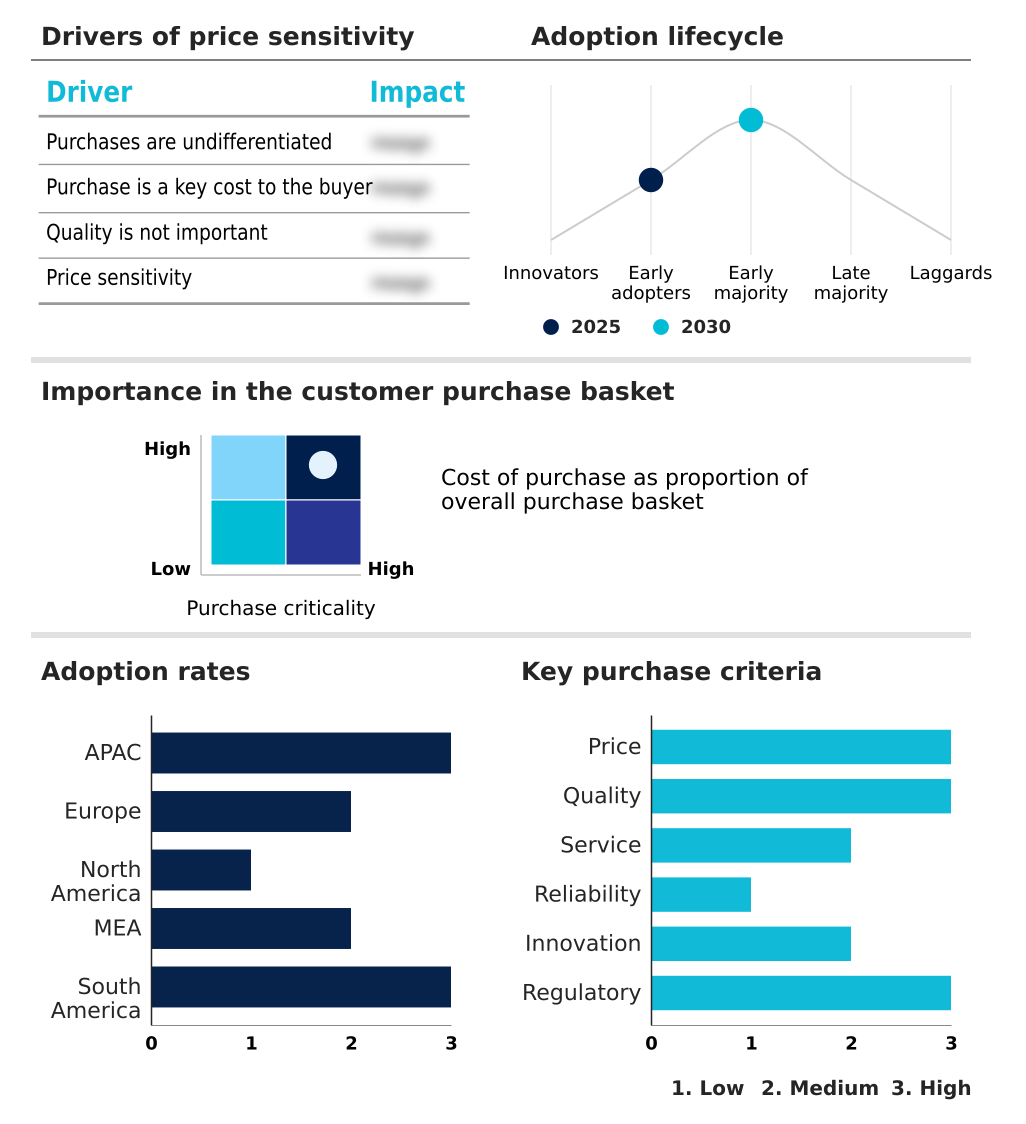
Exclusive Technavio Analysis on Customer Landscape
The aluminum extrusion market forecasting report includes the adoption lifecycle of the market, covering from the innovator’s stage to the laggard’s stage. It focuses on adoption rates in different regions based on penetration. Furthermore, the aluminum extrusion market report also includes key purchase criteria and drivers of price sensitivity to help companies evaluate and develop their market growth analysis strategies.
Customer Landscape of Aluminum Extrusion Industry
Competitive Landscape
Companies are implementing various strategies, such as strategic alliances, aluminum extrusion market forecast, partnerships, mergers and acquisitions, geographical expansion, and product/service launches, to enhance their presence in the industry.
Al Ghurair Group - Delivering lightweight strength through advanced aluminum extrusion solutions for automotive crash management systems and aerospace structures.
The industry research and growth report includes detailed analyses of the competitive landscape of the market and information about key companies, including:
- Al Ghurair Group
- Arconic Corp.
- Bahrain Aluminum Extrusion Co.
- Century Aluminum Co.
- Century Extrusions Limited.
- Constellium SE
- Guang Ya Aluminium
- Henan Chalco
- Jindal Aluminium Ltd.
- Kaiser Aluminum Corp.
- National Material Company L.P
- Norsk Hydro ASA
- Olympus Capital Holdings
- Qatar Aluminum Extrusion Co.
- Rio Tinto Ltd.
- Sankyo Tateyama Inc.
- Tredegar Corp.
- UACJ Corp.
- United Co. RUSAL
- Vimetco Extrusion Srl
Qualitative and quantitative analysis of companies has been conducted to help clients understand the wider business environment as well as the strengths and weaknesses of key industry players. Data is qualitatively analyzed to categorize companies as pure play, category-focused, industry-focused, and diversified; it is quantitatively analyzed to categorize companies as dominant, leading, strong, tentative, and weak.
Recent Development and News in Aluminum extrusion market
- In August 2025, Hydro secured a supply agreement with a major German automaker for its Circal aluminum, containing a minimum of 75 percent post-consumer scrap, for a next-generation electric vehicle platform.
- In September 2025, Novelis completed a new production line in North America dedicated to manufacturing complex, multi-port extrusion profiles for electric vehicle battery enclosures.
- In October 2025, the European Union Aviation Safety Agency (EASA) released its Sustainable Aviation Framework 2035, introducing mandatory weight-to-thrust ratio targets for new aircraft designs after 2030, compelling reliance on advanced lightweight materials.
- In May 2025, the Indian Ministry of Railways approved its National High-Speed Rail Corridors Phase II project, with tender documents mandating friction-stir-welded aluminum extrusions for all new railcar bodies.
Dive into Technavio’s robust research methodology, blending expert interviews, extensive data synthesis, and validated models for unparalleled Aluminum Extrusion Market insights. See full methodology.
| Market Scope | |
|---|---|
| Page number | 308 |
| Base year | 2025 |
| Historic period | 2020-2024 |
| Forecast period | 2026-2030 |
| Growth momentum & CAGR | Accelerate at a CAGR of 9.5% |
| Market growth 2026-2030 | USD 44814.7 million |
| Market structure | Fragmented |
| YoY growth 2025-2026(%) | 8.4% |
| Key countries | China, India, Japan, South Korea, Indonesia, Australia, Germany, Italy, UK, France, Spain, The Netherlands, US, Canada, Mexico, Saudi Arabia, UAE, Turkey, South Africa, Israel, Brazil, Argentina and Chile |
| Competitive landscape | Leading Companies, Market Positioning of Companies, Competitive Strategies, and Industry Risks |
Research Analyst Overview
- The market is evolving beyond commodity supply, with value now concentrated in specialized, high-performance applications. The ascendance of lightweighting strategies across automotive and aerospace sectors is a primary catalyst, demanding high-strength aluminum alloys and complex, near-net-shape profiles.
- The extrusion process itself is advancing to create intricate multi-hollow profiles for applications like EV battery enclosures and thermal management systems, where both electrical conductivity and thermal conductivity are critical. In parallel, the building and construction sector's adoption of green building codes is driving demand for sophisticated architectural profiles and sustainable construction materials, including thermally broken extrusion profiles.
- A key boardroom consideration is the investment in sustainable sourcing and production, including low-carbon primary aluminum and high-recycled-content feedstocks, to align with circular economy principles. Firms are achieving differentiation through value-added fabrication and downstream fabrication, offering finished automotive components and custom profiles.
- For instance, new frame designs using a hollow-chamber aluminum extrusion profile have proven to be forty percent lighter than previous steel designs, directly improving manufacturability and reducing assembly time. Success hinges on mastering these advanced industrial profiles and meeting the demand for superior corrosion resistance and surface finish.
What are the Key Data Covered in this Aluminum Extrusion Market Research and Growth Report?
-
What is the expected growth of the Aluminum Extrusion Market between 2026 and 2030?
-
USD 44.81 billion, at a CAGR of 9.5%
-
-
What segmentation does the market report cover?
-
The report is segmented by End-user (A and T, Construction, Electrical, Machinery and equipment, and Others), Product (Mill-finished, Anodized, and Powder coated), Grade Type (6000 series, 1000 series, 7000 series, 2000 series, and Others) and Geography (APAC, Europe, North America, Middle East and Africa, South America)
-
-
Which regions are analyzed in the report?
-
APAC, Europe, North America, Middle East and Africa and South America
-
-
What are the key growth drivers and market challenges?
-
Aerospace modernization and unyielding pursuit of fuel efficiency, Navigating extreme volatility in raw material pricing and supply chain security
-
-
Who are the major players in the Aluminum Extrusion Market?
-
Al Ghurair Group, Arconic Corp., Bahrain Aluminum Extrusion Co., Century Aluminum Co., Century Extrusions Limited., Constellium SE, Guang Ya Aluminium, Henan Chalco, Jindal Aluminium Ltd., Kaiser Aluminum Corp., National Material Company L.P, Norsk Hydro ASA, Olympus Capital Holdings, Qatar Aluminum Extrusion Co., Rio Tinto Ltd., Sankyo Tateyama Inc., Tredegar Corp., UACJ Corp., United Co. RUSAL and Vimetco Extrusion Srl
-
Market Research Insights
- The market's dynamics are shaped by a premiumization trend and the pursuit of operational efficiency, where advanced materials directly impact product design and performance.
- In consumer electronics, for instance, a unibody chassis created from a single, custom-designed 6000-series aluminum extrusion can make a device fifteen percent thinner and twenty percent more rigid than its predecessor, a clear differentiator in a competitive landscape. This design flexibility enhances both durability and aesthetics.
- Similarly, in automotive applications, an integrated battery tray design using interlocking aluminum extrusion profiles has led to a ten percent increase in volumetric energy density. Such innovations in integrated structural components underscore the material's value in achieving performance gains while optimizing manufacturing, showcasing how sustainable production and circularity are becoming key value propositions.
We can help! Our analysts can customize this aluminum extrusion market research report to meet your requirements.
 RIA -
RIA - 
