Amorphous Metal Cores Market Size 2024-2028
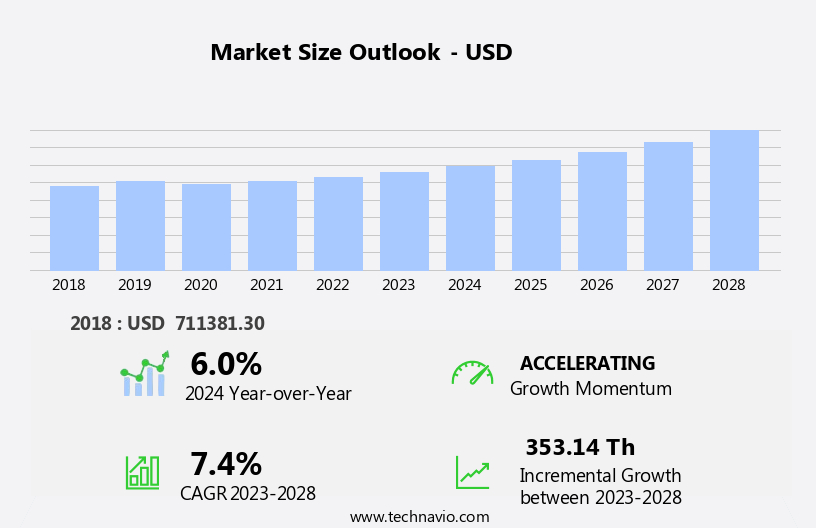
The amorphous metal cores market size is forecast to increase by USD 353.14 thousand at a CAGR of 7.4% between 2023 and 2028.
- The market is experiencing significant growth due to several key factors. One of the primary drivers is the increasing investment in power and energy infrastructure worldwide. This investment is leading to a higher demand for energy-efficient transformers, which are predominantly made using amorphous metal cores. Another trend influencing the market is the rising awareness of energy conservation and the need for sustainable energy solutions.
- However, the high production costs associated with amorphous metal cores, including amorphous steel, remain a significant challenge for market growth. Despite this, the market is expected to continue expanding as the benefits of using amorphous metal cores in power transformers become more widely recognized. These benefits include improved core efficiency, reduced core losses, and enhanced transformer performance. Overall, the market is poised for steady growth in the coming years, driven by the need for energy-efficient transformers and the ongoing investment in power and energy infrastructure.
What will be the Size of the Amorphous Metal Cores Market during the Forecast Period?
- The market encompasses the production and supply of amorphous alloys, primarily used as cores in electrical transformers. Amorphous metal cores offer enhanced magnetic properties, including low hysteresis loss, minimal eddy current loss, and high saturation magnetic flux, compared to traditional crystalline silicon steel. These advantages lead to increased energy efficiency and reduced electricity loss in power transmission, making amorphous metal cores an attractive solution for advanced electrical transformers in various applications. As energy costs continue to rise and environmental concerns escalate, the demand for energy-efficient products is on the rise. Amorphous metal cores contribute to this trend by reducing Co2 emissions and improving the overall carbon footprint of power infrastructure.
- Their use in distribution transformers, smart grids, renewable energy systems, electric cars, and other electrical machineries is expected to expand. Despite their higher initial cost, the savings from reduced energy consumption and longer product life offset the investment. The amorphous metal, a non-crystalline substance, is produced through a process of ultra-rapid quenching, resulting in a unique magnetic property profile. The thickness of amorphous metal cores can be customized to meet specific electrical equipment dimensions, further enhancing their versatility. The market is expected to grow as the world transitions to more energy-efficient solutions and focuses on reducing the environmental impact of power transmission and electrical equipment.
How is this Amorphous Metal Cores Industry segmented and which is the largest segment?
The amorphous metal cores industry research report provides comprehensive data (region-wise segment analysis), with forecasts and estimates in "USD thousand" for the period 2024-2028, as well as historical data from 2018-2022 for the following segments.
- Type
- Iron
- Cobalt
- Application
- Transformers
- Inductors
- Electric motors
- Geography
- APAC
- China
- India
- Japan
- South Korea
- Singapore
- North America
- Canada
- US
- Europe
- Germany
- UK
- South America
- Middle East and Africa
- APAC
By Type Insights
- The iron segment is estimated to witness significant growth during the forecast period.
Amorphous metal cores, fabricated from metallic glass, are a significant component in electrical and electronic industries due to their unique magnetic properties. These cores, primarily made of iron-based amorphous alloys, exhibit superior magnetic properties, leading to reduced core losses in distribution transformers. The global trend towards energy efficiency in power distribution systems and the integration of renewable energy sources into the power grid are major factors driving the growth of the market. The non-crystalline structure of amorphous metal, achieved through ultra-rapid quenching techniques, results in lower hysteresis loss, magnetic induction, and eddy current loss compared to crystalline silicon steel. The increasing adoption of energy-efficient solutions in electrification projects, renewable energy systems such as wind farms, and electrical equipment is further boosting market demand.
Amorphous metal cores' magnetic properties, including high magnetization and electrical resistivity, make them suitable for advanced electrical transformers, smart grids, electric cars, and various electrical machineries. The market for these cores is expected to continue growing as the world invests in power infrastructure and seeks to minimize electricity loss and CO2 emissions.
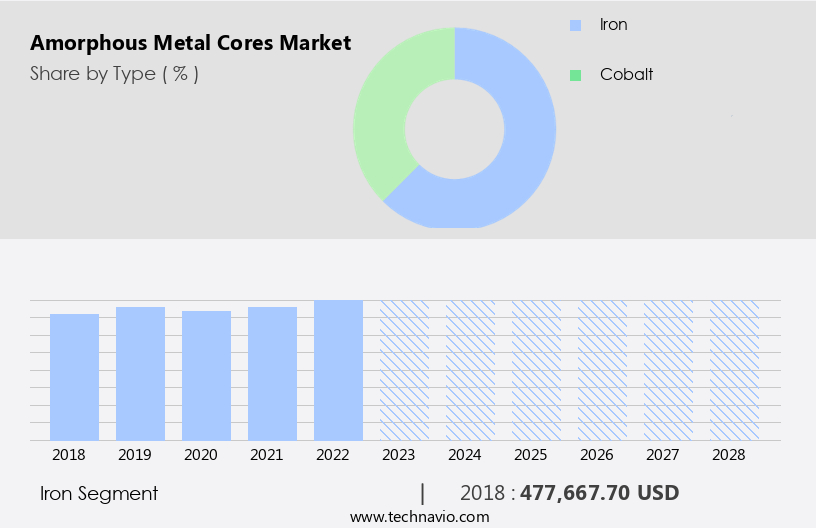
Get a glance at the Amorphous Metal Cores Industry report of share of various segments Request Free Sample
The Iron segment was valued at USD 477,667.70 in 2018 and showed a gradual increase during the forecast period.
Regional Analysis
- APAC is estimated to contribute 77% to the growth of the global market during the forecast period.
Technavio's analysts have elaborately explained the regional trends and drivers that shape the market during the forecast period.
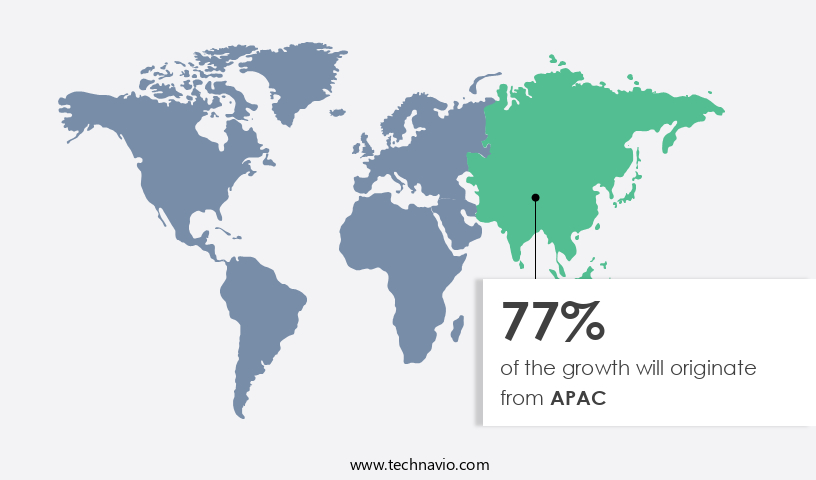
For more insights on the market share of various regions, Request Free Sample
The APAC region's the market is experiencing notable growth due to substantial infrastructure investments and escalating energy demands. The Energy sector In the Philippines, identified as a priority withIn the Indo-Pacific Economic Framework (IPEF) economies by the Coalition for Emerging Market Infrastructure Investment (CEMII), is projected to require approximately USD500 billion in investments from 2024 to 2050 to facilitate a transition to clean energy. Amorphous metal cores, utilized in high-efficiency power transformers, play a crucial role in energy efficiency and sustainability. These transformers minimize electricity loss through hysteresis loss, eddy current loss, and no load loss. Amorphous metal's non-crystalline structure, achieved through ultra-rapid quenching, offers superior magnetic properties, such as high magnetic induction and low electrical resistivity.
As the world transitions to renewable energy sources, such as wind and solar power, energy-efficient solutions, including advanced electrical transformers, smart grids, electric cars, and electrical equipment, will be essential. Amorphous metal cores contribute to reducing CO2 emissions and enhancing power transmission efficiency In these applications.
Market Dynamics
Our researchers analyzed the data with 2023 as the base year, along with the key drivers, trends, and challenges. A holistic analysis of drivers will help companies refine their marketing strategies to gain a competitive advantage.
What are the key market drivers leading to the rise In the adoption of Amorphous Metal Cores Industry?
Investment in power and energy infrastructure is the key driver of the market.
- The global market for amorphous metal cores is experiencing significant growth due to increasing investments in power and energy infrastructure worldwide. With energy consumption projected to rise by 3% annually In the Philippines until 2050, requiring approximately USD500 billion in investments from 2024 to 2050, the need for advanced and efficient power distribution systems is paramount. Amorphous metal cores, with their superior magnetic properties and energy efficiency, play a crucial role In these systems. Beyond the Philippines, other regions are also investing heavily in power infrastructure. Amorphous metal cores, made from iron-based amorphous alloys or metalloid and non-metalloid alloys, offer several advantages over traditional crystalline silicon steel cores.
- These advantages include higher saturation magnetic flux, lower hysteresis loss, and improved magnetic induction, which lead to reduced electricity consumption and CO2 emissions. Amorphous metal cores are used extensively in electrical transformers, including distribution transformers, which are essential components of power transmission and distribution networks. Their non-crystalline structure, achieved through ultra-rapid quenching, results in superior magnetic properties and electrical resistivity, making them ideal for use in advanced electrical transformers and other electrical machineries. As the world transitions to renewable energy sources such as wind and solar power, the demand for energy-efficient solutions, including amorphous metal cores, is expected to increase.
- These cores are used in liquid-filled and dry-type transformers, as well as in magnetic sensors, electric motors, and other electrical equipment. By reducing electricity loss through eddy current loss and no load loss, amorphous metal cores contribute to the overall efficiency of power distribution systems and help minimize the carbon footprint of electrical infrastructure. The market is poised for growth due to the increasing demand for energy-efficient solutions In the context of expanding power infrastructure and the transition to renewable energy sources. These cores, with their unique magnetic properties and energy efficiency, offer significant advantages over traditional materials, making them an essential component of modern power distribution systems.
What are the market trends shaping the Amorphous Metal Cores Industry?
Increasing demand for energy-efficient transformers is the upcoming market trend.
- The market is witnessing significant growth due to the increasing demand for energy-efficient transformers. Amorphous alloys, a key component of these cores, are made from non-crystalline metal alloys such as iron, boron, silicon, and phosphorus. These cores are preferred over crystalline silicon steel due to their superior magnetic properties, including lower saturation magnetic flux, higher magnetic resistivity, and reduced hysteresis and eddy current losses. The US Department of Energy (DOE) finalized new energy efficiency standards for distribution transformers in April 2024, which aim to enhance the efficiency and resiliency of the US power grid. These standards, which include a five-year compliance timeline, are expected to save American utilities and commercial and industrial entities approximately USD824 million annually in electricity costs.
- Amorphous metal cores contribute to these savings by reducing core losses, leading to increased energy efficiency. Transformers are essential components of power transmission and distribution systems, and their efficiency plays a crucial role in reducing electricity consumption and CO2 emissions. Amorphous metal cores are used in various transformer applications, including distribution transformers, liquid-filled transformers, and dry-type transformers. The market for these cores is expected to grow further due to the increasing adoption of renewable energy systems, such as wind farms and solar power, which require energy-efficient electrical machineries and smart grid solutions. Amorphous metal cores are produced using advanced manufacturing techniques, such as ultrarapid quenching, suction casting, and injection molding.
- These techniques enable the production of cores with precise dimensions and excellent magnetic properties, making them suitable for use in advanced electrical transformers and other electrical equipment. The non-crystalline structure of amorphous metal alloys also makes them more resistant to hardness and brittleness compared to crystalline materials, ensuring longer service life and improved reliability. The market is expected to grow significantly due to the increasing demand for energy-efficient transformers and the adoption of renewable energy systems. The superior magnetic properties and manufacturing techniques used to produce these cores make them an ideal solution for reducing electricity consumption, CO2 emissions, and core losses in power transmission and distribution systems.
- The US DOE's new energy efficiency standards for distribution transformers are expected to further boost the demand for these cores, contributing to significant cost savings for American utilities and commercial and industrial entities.
What challenges does the Amorphous Metal Cores Industry face during its growth?
High production costs is a key challenge affecting the industry growth.
- Amorphous metal cores, made from amorphous alloys, offer superior magnetic properties in electrical transformers compared to traditional crystalline silicon steel cores. However, their adoption In the market is hindered by high production costs. The manufacturing process involves rapidly freezing molten metal alloys at ultra-high cooling rates, necessitating advanced equipment and precise control systems, leading to substantial initial investments. Additionally, expensive raw materials, such as rare earth elements and high-purity metals, are used In their production, further increasing costs. The intricate ribbon-winding process and meticulous core assembly add to labor expenses. Despite these challenges, the demand for energy-efficient solutions in power transmission and distribution systems, as well as in electrification projects and renewable energy systems like wind farms, continues to grow.
- Amorphous metal cores' ability to reduce electricity loss through hysteresis loss, eddy current loss, and no load loss makes them an attractive option for advanced electrical transformers used in smart grids, electric cars, and electrical machineries. Their non-crystalline structure, achieved through ultra-rapid quenching, offers advantages in terms of hardness and resistance to saturation magnetic flux, making them suitable for various transformer applications. Non-metalloid alloys and metalloid alloys, such as glassy metals, are also used In the production of amorphous metal cores. The magnetic properties of these alloys, including magnetization, electrical resistivity, and magnetic sensors, contribute to their effectiveness in various transformer applications.
- Dry-type and liquid-filled transformers benefit from the use of amorphous metal cores, reducing CO2 emissions and energy consumption in power infrastructure.
Exclusive Customer Landscape
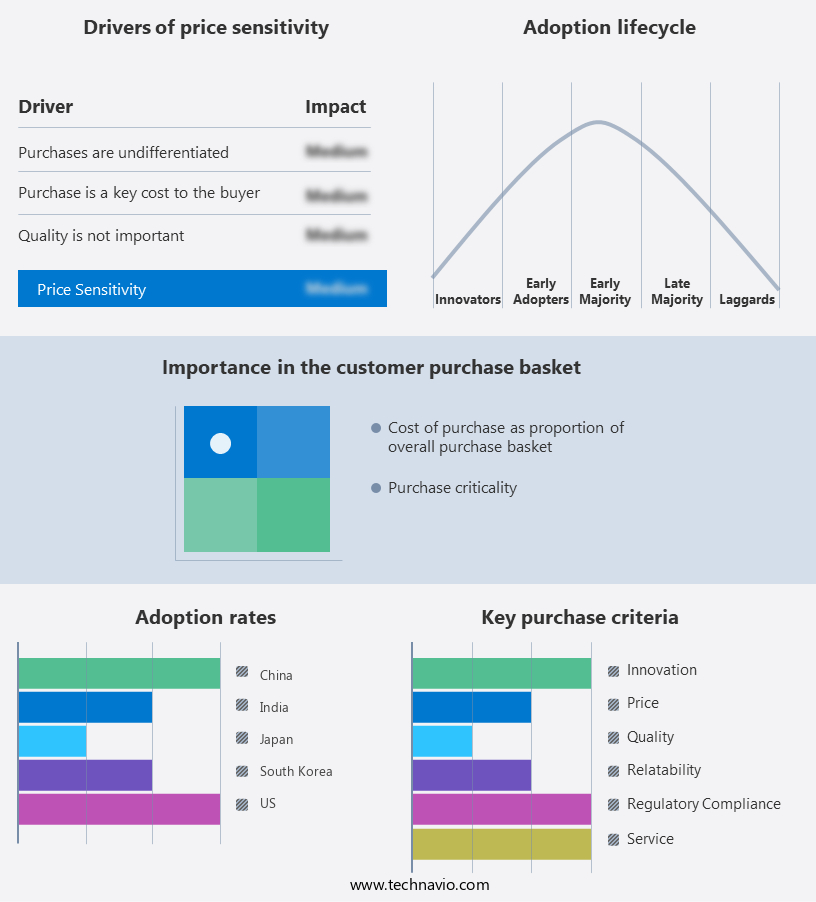
The amorphous metal cores market forecasting report includes the adoption lifecycle of the market, covering from the innovator's stage to the laggard's stage. It focuses on adoption rates in different regions based on penetration. Furthermore, the amorphous metal cores market report also includes key purchase criteria and drivers of price sensitivity to help companies evaluate and develop their market growth analysis strategies.
Customer Landscape
Key Companies & Market Insights
Companies are implementing various strategies, such as strategic alliances, amorphous metal cores market forecast, partnerships, mergers and acquisitions, geographical expansion, and product/service launches, to enhance their presence In the industry.
The industry research and growth report includes detailed analyses of the competitive landscape of the market and information about key companies, including:
- Acal BFi
- Advanced Amorphous Tech
- GAOTUNE TECHNOLOGIES Co. Ltd.
- Guangzhou Amorphous Electronic Technology Co ltd
- Hill Technical Sales
- JFE Shoji Power Canada Inc.
- KRYFS Power Components Ltd
- Magmattec
- Magnetic Metals Corp
- MH and W International Corp.
- MK Magnetics Inc.
- Permanent Magnets Ltd.
- Power Core Industries
- Proterial Ltd.
- Qingdao Yunlu Advanced Materials Technology Co. Ltd.
- Stanford Advanced Materials
- SUNBOW GROUP
- Transmart Industrial Ltd
- Ventrex Energy Pvt. Ltd
- Wiltan
Qualitative and quantitative analysis of companies has been conducted to help clients understand the wider business environment as well as the strengths and weaknesses of key industry players. Data is qualitatively analyzed to categorize companies as pure play, category-focused, industry-focused, and diversified; it is quantitatively analyzed to categorize companies as dominant, leading, strong, tentative, and weak.
Research Analyst Overview
Amorphous metals, also known as metallic glasses, are non-crystalline materials with unique magnetic and electrical properties. Their application in transformer cores has gained significant attention due to the potential benefits they offer in enhancing energy efficiency and reducing CO2 emissions in power transmission. The electrical industry is constantly seeking advanced solutions to address the increasing demand for energy-efficient products and the need to minimize electricity loss in power distribution systems. Amorphous metal cores have emerged as a promising alternative to traditional crystalline silicon steel cores in transformers. The use of amorphous metal cores in transformers results in several advantages.
Their non-crystalline structure allows for a higher saturation magnetic flux density, leading to smaller transformer dimensions and increased power capacity. The absence of grain boundaries in amorphous metals also reduces eddy current and hysteresis losses, resulting in improved energy efficiency. Compared to iron-based amorphous alloys, glassy metals exhibit superior magnetic properties, such as higher electrical resistivity and lower magnetic induction. These properties make them suitable for use in advanced electrical transformers, particularly in applications requiring high magnetic fields and low energy consumption. Moreover, the adoption of amorphous metal cores in transformers contributes to the reduction of CO2 emissions.
By enabling the production of smaller, more efficient transformers, the overall energy consumption in power transmission is minimized. The integration of amorphous metal cores in power transmission systems is not limited to transformers alone. They also find applications in various electrical machineries, such as electric motors and magnetic sensors. The use of these components in electrification projects, renewable energy systems, and smart grids can lead to significant energy savings and improved power infrastructure efficiency. The manufacturing processes for amorphous metal alloys include techniques such as ultra-rapid quenching, suction casting, and injection molding. These methods enable the production of high-quality, homogeneous materials with consistent properties, ensuring reliable performance in transformer applications.
The implementation of amorphous metal cores in transformers and other electrical components offers numerous benefits, including reduced energy consumption, improved efficiency, and lower CO2 emissions. As the global focus on renewable energy sources and energy efficiency continues to grow, the demand for amorphous metal cores is expected to increase. Amorphous metals, specifically their application in transformer cores, represent a significant advancement in power transmission technology. Their unique magnetic and electrical properties enable the production of smaller, more efficient transformers, contributing to energy savings and reduced CO2 emissions. The continued development and adoption of amorphous metal alloys will play a crucial role In the future of power distribution systems and the transition to renewable energy sources.
|
Market Scope |
|
|
Report Coverage |
Details |
|
Page number |
195 |
|
Base year |
2023 |
|
Historic period |
2018-2022 |
|
Forecast period |
2024-2028 |
|
Growth momentum & CAGR |
Accelerate at a CAGR of 7.4% |
|
Market growth 2024-2028 |
USD 353.14 thousand |
|
Market structure |
Fragmented |
|
YoY growth 2023-2024(%) |
6.0 |
|
Key countries |
China, India, Japan, US, South Korea, Singapore, Russia, Canada, UK, and Germany |
|
Competitive landscape |
Leading Companies, Market Positioning of Companies, Competitive Strategies, and Industry Risks |
What are the Key Data Covered in this Amorphous Metal Cores Market Research and Growth Report?
- CAGR of the Amorphous Metal Cores industry during the forecast period
- Detailed information on factors that will drive the growth and forecasting between 2024 and 2028
- Precise estimation of the size of the market and its contribution of the industry in focus to the parent market
- Accurate predictions about upcoming growth and trends and changes in consumer behaviour
- Growth of the market across APAC, North America, Europe, South America, and Middle East and Africa
- Thorough analysis of the market's competitive landscape and detailed information about companies
- Comprehensive analysis of factors that will challenge the amorphous metal cores market growth of industry companies
We can help! Our analysts can customize this amorphous metal cores market research report to meet your requirements.
 RIA -
RIA - 
