Analog AI Chip Market Analysis, Size, and Forecast 2025-2029: North America (US, Canada, and Mexico), APAC (China, Japan, and South Korea), Europe (Germany, UK, and France), Middle East and Africa (Saudi Arabia, UAE, and South Africa), South America (Brazil and Argentina), and Rest of World (ROW)

Analog AI Chip Market Analysis, Size, and Forecast 2025-2029:
North America (US, Canada, and Mexico), APAC (China, Japan, and South Korea), Europe (Germany, UK, and France), Middle East and Africa (Saudi Arabia, UAE, and South Africa), South America (Brazil and Argentina), and Rest of World (ROW)

Published: Dec 2025 304 Pages SKU: IRTNTR81036

Market Overview at a Glance

$3.96 B
Market Opportunity
23.1%
CAGR 2024 - 2029
37.3%
North America Growth
$1.22 B
CMOS segment 2023

Analog AI Chip Market Size 2025-2029

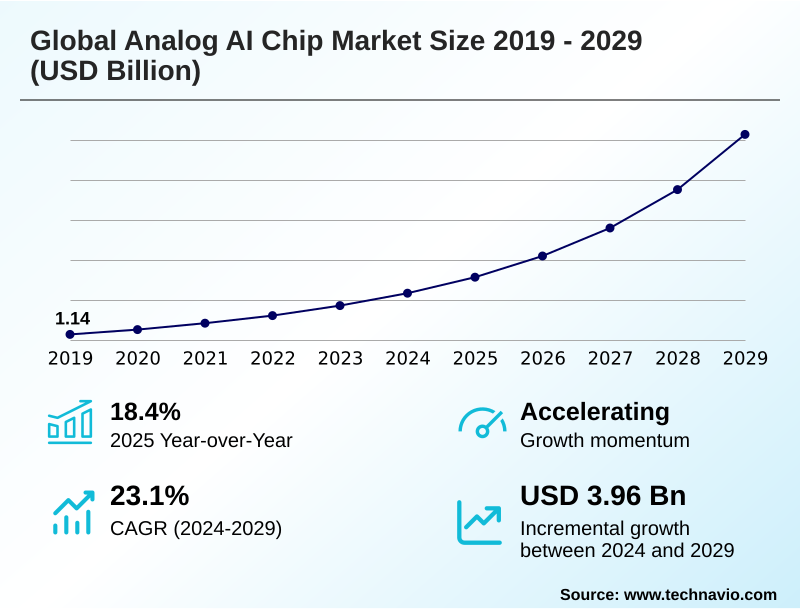
The analog ai chip market size is valued to increase by USD 3.96 billion, at a CAGR of 23.1% from 2024 to 2029. Imperative for enhanced power efficiency in edge computing will drive the analog ai chip market.

Major Market Trends & Insights

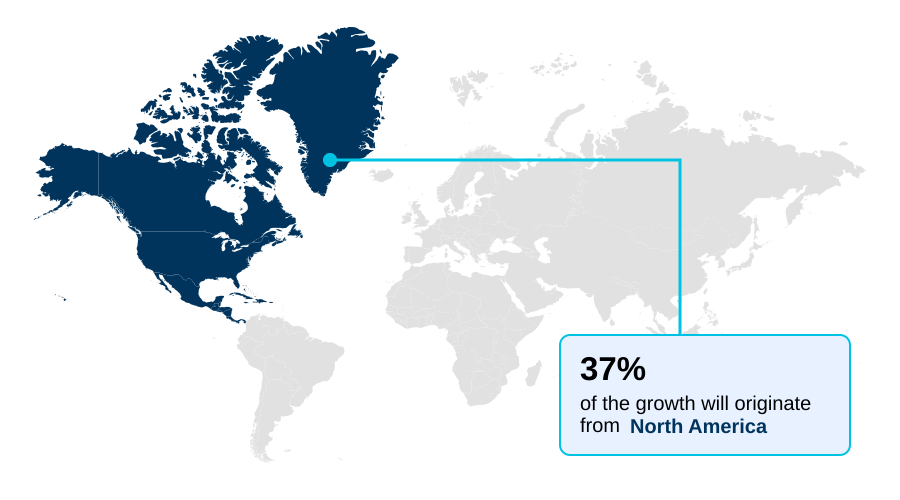
  • North America dominated the market and accounted for a 37.3% growth during the forecast period.
  • By Technology - CMOS segment was valued at USD 1.22 billion in 2023
  • By Application - Edge computing segment accounted for the largest market revenue share in 2023

Market Size & Forecast

  • Market Opportunities: USD 5.00 billion
  • Market Future Opportunities: USD 3.96 billion
  • CAGR from 2024 to 2029 : 23.1%

Market Summary

  • The analog AI chip market is defined by specialized semiconductors that perform computations using continuous analog signals, fundamentally addressing efficiency limitations in digital processors. By leveraging compute-in-memory architectures, these chips execute complex mathematical operations directly within non-volatile memory arrays, effectively mitigating the von neumann bottleneck that consumes significant energy in traditional systems.
  • This architectural shift is driven by the demand for extreme power efficiency and low-latency processing, particularly for on-device AI in edge computing and autonomous systems. In industrial automation, for example, on-premise visual inspection systems can identify microscopic defects in real-time without cloud reliance, ensuring continuous quality control.
  • However, the technology faces challenges related to computational precision due to inherent signal noise and process variability. Moreover, the industry is navigating the development of a comprehensive software ecosystem, including specialized compilers and hardware-aware training algorithms, which is essential for wider adoption and unlocking the full potential of this transformative hardware.

What will be the Size of the Analog AI Chip Market during the forecast period?

Get Key Insights on Market Forecast (PDF) Request Free Sample

How is the Analog AI Chip Market Segmented?

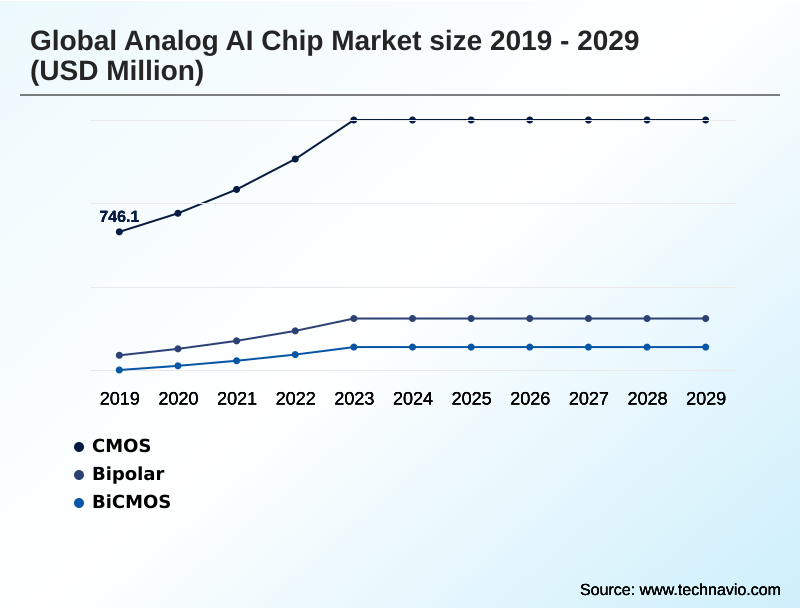
The analog ai chip industry research report provides comprehensive data (region-wise segment analysis), with forecasts and estimates in "USD million" for the period 2025-2029, as well as historical data from 2019-2023 for the following segments.

  • Technology
    • CMOS
    • Bipolar
    • BiCMOS
  • Application
    • Edge computing
    • Consumer electronics
    • Data center
    • Automotive
    • Healthcare
  • Component
    • Hardware
    • Software
    • Services
  • Geography
    • North America
      • US
      • Canada
      • Mexico
    • APAC
      • China
      • Japan
      • South Korea
    • Europe
      • Germany
      • UK
      • France
    • Middle East and Africa
      • Saudi Arabia
      • UAE
      • South Africa
    • South America
      • Brazil
      • Argentina
    • Rest of World (ROW)

By Technology Insights

The cmos segment is estimated to witness significant growth during the forecast period.

The CMOS technology segment is the foundational force in the analog AI chip market, leveraging a mature and cost-effective manufacturing ecosystem.

This technology enables exceptional integration density, which is critical for creating the massively parallel arrays of compute-in-memory cells used in advanced system-on-chip (SoC) design.

The primary advantage of CMOS lies in its low static power, a vital feature for battery-powered edge devices where energy efficiency is a primary constraint.

Applications in consumer electronics and industrial automation benefit from this, with some implementations showing an over 25% improvement in inference task efficiency.

While this approach benefits from processing-in-memory (PIM) and in-sensor computing, it faces challenges from process variation and signal noise, which can affect the precision of medical imaging analysis and smart city infrastructure.

Request Free Sample

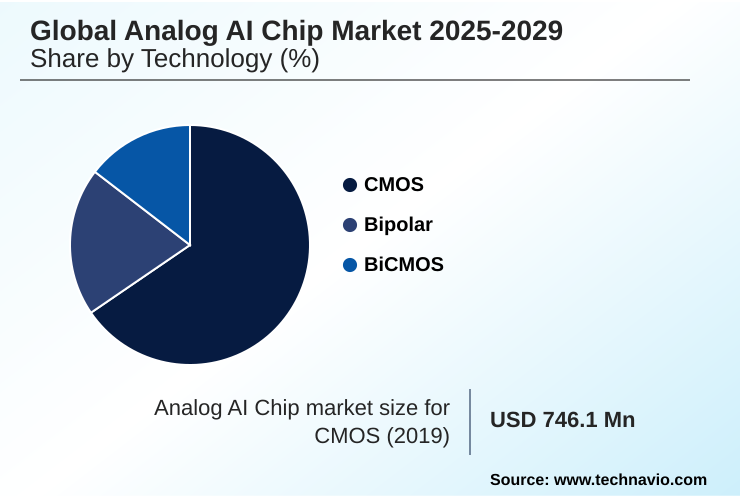
The CMOS segment was valued at USD 1.22 billion in 2023 and showed a gradual increase during the forecast period.

Request Free Sample

Regional Analysis

North America is estimated to contribute 37.3% to the growth of the global market during the forecast period.Technavio’s analysts have elaborately explained the regional trends and drivers that shape the market during the forecast period.

See How Analog AI Chip Market Demand is Rising in North America Request Free Sample

The geographic landscape of the market is led by North America, which is a hub for research, development, and venture capital, accounting for approximately 37.3% of incremental growth.

This region benefits from a robust ecosystem driving innovation in sensor fusion algorithms and data acquisition for predictive maintenance.

Meanwhile, the APAC region, with its vast manufacturing scale and a projected CAGR of 24.3%, is a critical center for production and has a strategic focus on semiconductor self-sufficiency. Foundries in this region are crucial for visual inspection systems.

Europe carves out a significant role through its powerful automotive and industrial automation sectors, focusing on high-value applications for in-vehicle AI processors. These regional strengths create a competitive and globally interconnected market focused on next-generation deep learning inference.

Market Dynamics

Our researchers analyzed the data with 2024 as the base year, along with the key drivers, trends, and challenges. A holistic analysis of drivers will help companies refine their marketing strategies to gain a competitive advantage.

  • The global analog AI chip market 2025-2029 is advancing through a nuanced cost-benefit analysis of analog AI chips compared to traditional digital hardware. The primary advantages of analog AI for edge devices are rooted in the profound energy efficiency of neuromorphic computing, which is crucial for low-power AI for wearable devices and analog AI for real-time sensor fusion.
  • This is evident in compute-in-memory vs digital GPU performance benchmarks, where analog systems demonstrate superior capabilities in handling parallel data streams. The core technology relies on the role of non-volatile memory in analog AI, using ReRAM for synaptic operations to build hardware that mimics neural processes.
  • This approach is central to analog AI chip applications in automotive, particularly for analog AI integration with ADAS systems, and for analog processing for voice recognition. However, significant challenges in scaling analog AI production and overcoming noise in analog computing remain.
  • The precision limitations of analog hardware necessitate a robust software ecosystem for analog processors, as the development of neuromorphic chips for robotic vision depends on sophisticated design and mapping tools. The analog AI chip manufacturing process is more complex than standard digital fabrication, requiring a hybrid chip design for AI acceleration.
  • In industrial IoT, systems using these chips can process sensor data with latency over an order of magnitude lower than cloud-based systems, enabling preemptive failure detection and showcasing the future of compute-in-memory technology.

What are the key market drivers leading to the rise in the adoption of Analog AI Chip Industry?

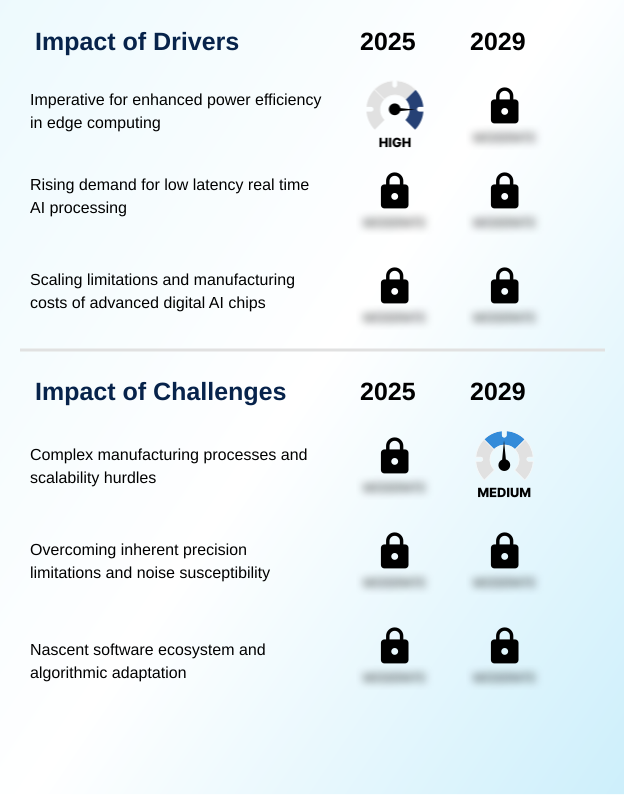
  • The imperative for enhanced power efficiency in edge computing applications is a key driver of the market.

  • The market is primarily driven by the limitations of digital scaling and the critical need for ultra-low power consumption in a growing number of AI applications.
  • Analog architectures, including the analog matrix processor and in-memory computing designs, offer superior computational efficiency by performing parallel data operations directly where data is stored.
  • These specialized chips deliver profound improvements in performance-per-watt, with some designs showing up to 100 times greater efficiency than digital counterparts.
  • Furthermore, by leveraging mature semiconductor manufacturing processes, the production cost for this hardware can be 30-40% lower compared to leading-edge digital GPUs.
  • This economic advantage, coupled with the performance gains from low latency inference and storing synaptic weights locally, makes it a compelling alternative for next-generation hardware.

What are the market trends shaping the Analog AI Chip Industry?

  • A primary market trend is the increasing imperative for energy-efficient AI processing at the edge, reflecting a growing demand for on-device intelligence in battery-powered systems.

  • A key trend shaping the market is the escalating demand for energy-efficient compute-in-memory (CIM) solutions to enable sophisticated edge AI processing. This shift toward on-device intelligence is driven by the need to overcome the von neumann bottleneck and reduce reliance on cloud connectivity, which enhances data privacy by minimizing raw data transmission by over 90% in certain use cases.
  • This approach, leveraging non-volatile memory (NVM) and phase-change memory (PCM), is critical for battery-powered devices requiring always-on sensing capabilities. Architectures based on resistive RAM (ReRAM) deliver real-time responsiveness, with processing delays reduced to microseconds, a significant improvement over some cloud-based alternatives. This trend signals a move toward more powerful and autonomous systems with superior power efficiency.

What challenges does the Analog AI Chip Industry face during its growth?

  • Complex manufacturing processes and scalability hurdles represent a key challenge affecting the industry's growth.

  • Significant challenges in the market revolve around manufacturing complexities and inherent physical limitations that affect performance. The compute-in-memory architecture, while efficient, is susceptible to process variation, which can introduce calculation errors and reduce model accuracy by up to 5-10% in high-precision tasks. These scalability hurdles complicate the fabrication of hybrid analog-digital chips.
  • A nascent software ecosystem and a lack of standardized developer toolchains create another major barrier, as the intellectual property (IP) licensing and electronic design automation (EDA) tools are still evolving. The engineering effort required for neural network deployment can be twice as long compared to development on standard digital hardware, impacting market adoption for machine learning models.

Exclusive Technavio Analysis on Customer Landscape

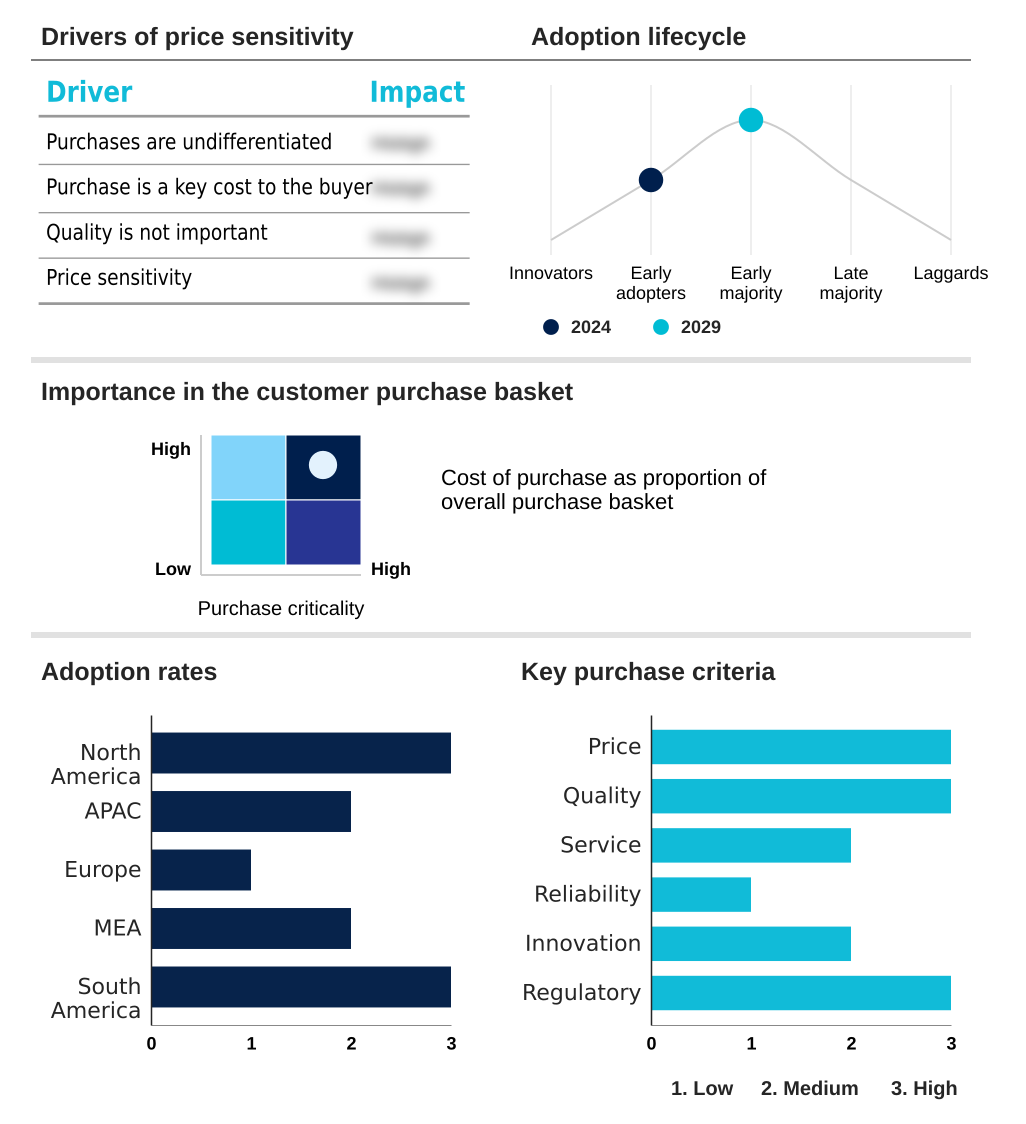
The analog ai chip market forecasting report includes the adoption lifecycle of the market, covering from the innovator’s stage to the laggard’s stage. It focuses on adoption rates in different regions based on penetration. Furthermore, the analog ai chip market report also includes key purchase criteria and drivers of price sensitivity to help companies evaluate and develop their market growth analysis strategies.

Customer Landscape of Analog AI Chip Industry

Competitive Landscape

Companies are implementing various strategies, such as strategic alliances, analog ai chip market forecast, partnerships, mergers and acquisitions, geographical expansion, and product/service launches, to enhance their presence in the industry.

Analog Devices Inc. - Key offerings include analog matrix processors leveraging compute-in-memory technology, delivering high TOPS performance for energy-efficient edge AI inference.

The industry research and growth report includes detailed analyses of the competitive landscape of the market and information about key companies, including:

  • Analog Devices Inc.
  • Aspinity Inc.
  • Infineon Technologies AG
  • Intel Corp.
  • IBM Corp.
  • Micron Technology Inc.
  • Mythic Inc.
  • NXP Semiconductors NV
  • PROPHESEE S.A.
  • Qualcomm Inc.
  • Rain Neuromorphics Inc.
  • Renesas Electronics Corp.
  • Samsung Electronics Co. Ltd.
  • SK hynix Co. Ltd.
  • Sony Group Corp.
  • STMicroelectronics NV
  • SynSense
  • Syntiant Corp.
  • Taiwan Semiconductor Co. Ltd.
  • Texas Instruments Inc.

Qualitative and quantitative analysis of companies has been conducted to help clients understand the wider business environment as well as the strengths and weaknesses of key industry players. Data is qualitatively analyzed to categorize companies as pure play, category-focused, industry-focused, and diversified; it is quantitatively analyzed to categorize companies as dominant, leading, strong, tentative, and weak.

Recent Development and News in Analog ai chip market

  • In November 2024, IBM Research unveiled an advanced analog AI chip prototype utilizing phase-change memory technology, demonstrating a substantial reduction in energy consumption for complex AI inference tasks.
  • In January 2025, Syntiant Corp. announced a strategic partnership with a major automotive original equipment manufacturer to integrate its next-generation Neural Decision Processors into in-cabin monitoring systems, enabling low-power voice command and driver alertness features.
  • In March 2025, Lightmatter announced its Passage platform, a wafer-scale, reconfigurable photonic interconnect designed to directly connect chips and accelerators, addressing data movement bottlenecks in data centers.
  • In August 2025, GlobalFoundries announced the expansion of its advanced BiCMOS platform, aimed at enabling next-generation solutions for 6G wireless infrastructure and data center optical interconnects.

Dive into Technavio’s robust research methodology, blending expert interviews, extensive data synthesis, and validated models for unparalleled Analog AI Chip Market insights. See full methodology.

Market Scope
Page number 304
Base year 2024
Historic period 2019-2023
Forecast period 2025-2029
Growth momentum & CAGR Accelerate at a CAGR of 23.1%
Market growth 2025-2029 USD 3962.1 million
Market structure Concentrated
YoY growth 2024-2025(%) 18.4%
Key countries US, Canada, Mexico, China, Japan, South Korea, India, Indonesia, Australia, Germany, UK, France, The Netherlands, Italy, Spain, Saudi Arabia, UAE, South Africa, Egypt, Nigeria, Brazil, Argentina and Chile
Competitive landscape Leading Companies, Market Positioning of Companies, Competitive Strategies, and Industry Risks

Request Free Sample

Research Analyst Overview

  • The analog AI chip market represents a fundamental architectural shift, moving away from the classic von neumann bottleneck by embedding computation directly within memory. This compute-in-memory (CIM) approach utilizes non-volatile memory cells, such as resistive RAM (ReRAM) and phase-change memory (PCM), to perform massively parallel data operations like matrix-vector multiplications.
  • The result is ultra-low power consumption, enabling real-time AI processing and on-device intelligence in a way digital tensor processing units (TPUs) cannot match. This trend toward local processing directly informs corporate data governance strategies, as it minimizes cloud data transmission and enhances security compliance.
  • Technologies including BiCMOS technology, bipolar junction transistors (BJT), and CMOS technology are leveraged to create these advanced chips, which incorporate analog-to-digital converters (ADCs) and digital-to-analog converters (DACs). Applications are expanding from advanced driver-assistance systems (ADAS) to in-sensor computing and event-based vision systems powered by neural decision processors.
  • Specialized hardware like analog front-ends (AFE) and analog matrix processors are key to this evolution. The entire paradigm, including in-memory computing, neuromorphic computing, processing-in-memory (PIM), and even photonic computing, requires hardware-aware training and quantization techniques for effective deployment.
  • Early adoptions in smart sensor applications have already demonstrated a power draw reduction of up to 95% for continuous inference tasks compared to conventional microcontroller-based solutions, highlighting the technology's transformative potential.

What are the Key Data Covered in this Analog AI Chip Market Research and Growth Report?

  • What is the expected growth of the Analog AI Chip Market between 2025 and 2029?

    • USD 3.96 billion, at a CAGR of 23.1%

  • What segmentation does the market report cover?

    • The report is segmented by Technology (CMOS, Bipolar, BiCMOS), Application (Edge computing, Consumer electronics, Data center, Automotive, Healthcare), Component (Hardware, Software, Services) and Geography (North America, APAC, Europe, Middle East and Africa, South America)

  • Which regions are analyzed in the report?

    • North America, APAC, Europe, Middle East and Africa and South America

  • What are the key growth drivers and market challenges?

    • Imperative for enhanced power efficiency in edge computing, Complex manufacturing processes and scalability hurdles

  • Who are the major players in the Analog AI Chip Market?

    • Analog Devices Inc., Aspinity Inc., Infineon Technologies AG, Intel Corp., IBM Corp., Micron Technology Inc., Mythic Inc., NXP Semiconductors NV, PROPHESEE S.A., Qualcomm Inc., Rain Neuromorphics Inc., Renesas Electronics Corp., Samsung Electronics Co. Ltd., SK hynix Co. Ltd., Sony Group Corp., STMicroelectronics NV, SynSense, Syntiant Corp., Taiwan Semiconductor Co. Ltd. and Texas Instruments Inc.

Market Research Insights

  • The market's dynamics are shaped by a strategic pivot toward architectures that prioritize power efficiency and computational efficiency to support demanding AI workloads. This shift enables always-on sensing capabilities in edge devices while consuming up to 75% less power than digital counterparts, significantly extending operational life.
  • Furthermore, implementations have demonstrated a reduction in data transmission for inference tasks by up to 90%, directly lowering network bandwidth costs and enhancing data privacy. While the technology is highly specialized, its direct impact on operating expenditures makes it a critical purchase decision for original equipment manufacturers.
  • The nascent developer toolchains and the need for neural network deployment expertise represent current adoption hurdles, though the performance benefits are compelling for machine learning models in various sectors.

We can help! Our analysts can customize this analog ai chip market research report to meet your requirements.

Get in touch

1. Executive Summary

1.1 Market overview

Executive Summary - Chart on Market Overview
Executive Summary - Data Table on Market Overview
Executive Summary - Chart on Global Market Characteristics
Executive Summary - Chart on Market by Geography
Executive Summary - Chart on Market Segmentation by Technology
Executive Summary - Chart on Market Segmentation by Application
Executive Summary - Chart on Market Segmentation by Component
Executive Summary - Chart on Incremental Growth
Executive Summary - Data Table on Incremental Growth
Executive Summary - Chart on Company Market Positioning

2. Technavio Analysis

2.1 Analysis of price sensitivity, lifecycle, customer purchase basket, adoption rates, and purchase criteria

2.2 Criticality of inputs and Factors of differentiation

Chart on Overview on criticality of inputs and factors of differentiation

2.3 Factors of disruption

Chart on Overview on factors of disruption

2.4 Impact of drivers and challenges

Chart on Impact of drivers and challenges in 2024 and 2029

3. Market Landscape

3.1 Market ecosystem

Chart on Parent Market
Data Table on - Parent Market

3.2 Market characteristics

Chart on Market characteristics analysis

3.3 Value chain analysis

Chart on Value chain analysis

4. Market Sizing

4.1 Market definition

Data Table on Offerings of companies included in the market definition

4.2 Market segment analysis

Market segments

4.3 Market size 2024

4.4 Market outlook: Forecast for 2024-2029

Chart on Global - Market size and forecast 2024-2029 ($ million)
Data Table on Global - Market size and forecast 2024-2029 ($ million)
Chart on Global Market: Year-over-year growth 2024-2029 (%)
Data Table on Global Market: Year-over-year growth 2024-2029 (%)

5. Historic Market Size

5.1 Global Analog AI Chip Market 2019 - 2023

Historic Market Size - Data Table on Global Analog AI Chip Market 2019 - 2023 ($ million)

5.2 Technology segment analysis 2019 - 2023

Historic Market Size - Technology Segment 2019 - 2023 ($ million)

5.3 Application segment analysis 2019 - 2023

Historic Market Size - Application Segment 2019 - 2023 ($ million)

5.4 Component segment analysis 2019 - 2023

Historic Market Size - Component Segment 2019 - 2023 ($ million)

5.5 Geography segment analysis 2019 - 2023

Historic Market Size - Geography Segment 2019 - 2023 ($ million)

5.6 Country segment analysis 2019 - 2023

Historic Market Size - Country Segment 2019 - 2023 ($ million)

6. Five Forces Analysis

6.1 Five forces summary

Five forces analysis - Comparison between 2024 and 2029

6.2 Bargaining power of buyers

Bargaining power of buyers - Impact of key factors 2024 and 2029

6.3 Bargaining power of suppliers

Bargaining power of suppliers - Impact of key factors in 2024 and 2029

6.4 Threat of new entrants

Threat of new entrants - Impact of key factors in 2024 and 2029

6.5 Threat of substitutes

Threat of substitutes - Impact of key factors in 2024 and 2029

6.6 Threat of rivalry

Threat of rivalry - Impact of key factors in 2024 and 2029

6.7 Market condition

Chart on Market condition - Five forces 2024 and 2029

7. Market Segmentation by Technology

7.1 Market segments

Chart on Technology - Market share 2024-2029 (%)
Data Table on Technology - Market share 2024-2029 (%)

7.2 Comparison by Technology

Chart on Comparison by Technology
Data Table on Comparison by Technology

7.3 CMOS - Market size and forecast 2024-2029

Chart on CMOS - Market size and forecast 2024-2029 ($ million)
Data Table on CMOS - Market size and forecast 2024-2029 ($ million)
Chart on CMOS - Year-over-year growth 2024-2029 (%)
Data Table on CMOS - Year-over-year growth 2024-2029 (%)

7.4 Bipolar - Market size and forecast 2024-2029

Chart on Bipolar - Market size and forecast 2024-2029 ($ million)
Data Table on Bipolar - Market size and forecast 2024-2029 ($ million)
Chart on Bipolar - Year-over-year growth 2024-2029 (%)
Data Table on Bipolar - Year-over-year growth 2024-2029 (%)

7.5 BiCMOS - Market size and forecast 2024-2029

Chart on BiCMOS - Market size and forecast 2024-2029 ($ million)
Data Table on BiCMOS - Market size and forecast 2024-2029 ($ million)
Chart on BiCMOS - Year-over-year growth 2024-2029 (%)
Data Table on BiCMOS - Year-over-year growth 2024-2029 (%)

7.6 Market opportunity by Technology

Market opportunity by Technology ($ million)
Data Table on Market opportunity by Technology ($ million)

8. Market Segmentation by Application

8.1 Market segments

Chart on Application - Market share 2024-2029 (%)
Data Table on Application - Market share 2024-2029 (%)

8.2 Comparison by Application

Chart on Comparison by Application
Data Table on Comparison by Application

8.3 Edge computing - Market size and forecast 2024-2029

Chart on Edge computing - Market size and forecast 2024-2029 ($ million)
Data Table on Edge computing - Market size and forecast 2024-2029 ($ million)
Chart on Edge computing - Year-over-year growth 2024-2029 (%)
Data Table on Edge computing - Year-over-year growth 2024-2029 (%)

8.4 Consumer electronics - Market size and forecast 2024-2029

Chart on Consumer electronics - Market size and forecast 2024-2029 ($ million)
Data Table on Consumer electronics - Market size and forecast 2024-2029 ($ million)
Chart on Consumer electronics - Year-over-year growth 2024-2029 (%)
Data Table on Consumer electronics - Year-over-year growth 2024-2029 (%)

8.5 Data center - Market size and forecast 2024-2029

Chart on Data center - Market size and forecast 2024-2029 ($ million)
Data Table on Data center - Market size and forecast 2024-2029 ($ million)
Chart on Data center - Year-over-year growth 2024-2029 (%)
Data Table on Data center - Year-over-year growth 2024-2029 (%)

8.6 Automotive - Market size and forecast 2024-2029

Chart on Automotive - Market size and forecast 2024-2029 ($ million)
Data Table on Automotive - Market size and forecast 2024-2029 ($ million)
Chart on Automotive - Year-over-year growth 2024-2029 (%)
Data Table on Automotive - Year-over-year growth 2024-2029 (%)

8.7 Healthcare - Market size and forecast 2024-2029

Chart on Healthcare - Market size and forecast 2024-2029 ($ million)
Data Table on Healthcare - Market size and forecast 2024-2029 ($ million)
Chart on Healthcare - Year-over-year growth 2024-2029 (%)
Data Table on Healthcare - Year-over-year growth 2024-2029 (%)

8.8 Market opportunity by Application

Market opportunity by Application ($ million)
Data Table on Market opportunity by Application ($ million)

9. Market Segmentation by Component

9.1 Market segments

Chart on Component - Market share 2024-2029 (%)
Data Table on Component - Market share 2024-2029 (%)

9.2 Comparison by Component

Chart on Comparison by Component
Data Table on Comparison by Component

9.3 Hardware - Market size and forecast 2024-2029

Chart on Hardware - Market size and forecast 2024-2029 ($ million)
Data Table on Hardware - Market size and forecast 2024-2029 ($ million)
Chart on Hardware - Year-over-year growth 2024-2029 (%)
Data Table on Hardware - Year-over-year growth 2024-2029 (%)

9.4 Software - Market size and forecast 2024-2029

Chart on Software - Market size and forecast 2024-2029 ($ million)
Data Table on Software - Market size and forecast 2024-2029 ($ million)
Chart on Software - Year-over-year growth 2024-2029 (%)
Data Table on Software - Year-over-year growth 2024-2029 (%)

9.5 Services - Market size and forecast 2024-2029

Chart on Services - Market size and forecast 2024-2029 ($ million)
Data Table on Services - Market size and forecast 2024-2029 ($ million)
Chart on Services - Year-over-year growth 2024-2029 (%)
Data Table on Services - Year-over-year growth 2024-2029 (%)

9.6 Market opportunity by Component

Market opportunity by Component ($ million)
Data Table on Market opportunity by Component ($ million)

10. Customer Landscape

10.1 Customer landscape overview

Analysis of price sensitivity, lifecycle, customer purchase basket, adoption rates, and purchase criteria

11. Geographic Landscape

11.1 Geographic segmentation

Chart on Market share by geography 2024-2029 (%)
Data Table on Market share by geography 2024-2029 (%)

11.2 Geographic comparison

Chart on Geographic comparison
Data Table on Geographic comparison

11.3 North America - Market size and forecast 2024-2029

Chart on North America - Market size and forecast 2024-2029 ($ million)
Data Table on North America - Market size and forecast 2024-2029 ($ million)
Chart on North America - Year-over-year growth 2024-2029 (%)
Data Table on North America - Year-over-year growth 2024-2029 (%)
Chart on Regional Comparison - North America
Data Table on Regional Comparison - North America

11.3.1 US - Market size and forecast 2024-2029

Chart on US - Market size and forecast 2024-2029 ($ million)
Data Table on US - Market size and forecast 2024-2029 ($ million)
Chart on US - Year-over-year growth 2024-2029 (%)
Data Table on US - Year-over-year growth 2024-2029 (%)

11.3.2 Canada - Market size and forecast 2024-2029

Chart on Canada - Market size and forecast 2024-2029 ($ million)
Data Table on Canada - Market size and forecast 2024-2029 ($ million)
Chart on Canada - Year-over-year growth 2024-2029 (%)
Data Table on Canada - Year-over-year growth 2024-2029 (%)

11.3.3 Mexico - Market size and forecast 2024-2029

Chart on Mexico - Market size and forecast 2024-2029 ($ million)
Data Table on Mexico - Market size and forecast 2024-2029 ($ million)
Chart on Mexico - Year-over-year growth 2024-2029 (%)
Data Table on Mexico - Year-over-year growth 2024-2029 (%)

11.4 APAC - Market size and forecast 2024-2029

Chart on APAC - Market size and forecast 2024-2029 ($ million)
Data Table on APAC - Market size and forecast 2024-2029 ($ million)
Chart on APAC - Year-over-year growth 2024-2029 (%)
Data Table on APAC - Year-over-year growth 2024-2029 (%)
Chart on Regional Comparison - APAC
Data Table on Regional Comparison - APAC

11.4.1 China - Market size and forecast 2024-2029

Chart on China - Market size and forecast 2024-2029 ($ million)
Data Table on China - Market size and forecast 2024-2029 ($ million)
Chart on China - Year-over-year growth 2024-2029 (%)
Data Table on China - Year-over-year growth 2024-2029 (%)

11.4.2 Japan - Market size and forecast 2024-2029

Chart on Japan - Market size and forecast 2024-2029 ($ million)
Data Table on Japan - Market size and forecast 2024-2029 ($ million)
Chart on Japan - Year-over-year growth 2024-2029 (%)
Data Table on Japan - Year-over-year growth 2024-2029 (%)

11.4.3 South Korea - Market size and forecast 2024-2029

Chart on South Korea - Market size and forecast 2024-2029 ($ million)
Data Table on South Korea - Market size and forecast 2024-2029 ($ million)
Chart on South Korea - Year-over-year growth 2024-2029 (%)
Data Table on South Korea - Year-over-year growth 2024-2029 (%)

11.4.4 India - Market size and forecast 2024-2029

Chart on India - Market size and forecast 2024-2029 ($ million)
Data Table on India - Market size and forecast 2024-2029 ($ million)
Chart on India - Year-over-year growth 2024-2029 (%)
Data Table on India - Year-over-year growth 2024-2029 (%)

11.4.5 Indonesia - Market size and forecast 2024-2029

Chart on Indonesia - Market size and forecast 2024-2029 ($ million)
Data Table on Indonesia - Market size and forecast 2024-2029 ($ million)
Chart on Indonesia - Year-over-year growth 2024-2029 (%)
Data Table on Indonesia - Year-over-year growth 2024-2029 (%)

11.4.6 Australia - Market size and forecast 2024-2029

Chart on Australia - Market size and forecast 2024-2029 ($ million)
Data Table on Australia - Market size and forecast 2024-2029 ($ million)
Chart on Australia - Year-over-year growth 2024-2029 (%)
Data Table on Australia - Year-over-year growth 2024-2029 (%)

11.5 Europe - Market size and forecast 2024-2029

Chart on Europe - Market size and forecast 2024-2029 ($ million)
Data Table on Europe - Market size and forecast 2024-2029 ($ million)
Chart on Europe - Year-over-year growth 2024-2029 (%)
Data Table on Europe - Year-over-year growth 2024-2029 (%)
Chart on Regional Comparison - Europe
Data Table on Regional Comparison - Europe

11.5.1 Germany - Market size and forecast 2024-2029

Chart on Germany - Market size and forecast 2024-2029 ($ million)
Data Table on Germany - Market size and forecast 2024-2029 ($ million)
Chart on Germany - Year-over-year growth 2024-2029 (%)
Data Table on Germany - Year-over-year growth 2024-2029 (%)

11.5.2 UK - Market size and forecast 2024-2029

Chart on UK - Market size and forecast 2024-2029 ($ million)
Data Table on UK - Market size and forecast 2024-2029 ($ million)
Chart on UK - Year-over-year growth 2024-2029 (%)
Data Table on UK - Year-over-year growth 2024-2029 (%)

11.5.3 France - Market size and forecast 2024-2029

Chart on France - Market size and forecast 2024-2029 ($ million)
Data Table on France - Market size and forecast 2024-2029 ($ million)
Chart on France - Year-over-year growth 2024-2029 (%)
Data Table on France - Year-over-year growth 2024-2029 (%)

11.5.4 The Netherlands - Market size and forecast 2024-2029

Chart on The Netherlands - Market size and forecast 2024-2029 ($ million)
Data Table on The Netherlands - Market size and forecast 2024-2029 ($ million)
Chart on The Netherlands - Year-over-year growth 2024-2029 (%)
Data Table on The Netherlands - Year-over-year growth 2024-2029 (%)

11.5.5 Italy - Market size and forecast 2024-2029

Chart on Italy - Market size and forecast 2024-2029 ($ million)
Data Table on Italy - Market size and forecast 2024-2029 ($ million)
Chart on Italy - Year-over-year growth 2024-2029 (%)
Data Table on Italy - Year-over-year growth 2024-2029 (%)

11.5.6 Spain - Market size and forecast 2024-2029

Chart on Spain - Market size and forecast 2024-2029 ($ million)
Data Table on Spain - Market size and forecast 2024-2029 ($ million)
Chart on Spain - Year-over-year growth 2024-2029 (%)
Data Table on Spain - Year-over-year growth 2024-2029 (%)

11.6 Middle East and Africa - Market size and forecast 2024-2029

Chart on Middle East and Africa - Market size and forecast 2024-2029 ($ million)
Data Table on Middle East and Africa - Market size and forecast 2024-2029 ($ million)
Chart on Middle East and Africa - Year-over-year growth 2024-2029 (%)
Data Table on Middle East and Africa - Year-over-year growth 2024-2029 (%)
Chart on Regional Comparison - Middle East and Africa
Data Table on Regional Comparison - Middle East and Africa

11.6.1 Saudi Arabia - Market size and forecast 2024-2029

Chart on Saudi Arabia - Market size and forecast 2024-2029 ($ million)
Data Table on Saudi Arabia - Market size and forecast 2024-2029 ($ million)
Chart on Saudi Arabia - Year-over-year growth 2024-2029 (%)
Data Table on Saudi Arabia - Year-over-year growth 2024-2029 (%)

11.6.2 UAE - Market size and forecast 2024-2029

Chart on UAE - Market size and forecast 2024-2029 ($ million)
Data Table on UAE - Market size and forecast 2024-2029 ($ million)
Chart on UAE - Year-over-year growth 2024-2029 (%)
Data Table on UAE - Year-over-year growth 2024-2029 (%)

11.6.3 South Africa - Market size and forecast 2024-2029

Chart on South Africa - Market size and forecast 2024-2029 ($ million)
Data Table on South Africa - Market size and forecast 2024-2029 ($ million)
Chart on South Africa - Year-over-year growth 2024-2029 (%)
Data Table on South Africa - Year-over-year growth 2024-2029 (%)

11.6.4 Egypt - Market size and forecast 2024-2029

Chart on Egypt - Market size and forecast 2024-2029 ($ million)
Data Table on Egypt - Market size and forecast 2024-2029 ($ million)
Chart on Egypt - Year-over-year growth 2024-2029 (%)
Data Table on Egypt - Year-over-year growth 2024-2029 (%)

11.6.5 Nigeria - Market size and forecast 2024-2029

Chart on Nigeria - Market size and forecast 2024-2029 ($ million)
Data Table on Nigeria - Market size and forecast 2024-2029 ($ million)
Chart on Nigeria - Year-over-year growth 2024-2029 (%)
Data Table on Nigeria - Year-over-year growth 2024-2029 (%)

11.7 South America - Market size and forecast 2024-2029

Chart on South America - Market size and forecast 2024-2029 ($ million)
Data Table on South America - Market size and forecast 2024-2029 ($ million)
Chart on South America - Year-over-year growth 2024-2029 (%)
Data Table on South America - Year-over-year growth 2024-2029 (%)
Chart on Regional Comparison - South America
Data Table on Regional Comparison - South America

11.7.1 Brazil - Market size and forecast 2024-2029

Chart on Brazil - Market size and forecast 2024-2029 ($ million)
Data Table on Brazil - Market size and forecast 2024-2029 ($ million)
Chart on Brazil - Year-over-year growth 2024-2029 (%)
Data Table on Brazil - Year-over-year growth 2024-2029 (%)

11.7.2 Argentina - Market size and forecast 2024-2029

Chart on Argentina - Market size and forecast 2024-2029 ($ million)
Data Table on Argentina - Market size and forecast 2024-2029 ($ million)
Chart on Argentina - Year-over-year growth 2024-2029 (%)
Data Table on Argentina - Year-over-year growth 2024-2029 (%)

11.7.3 Chile - Market size and forecast 2024-2029

Chart on Chile - Market size and forecast 2024-2029 ($ million)
Data Table on Chile - Market size and forecast 2024-2029 ($ million)
Chart on Chile - Year-over-year growth 2024-2029 (%)
Data Table on Chile - Year-over-year growth 2024-2029 (%)

11.8 Market opportunity by geography

Market opportunity by geography ($ million)
Data Tables on Market opportunity by geography ($ million)

12. Drivers, Challenges, and Opportunity

12.1 Market drivers

Imperative for enhanced power efficiency in edge computing
Rising demand for low latency real time AI processing
Scaling limitations and manufacturing costs of advanced digital AI chips

12.2 Market challenges

Complex manufacturing processes and scalability hurdles
Overcoming inherent precision limitations and noise susceptibility
Nascent software ecosystem and algorithmic adaptation

12.3 Impact of drivers and challenges

Impact of drivers and challenges in 2024 and 2029

12.4 Market opportunities

Increasing imperative for energy-efficient edge AI processing
Addressing inherent bottlenecks and power demands of digital AI architectures
Technological advancements in memory computing and enabling materials

13. Competitive Landscape

13.1 Overview

13.2

Overview on criticality of inputs and factors of differentiation

13.3 Landscape disruption

Overview on factors of disruption

13.4 Industry risks

Impact of key risks on business

14. Competitive Analysis

14.1 Companies profiled

Companies covered

14.2 Company ranking index

14.3 Market positioning of companies

Matrix on companies position and classification

14.4 Analog Devices Inc.

Analog Devices Inc. - Overview
Analog Devices Inc. - Business segments
Analog Devices Inc. - Key news
Analog Devices Inc. - Key offerings
Analog Devices Inc. - Segment focus
SWOT

14.5 Aspinity Inc.

Aspinity Inc. - Overview
Aspinity Inc. - Product / Service
Aspinity Inc. - Key offerings
SWOT

14.6 Infineon Technologies AG

Infineon Technologies AG - Overview
Infineon Technologies AG - Business segments
Infineon Technologies AG - Key news
Infineon Technologies AG - Key offerings
Infineon Technologies AG - Segment focus
SWOT

14.7 Intel Corp.

Intel Corp. - Overview
Intel Corp. - Business segments
Intel Corp. - Key news
Intel Corp. - Key offerings
Intel Corp. - Segment focus
SWOT

14.8 IBM Corp.

IBM Corp. - Overview
IBM Corp. - Business segments
IBM Corp. - Key news
IBM Corp. - Key offerings
IBM Corp. - Segment focus
SWOT

14.9 Micron Technology Inc.

Micron Technology Inc. - Overview
Micron Technology Inc. - Business segments
Micron Technology Inc. - Key news
Micron Technology Inc. - Key offerings
Micron Technology Inc. - Segment focus
SWOT

14.10 Mythic Inc.

Mythic Inc. - Overview
Mythic Inc. - Product / Service
Mythic Inc. - Key offerings
SWOT

14.11 NXP Semiconductors NV

NXP Semiconductors NV - Overview
NXP Semiconductors NV - Product / Service
NXP Semiconductors NV - Key offerings
SWOT

14.12 PROPHESEE S.A.

PROPHESEE S.A. - Overview
PROPHESEE S.A. - Product / Service
PROPHESEE S.A. - Key offerings
SWOT

14.13 Qualcomm Inc.

Qualcomm Inc. - Overview
Qualcomm Inc. - Business segments
Qualcomm Inc. - Key news
Qualcomm Inc. - Key offerings
Qualcomm Inc. - Segment focus
SWOT

14.14 Samsung Electronics Co. Ltd.

Samsung Electronics Co. Ltd. - Overview
Samsung Electronics Co. Ltd. - Business segments
Samsung Electronics Co. Ltd. - Key news
Samsung Electronics Co. Ltd. - Key offerings
Samsung Electronics Co. Ltd. - Segment focus
SWOT

14.15 STMicroelectronics NV

STMicroelectronics NV - Overview
STMicroelectronics NV - Business segments
STMicroelectronics NV - Key news
STMicroelectronics NV - Key offerings
STMicroelectronics NV - Segment focus
SWOT

14.16 SynSense

SynSense - Overview
SynSense - Product / Service
SynSense - Key offerings
SWOT

14.17 Syntiant Corp.

Syntiant Corp. - Overview
Syntiant Corp. - Product / Service
Syntiant Corp. - Key offerings
SWOT

14.18 Texas Instruments Inc.

Texas Instruments Inc. - Overview
Texas Instruments Inc. - Business segments
Texas Instruments Inc. - Key offerings
Texas Instruments Inc. - Segment focus
SWOT

15. Appendix

15.1 Scope of the report

Market definition
Objectives
Notes and caveats

15.2 Inclusions and exclusions checklist

Inclusions checklist
Exclusions checklist

15.3 Currency conversion rates for US$

15.4 Research methodology

15.5 Data procurement

Information sources

15.6 Data validation

15.7 Validation techniques employed for market sizing

15.8 Data synthesis

15.9 360 degree market analysis

15.10 List of abbreviations

Research Methodology

Technavio presents a detailed picture of the market by way of study, synthesis, and summation of data from multiple sources. The analysts have presented the various facets of the market with a particular focus on identifying the key industry influencers. The data thus presented is comprehensive, reliable, and the result of extensive research, both primary and secondary.

INFORMATION SOURCES

Primary sources

  • Manufacturers and suppliers
  • Channel partners
  • Industry experts
  • Strategic decision makers

Secondary sources

  • Industry journals and periodicals
  • Government data
  • Financial reports of key industry players
  • Historical data
  • Press releases

DATA ANALYSIS

Data Synthesis

  • Collation of data
  • Estimation of key figures
  • Analysis of derived insights

Data Validation

  • Triangulation with data models
  • Reference against proprietary databases
  • Corroboration with industry experts

REPORT WRITING

Qualitative

  • Market drivers
  • Market challenges
  • Market trends
  • Five forces analysis

Quantitative

  • Market size and forecast
  • Market segmentation
  • Geographical insights
  • Competitive landscape

Interested in this report?

Get your sample now to see our research methodology and insights!

Download Now

Frequently Asked Questions

Analog AI Chip market growth will increase by USD 3962.1 million during 2025-2029.

The Analog AI Chip market is expected to grow at a CAGR of 23.1% during 2025-2029.

Analog AI Chip market is segmented by Technology (CMOS, Bipolar, BiCMOS) Application (Edge computing, Consumer electronics, Data center, Automotive, Healthcare) Component (Hardware, Software, Services)

Analog Devices Inc., Aspinity Inc., Infineon Technologies AG, Intel Corp., IBM Corp., Micron Technology Inc., Mythic Inc., NXP Semiconductors NV, PROPHESEE S.A., Qualcomm Inc., Rain Neuromorphics Inc., Renesas Electronics Corp., Samsung Electronics Co. Ltd., SK hynix Co. Ltd., Sony Group Corp., STMicroelectronics NV, SynSense, Syntiant Corp., Taiwan Semiconductor Co. Ltd., Texas Instruments Inc. are a few of the key vendors in the Analog AI Chip market.

North America will register the highest growth rate of 37.3% among the other regions. Therefore, the Analog AI Chip market in North America is expected to garner significant business opportunities for the vendors during the forecast period.

US, Canada, Mexico, China, Japan, South Korea, India, Indonesia, Australia, Germany, UK, France, The Netherlands, Italy, Spain, Saudi Arabia, UAE, South Africa, Egypt, Nigeria, Brazil, Argentina, Chile

  • Imperative for enhanced power efficiency in edge computing is the driving factor this market.

The Analog AI Chip market vendors should focus on grabbing business opportunities from the Technology segment as it accounted for the largest market share in the base year.