Super Fruit Juices Market Analysis, Size, and Forecast 2026-2030: Europe (Germany, UK, and France), North America (US, Canada, and Mexico), APAC (China, Japan, and India), Middle East and Africa (Saudi Arabia, UAE, and South Africa), South America (Brazil and Argentina), and Rest of World (ROW)

Super Fruit Juices Market Analysis, Size, and Forecast 2026-2030:
Europe (Germany, UK, and France), North America (US, Canada, and Mexico), APAC (China, Japan, and India), Middle East and Africa (Saudi Arabia, UAE, and South Africa), South America (Brazil and Argentina), and Rest of World (ROW)

Published: Apr 2026 285 Pages SKU: IRTNTR44996

Market Overview at a Glance

$9.63 B
Market Opportunity
10.4%
CAGR 2025 - 2030
32.7%
North America Growth
$8.36 B
Offline segment 2024

Super Fruit Juices Market Size 2026-2030

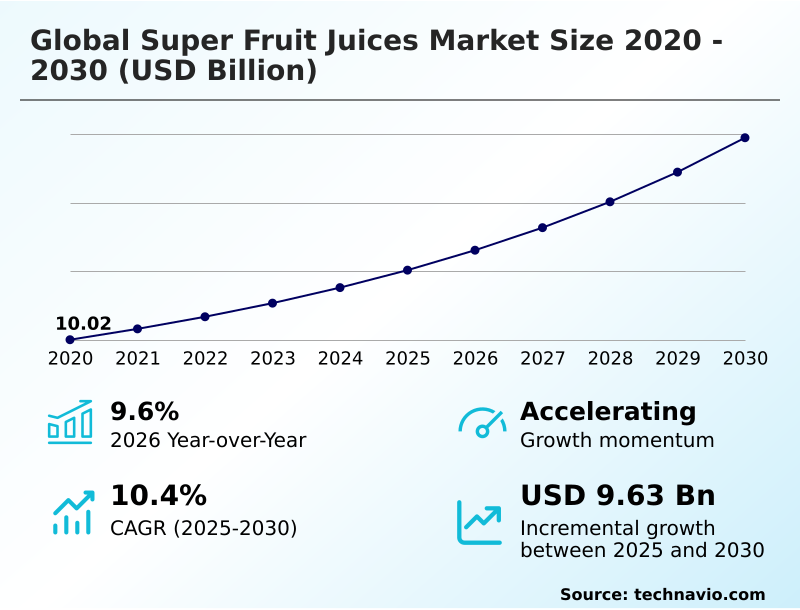
The super fruit juices market size is valued to increase by USD 9.63 billion, at a CAGR of 10.4% from 2025 to 2030. Heightened consumer awareness of preventive healthcare and nutritional literacy will drive the super fruit juices market.

Major Market Trends & Insights

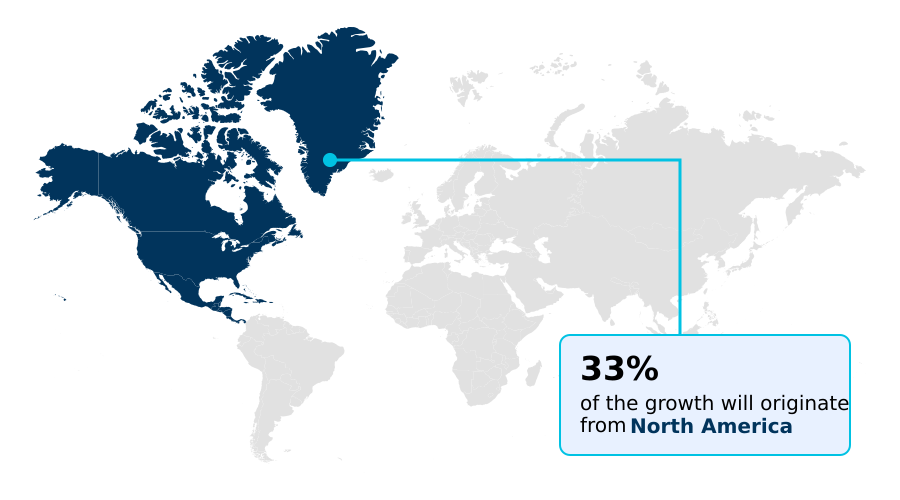
  • North America dominated the market and accounted for a 32.7% growth during the forecast period.
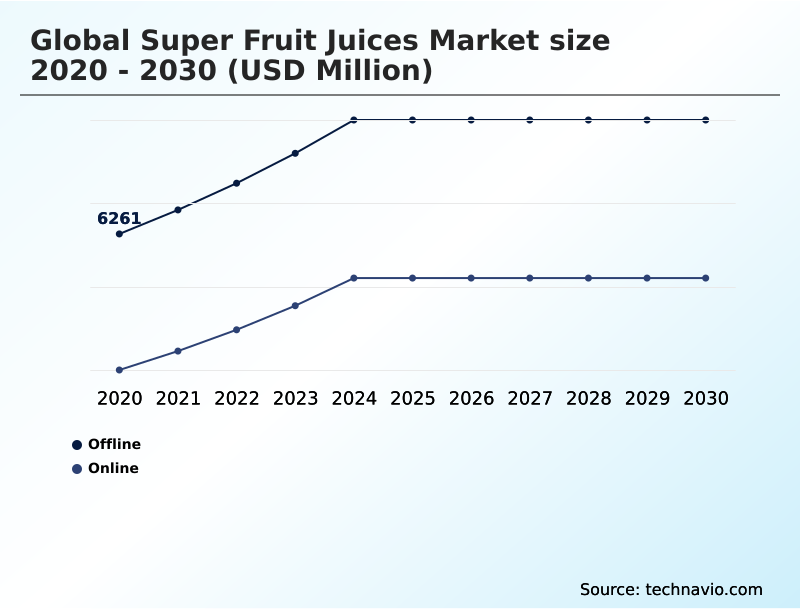
  • By Distribution Channel - Offline segment was valued at USD 8.36 billion in 2024
  • By Product Type - Hundred percent segment accounted for the largest market revenue share in 2024

Market Size & Forecast

  • Market Opportunities: USD 14.69 billion
  • Market Future Opportunities: USD 9.63 billion
  • CAGR from 2025 to 2030 : 10.4%

Market Summary

  • The super fruit juices market is defined by its alignment with the growing consumer demand for functional, nutrient-dense liquids. This evolution is driven by a shift toward preventive healthcare, where bioactive compounds and high antioxidant density are key purchasing criteria.
  • Trends such as functional fortification and the demand for clean label integrity are compelling producers to adopt advanced preservation techniques like high-pressure processing (HPP) and cold-pressed technology to ensure bioactive compound retention. For instance, a key operational focus is implementing farm-to-bottle traceability systems, which not only provides supply chain transparency but also validates the premium positioning of not-from-concentrate (NFC) juice.
  • This approach enhances brand trust and justifies higher price points despite volatile raw material costs. Consequently, the market is moving toward sophisticated personalized nutrition solutions that offer verifiable health benefits, transitioning from simple beverages to integral components of a wellness-focused lifestyle that favor plant-based diet alternatives.

What will be the Size of the Super Fruit Juices Market during the forecast period?

Get Key Insights on Market Forecast (PDF) Request Free Sample

How is the Super Fruit Juices Market Segmented?

The super fruit juices industry research report provides comprehensive data (region-wise segment analysis), with forecasts and estimates in "USD million" for the period 2026-2030, as well as historical data from 2020-2024 for the following segments.

  • Distribution channel
    • Offline
    • Online
  • Product type
    • Hundred percent
    • Zero to twenty four percent
    • Others
  • Type
    • Conventional
    • Organic
  • Geography
    • Europe
      • Germany
      • UK
      • France
    • North America
      • US
      • Canada
      • Mexico
    • APAC
      • China
      • Japan
      • India
    • Middle East and Africa
      • Saudi Arabia
      • UAE
      • South Africa
    • South America
      • Brazil
      • Argentina
    • Rest of World (ROW)

By Distribution Channel Insights

The offline segment is estimated to witness significant growth during the forecast period.

The offline channel, including supermarkets and health food stores, remains a cornerstone of the market.

It facilitates direct consumer engagement, allowing for the inspection of labels for details on phytochemicals and overall quality, a key factor for shoppers using micronutrient intake tracking apps.

Strategic in-store merchandising is vital for brand visibility amidst a competitive landscape focused on premium beverage positioning. This channel caters to impulse purchases by leveraging established cold chain logistics and effective shelf-life extension methods.

With in-store promotions driving regional incremental growth by up to 32.7%, it serves as a critical platform for launching new juice blending formulation products and educating consumers on benefits like enzymatic browning prevention, reinforcing trust through physical presence.

Request Free Sample

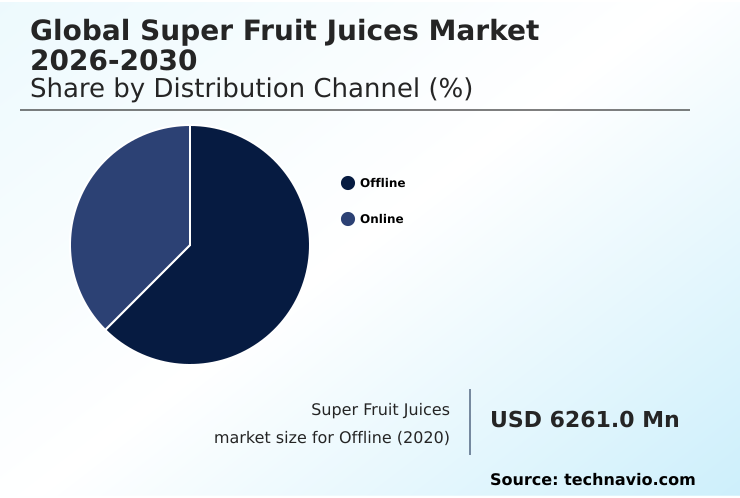
The Offline segment was valued at USD 8.36 billion in 2024 and showed a gradual increase during the forecast period.

Request Free Sample

Regional Analysis

North America is estimated to contribute 32.7% to the growth of the global market during the forecast period.Technavio’s analysts have elaborately explained the regional trends and drivers that shape the market during the forecast period.

See How Super Fruit Juices Market Demand is Rising in North America Request Free Sample

Regional dynamics show significant variation. North America commands 32.7% of incremental growth, driven by mature consumer wellness trends. In contrast, APAC accounts for 22.79% of the opportunity, with rising incomes fueling demand.

Europe distinguishes itself with a focus on organic certification standards and circular economy applications in packaging. Across these regions, operational efficiency is key; advanced pulsed electric field (PEF) processing has improved microbial stabilization by over 20% compared to older methods.

Techniques for juice clarification and sensory evaluation are adapted to local tastes, ensuring products meet both consumer expectations and stringent food safety regulations compliance in developed markets.

Market Dynamics

Our researchers analyzed the data with 2025 as the base year, along with the key drivers, trends, and challenges. A holistic analysis of drivers will help companies refine their marketing strategies to gain a competitive advantage.

  • The technical and commercial landscape of the market is increasingly complex, focusing on the impact of HPP on juice vitamins and the urgent need for clean label solutions for juice preservation. The consumer preference for functional juices is compelling companies to master formulating juices with botanical extracts and pursuing the fortification of juices with probiotics.
  • This requires meticulous measuring of antioxidant levels in beverages to substantiate claims. Operationally, managing the cost analysis of cold-pressed technology and extending the shelf life of NFC juices are critical for profitability. The industry must also navigate organic super fruit supply chain challenges and the persistent issue of managing price volatility of raw fruits.
  • Firms that successfully implement byproduct utilization from juice production report a reduction in raw material waste that is twice that of firms that do not. Strategies for marketing premium juices must now account for consumer perception of juice processing, while the impact of sugar tax on juice sales continues to drive innovation in natural sweetener use in beverages.
  • Simultaneously, ensuring regulatory compliance for functional claims and deploying traceability technology in the juice industry have become non-negotiable for building consumer trust amid sourcing challenges for exotic fruits.

What are the key market drivers leading to the rise in the adoption of Super Fruit Juices Industry?

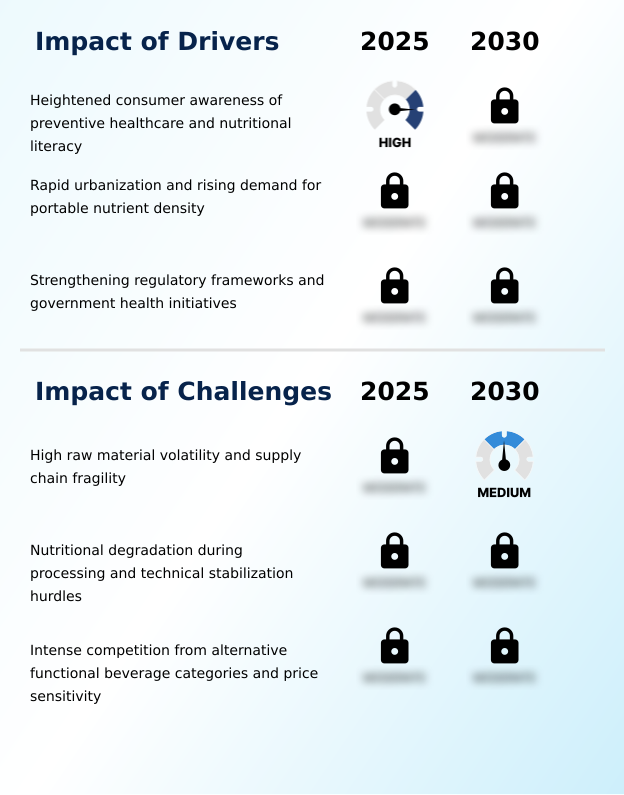
  • Heightened consumer awareness regarding preventive healthcare and nutritional literacy is a key driver for market growth.

  • Market drivers are rooted in the consumer shift toward preventive healthcare beverages, fueled by greater consumer nutritional literacy. Urbanization accelerates demand for on-the-go nutrition formats, making ready-to-drink convenience a primary purchasing factor.
  • This necessitates robust cold chain logistics and advanced preservation techniques like high-pressure processing (HPP), which can increase the retention of heat-sensitive bioactive compounds by up to 50%. This focus on antioxidant density supports premium beverage positioning.
  • Stricter food safety regulations compliance and a demand for supply chain transparency further reinforce the move toward high-quality, verifiably healthy products, with optimized logistics reducing spoilage by over 25%.

What are the market trends shaping the Super Fruit Juices Industry?

  • The market is increasingly shaped by the proliferation of functional fortification. This trend is driven by consumer demand for personalized wellness solutions.

  • Key market trends are centered on functional fortification and personalized nutrition solutions, moving beyond basic hydration. Consumers now demand clean label integrity, driving the adoption of not-from-concentrate (NFC) juice and beverages aligned with plant-based diet alternatives. Sustainability is paramount, with sustainable sourcing and transparent ethical sourcing frameworks becoming standard.
  • Innovations in aseptic packaging and sugar reduction strategies using natural ingredient sourcing are critical. Forward-thinking firms utilizing byproduct valorization report waste stream reductions of up to 40%, while those transparent about sourcing see a 15% higher consumer loyalty rate, reflecting a market defined by fortified beverage development and holistic consumer wellness trends.

What challenges does the Super Fruit Juices Industry face during its growth?

  • High raw material volatility and supply chain fragility are key challenges affecting industry growth.

  • Significant challenges stem from high raw material volatility, with managing price volatility of raw fruits impacting production costs by up to 30% seasonally. This creates complexity in sourcing challenges for exotic fruits. Technically, preventing nutrient loss requires constant nutritional degradation analysis and advanced shelf-life stabilization methods.
  • While cold-pressed technology is popular, a thorough cost analysis of cold-pressed technology reveals high capital costs; high hydrostatic pressure (HHP) lines can be double the cost of traditional equipment. Maintaining flavor profile consistency and developing allergen-free formulations add further operational complexity, testing the viability of premium offerings against intense competition.

Exclusive Technavio Analysis on Customer Landscape

The super fruit juices market forecasting report includes the adoption lifecycle of the market, covering from the innovator’s stage to the laggard’s stage. It focuses on adoption rates in different regions based on penetration. Furthermore, the super fruit juices market report also includes key purchase criteria and drivers of price sensitivity to help companies evaluate and develop their market growth analysis strategies.

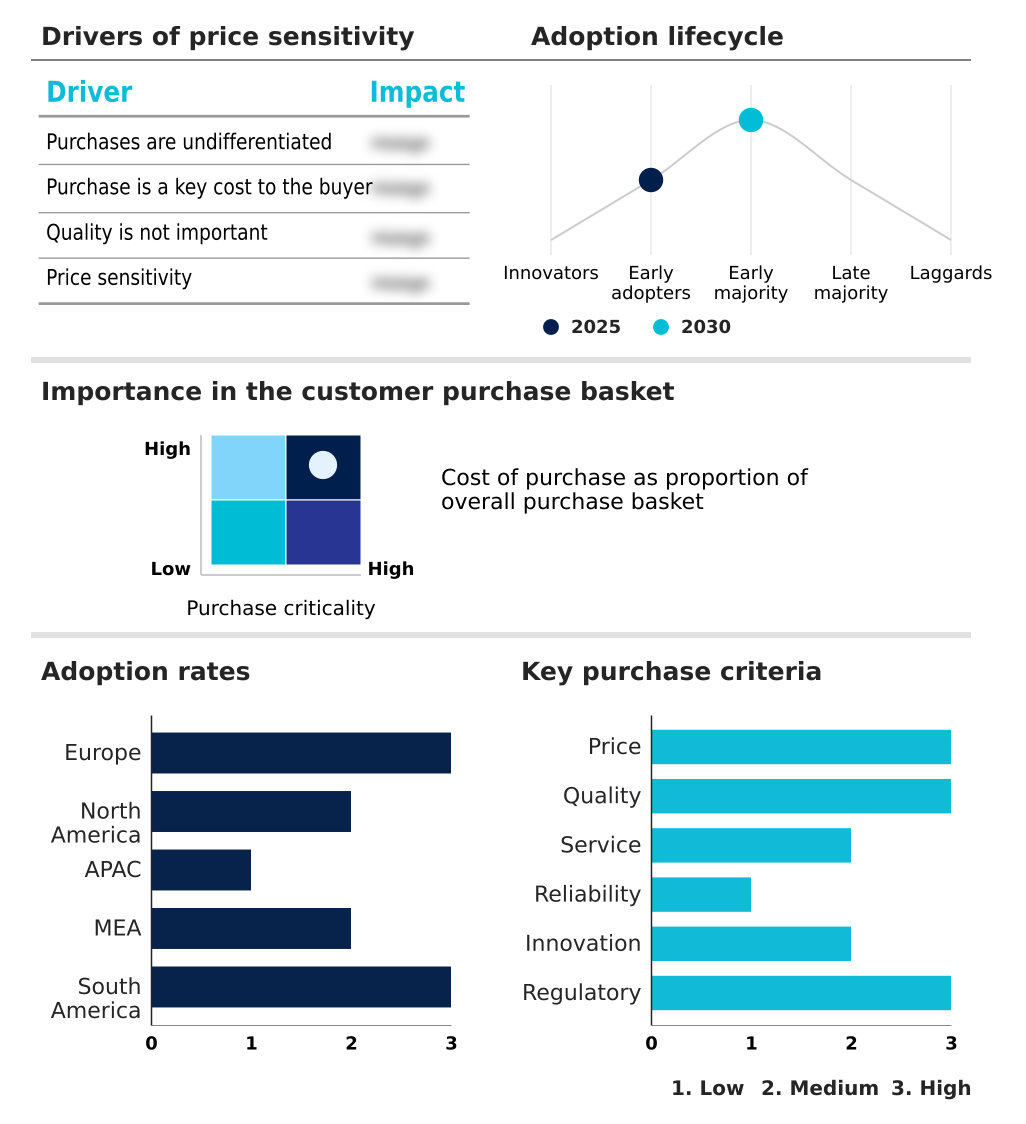
Customer Landscape of Super Fruit Juices Industry

Competitive Landscape

Companies are implementing various strategies, such as strategic alliances, super fruit juices market forecast, partnerships, mergers and acquisitions, geographical expansion, and product/service launches, to enhance their presence in the industry.

Amafruits LLC - Offerings center on nutrient-dense, functional beverages derived from fruits with high antioxidant value, meeting demand for plant-based, preventative health solutions.

The industry research and growth report includes detailed analyses of the competitive landscape of the market and information about key companies, including:

  • Amafruits LLC
  • Biotta AG
  • Bolthouse Farms Inc.
  • Cheribundi Inc.
  • Evolution Fresh LLC.
  • Goya Foods Inc.
  • Innocent Drinks
  • Lakewood Juice Co
  • Langer Juice Co. Inc.
  • Naked Juice Co.
  • Nutraceutical Corp
  • Ocean Spray Cranberries Inc.
  • Old Orchard Brands
  • POM Wonderful LLC
  • R.W. Knudsen Family
  • Rabenhorst
  • Sambazon Inc.
  • Smart Juices LLC
  • Suja Life LLC
  • The Campbell Co.

Qualitative and quantitative analysis of companies has been conducted to help clients understand the wider business environment as well as the strengths and weaknesses of key industry players. Data is qualitatively analyzed to categorize companies as pure play, category-focused, industry-focused, and diversified; it is quantitatively analyzed to categorize companies as dominant, leading, strong, tentative, and weak.

Recent Development and News in Super fruit juices market

  • In January 2025, Ocean Spray Cranberries Inc. entered the powdered drink mix category through a partnership with Dyla Brands, launching a zero-sugar line to capture demand for convenient, on-the-go beverage options.
  • In February 2025, Solevita, a Lidl brand, introduced a naturally cloudy apple juice in Europe, marketed for its high polyphenol content to appeal to consumers seeking minimally processed, nutrient-rich beverages.
  • In March 2025, Tropicana launched its Fresh and Light product line in the United Kingdom, a blended fruit juice drink with 30% less sugar, directly addressing consumer health concerns and cost pressures.
  • In April 2025, Minute Maid initiated a major brand repositioning with its 'Bring the Juice' platform, highlighted by a multi-year partnership with World Wrestling Entertainment (WWE) to engage a younger, multicultural audience.

Dive into Technavio’s robust research methodology, blending expert interviews, extensive data synthesis, and validated models for unparalleled Super Fruit Juices Market insights. See full methodology.

Market Scope
Page number 285
Base year 2025
Historic period 2020-2024
Forecast period 2026-2030
Growth momentum & CAGR Accelerate at a CAGR of 10.4%
Market growth 2026-2030 USD 9625.1 million
Market structure Fragmented
YoY growth 2025-2026(%) 9.6%
Key countries Germany, UK, France, Italy, Spain, The Netherlands, US, Canada, Mexico, China, Japan, India, South Korea, Australia, Indonesia, Saudi Arabia, UAE, South Africa, Israel, Turkey, Brazil, Argentina and Chile
Competitive landscape Leading Companies, Market Positioning of Companies, Competitive Strategies, and Industry Risks

Request Free Sample

Research Analyst Overview

  • The super fruit juices market is evolving from a beverage category into a functional nutrition platform, driven by consumer demand for demonstrable health outcomes. Boardroom-level strategy is now dictated by the need for clean label standards and organic certification standards, which directly impacts R&D budgets for new juice blending formulation and supply chain decisions regarding ethical sourcing practices.
  • The adoption of high hydrostatic pressure (HHP) has enabled manufacturers to achieve a 20% longer shelf life for not-from-concentrate (NFC) juice while ensuring bioactive compound retention, a key differentiator. The technical focus is on high-pressure processing (HPP), cold-pressed technology, and pulsed electric field (PEF) processing to preserve the integrity of phytochemicals and deliver high antioxidant density.
  • Operational imperatives include achieving flavor profile consistency through advanced aseptic filling technology and juice clarification, alongside effective microbial stabilization and the prevention of enzymatic browning, all while complying with stringent food safety regulations and exploring byproduct valorization.

What are the Key Data Covered in this Super Fruit Juices Market Research and Growth Report?

  • What is the expected growth of the Super Fruit Juices Market between 2026 and 2030?

    • USD 9.63 billion, at a CAGR of 10.4%

  • What segmentation does the market report cover?

    • The report is segmented by Distribution Channel (Offline, and Online), Product Type (Hundred percent, Zero to twenty four percent, and Others), Type (Conventional, and Organic) and Geography (Europe, North America, APAC, Middle East and Africa, South America)

  • Which regions are analyzed in the report?

    • Europe, North America, APAC, Middle East and Africa and South America

  • What are the key growth drivers and market challenges?

    • Heightened consumer awareness of preventive healthcare and nutritional literacy, High raw material volatility and supply chain fragility

  • Who are the major players in the Super Fruit Juices Market?

    • Amafruits LLC, Biotta AG, Bolthouse Farms Inc., Cheribundi Inc., Evolution Fresh LLC., Goya Foods Inc., Innocent Drinks, Lakewood Juice Co, Langer Juice Co. Inc., Naked Juice Co., Nutraceutical Corp, Ocean Spray Cranberries Inc., Old Orchard Brands, POM Wonderful LLC, R.W. Knudsen Family, Rabenhorst, Sambazon Inc., Smart Juices LLC, Suja Life LLC and The Campbell Co.

Market Research Insights

  • The market's dynamics are shaped by a strategic pivot towards a sophisticated functional beverage landscape, where preventive healthcare beverages are paramount. The adoption of advanced preservation techniques like High-Pressure Processing (HPP) has been shown to improve bioactive compound retention by up to 40% compared to traditional pasteurization, a critical metric for premium beverage positioning.
  • Furthermore, implementing comprehensive farm-to-bottle traceability systems correlates with a 15-20% increase in consumer loyalty for brands emphasizing clean label integrity. As consumer wellness trends intensify, sugar reduction strategies have become a key focus, with successful reformulations protecting profit margins by an average of 10% in regulated markets.
  • This environment demands a focus on personalized nutrition solutions and sustainable packaging materials to maintain a competitive edge.

We can help! Our analysts can customize this super fruit juices market research report to meet your requirements.

Get in touch

1. Executive Summary

1.1 Market overview

Executive Summary - Chart on Market Overview
Executive Summary - Data Table on Market Overview
Executive Summary - Chart on Global Market Characteristics
Executive Summary - Chart on Market by Geography
Executive Summary - Chart on Market Segmentation by Distribution Channel
Executive Summary - Chart on Market Segmentation by Product Type
Executive Summary - Chart on Market Segmentation by Type
Executive Summary - Chart on Incremental Growth
Executive Summary - Data Table on Incremental Growth
Executive Summary - Chart on Company Market Positioning

2. Technavio Analysis

2.1 Analysis of price sensitivity, lifecycle, customer purchase basket, adoption rates, and purchase criteria

2.2 Criticality of inputs and Factors of differentiation

Chart on Overview on criticality of inputs and factors of differentiation

2.3 Factors of disruption

Chart on Overview on factors of disruption

2.4 Impact of drivers and challenges

Chart on Impact of drivers and challenges in 2025 and 2030

3. Market Landscape

3.1 Market ecosystem

Chart on Parent Market
Data Table on - Parent Market

3.2 Market characteristics

Chart on Market characteristics analysis

3.3 Value chain analysis

Chart on Value chain analysis

4. Market Sizing

4.1 Market definition

Data Table on Offerings of companies included in the market definition

4.2 Market segment analysis

Market segments

4.3 Market size 2025

4.4 Market outlook: Forecast for 2025-2030

Chart on Global - Market size and forecast 2025-2030 ($ million)
Data Table on Global - Market size and forecast 2025-2030 ($ million)
Chart on Global Market: Year-over-year growth 2025-2030 (%)
Data Table on Global Market: Year-over-year growth 2025-2030 (%)

5. Historic Market Size

5.1 Global Super Fruit Juices Market 2020 - 2024

Historic Market Size - Data Table on Global Super Fruit Juices Market 2020 - 2024 ($ million)

5.2 Distribution Channel segment analysis 2020 - 2024

Historic Market Size - Distribution Channel Segment 2020 - 2024 ($ million)

5.3 Product Type segment analysis 2020 - 2024

Historic Market Size - Product Type Segment 2020 - 2024 ($ million)

5.4 Type segment analysis 2020 - 2024

Historic Market Size - Type Segment 2020 - 2024 ($ million)

5.5 Geography segment analysis 2020 - 2024

Historic Market Size - Geography Segment 2020 - 2024 ($ million)

5.6 Country segment analysis 2020 - 2024

Historic Market Size - Country Segment 2020 - 2024 ($ million)

6. Qualitative Analysis

6.1 Impact of AI on global super fruit juices market

6.2 Impact of geopolitical conflicts on global super fruit juices market

7. Five Forces Analysis

7.1 Five forces summary

Five forces analysis - Comparison between 2025 and 2030

7.2 Bargaining power of buyers

Bargaining power of buyers - Impact of key factors 2025 and 2030

7.3 Bargaining power of suppliers

Bargaining power of suppliers - Impact of key factors in 2025 and 2030

7.4 Threat of new entrants

Threat of new entrants - Impact of key factors in 2025 and 2030

7.5 Threat of substitutes

Threat of substitutes - Impact of key factors in 2025 and 2030

7.6 Threat of rivalry

Threat of rivalry - Impact of key factors in 2025 and 2030

7.7 Market condition

Chart on Market condition - Five forces 2025 and 2030

8. Market Segmentation by Distribution Channel

8.1 Market segments

Chart on Distribution Channel - Market share 2025-2030 (%)
Data Table on Distribution Channel - Market share 2025-2030 (%)

8.2 Comparison by Distribution Channel

Chart on Comparison by Distribution Channel
Data Table on Comparison by Distribution Channel

8.3 Offline - Market size and forecast 2025-2030

Chart on Offline - Market size and forecast 2025-2030 ($ million)
Data Table on Offline - Market size and forecast 2025-2030 ($ million)
Chart on Offline - Year-over-year growth 2025-2030 (%)
Data Table on Offline - Year-over-year growth 2025-2030 (%)

8.4 Online - Market size and forecast 2025-2030

Chart on Online - Market size and forecast 2025-2030 ($ million)
Data Table on Online - Market size and forecast 2025-2030 ($ million)
Chart on Online - Year-over-year growth 2025-2030 (%)
Data Table on Online - Year-over-year growth 2025-2030 (%)

8.5 Market opportunity by Distribution Channel

Market opportunity by Distribution Channel ($ million)
Data Table on Market opportunity by Distribution Channel ($ million)

9. Market Segmentation by Product Type

9.1 Market segments

Chart on Product Type - Market share 2025-2030 (%)
Data Table on Product Type - Market share 2025-2030 (%)

9.2 Comparison by Product Type

Chart on Comparison by Product Type
Data Table on Comparison by Product Type

9.3 Hundred percent - Market size and forecast 2025-2030

Chart on Hundred percent - Market size and forecast 2025-2030 ($ million)
Data Table on Hundred percent - Market size and forecast 2025-2030 ($ million)
Chart on Hundred percent - Year-over-year growth 2025-2030 (%)
Data Table on Hundred percent - Year-over-year growth 2025-2030 (%)

9.4 Zero to twenty four percent - Market size and forecast 2025-2030

Chart on Zero to twenty four percent - Market size and forecast 2025-2030 ($ million)
Data Table on Zero to twenty four percent - Market size and forecast 2025-2030 ($ million)
Chart on Zero to twenty four percent - Year-over-year growth 2025-2030 (%)
Data Table on Zero to twenty four percent - Year-over-year growth 2025-2030 (%)

9.5 Others - Market size and forecast 2025-2030

Chart on Others - Market size and forecast 2025-2030 ($ million)
Data Table on Others - Market size and forecast 2025-2030 ($ million)
Chart on Others - Year-over-year growth 2025-2030 (%)
Data Table on Others - Year-over-year growth 2025-2030 (%)

9.6 Market opportunity by Product Type

Market opportunity by Product Type ($ million)
Data Table on Market opportunity by Product Type ($ million)

10. Market Segmentation by Type

10.1 Market segments

Chart on Type - Market share 2025-2030 (%)
Data Table on Type - Market share 2025-2030 (%)

10.2 Comparison by Type

Chart on Comparison by Type
Data Table on Comparison by Type

10.3 Conventional - Market size and forecast 2025-2030

Chart on Conventional - Market size and forecast 2025-2030 ($ million)
Data Table on Conventional - Market size and forecast 2025-2030 ($ million)
Chart on Conventional - Year-over-year growth 2025-2030 (%)
Data Table on Conventional - Year-over-year growth 2025-2030 (%)

10.4 Organic - Market size and forecast 2025-2030

Chart on Organic - Market size and forecast 2025-2030 ($ million)
Data Table on Organic - Market size and forecast 2025-2030 ($ million)
Chart on Organic - Year-over-year growth 2025-2030 (%)
Data Table on Organic - Year-over-year growth 2025-2030 (%)

10.5 Market opportunity by Type

Market opportunity by Type ($ million)
Data Table on Market opportunity by Type ($ million)

11. Customer Landscape

11.1 Customer landscape overview

Analysis of price sensitivity, lifecycle, customer purchase basket, adoption rates, and purchase criteria

12. Geographic Landscape

12.1 Geographic segmentation

Chart on Market share by geography 2025-2030 (%)
Data Table on Market share by geography 2025-2030 (%)

12.2 Geographic comparison

Chart on Geographic comparison
Data Table on Geographic comparison

12.3 Europe - Market size and forecast 2025-2030

Chart on Europe - Market size and forecast 2025-2030 ($ million)
Data Table on Europe - Market size and forecast 2025-2030 ($ million)
Chart on Europe - Year-over-year growth 2025-2030 (%)
Data Table on Europe - Year-over-year growth 2025-2030 (%)
Chart on Regional Comparison - Europe
Data Table on Regional Comparison - Europe

12.3.1 Germany - Market size and forecast 2025-2030

Chart on Germany - Market size and forecast 2025-2030 ($ million)
Data Table on Germany - Market size and forecast 2025-2030 ($ million)
Chart on Germany - Year-over-year growth 2025-2030 (%)
Data Table on Germany - Year-over-year growth 2025-2030 (%)

12.3.2 UK - Market size and forecast 2025-2030

Chart on UK - Market size and forecast 2025-2030 ($ million)
Data Table on UK - Market size and forecast 2025-2030 ($ million)
Chart on UK - Year-over-year growth 2025-2030 (%)
Data Table on UK - Year-over-year growth 2025-2030 (%)

12.3.3 France - Market size and forecast 2025-2030

Chart on France - Market size and forecast 2025-2030 ($ million)
Data Table on France - Market size and forecast 2025-2030 ($ million)
Chart on France - Year-over-year growth 2025-2030 (%)
Data Table on France - Year-over-year growth 2025-2030 (%)

12.3.4 Italy - Market size and forecast 2025-2030

Chart on Italy - Market size and forecast 2025-2030 ($ million)
Data Table on Italy - Market size and forecast 2025-2030 ($ million)
Chart on Italy - Year-over-year growth 2025-2030 (%)
Data Table on Italy - Year-over-year growth 2025-2030 (%)

12.3.5 Spain - Market size and forecast 2025-2030

Chart on Spain - Market size and forecast 2025-2030 ($ million)
Data Table on Spain - Market size and forecast 2025-2030 ($ million)
Chart on Spain - Year-over-year growth 2025-2030 (%)
Data Table on Spain - Year-over-year growth 2025-2030 (%)

12.3.6 The Netherlands - Market size and forecast 2025-2030

Chart on The Netherlands - Market size and forecast 2025-2030 ($ million)
Data Table on The Netherlands - Market size and forecast 2025-2030 ($ million)
Chart on The Netherlands - Year-over-year growth 2025-2030 (%)
Data Table on The Netherlands - Year-over-year growth 2025-2030 (%)

12.4 North America - Market size and forecast 2025-2030

Chart on North America - Market size and forecast 2025-2030 ($ million)
Data Table on North America - Market size and forecast 2025-2030 ($ million)
Chart on North America - Year-over-year growth 2025-2030 (%)
Data Table on North America - Year-over-year growth 2025-2030 (%)
Chart on Regional Comparison - North America
Data Table on Regional Comparison - North America

12.4.1 US - Market size and forecast 2025-2030

Chart on US - Market size and forecast 2025-2030 ($ million)
Data Table on US - Market size and forecast 2025-2030 ($ million)
Chart on US - Year-over-year growth 2025-2030 (%)
Data Table on US - Year-over-year growth 2025-2030 (%)

12.4.2 Canada - Market size and forecast 2025-2030

Chart on Canada - Market size and forecast 2025-2030 ($ million)
Data Table on Canada - Market size and forecast 2025-2030 ($ million)
Chart on Canada - Year-over-year growth 2025-2030 (%)
Data Table on Canada - Year-over-year growth 2025-2030 (%)

12.4.3 Mexico - Market size and forecast 2025-2030

Chart on Mexico - Market size and forecast 2025-2030 ($ million)
Data Table on Mexico - Market size and forecast 2025-2030 ($ million)
Chart on Mexico - Year-over-year growth 2025-2030 (%)
Data Table on Mexico - Year-over-year growth 2025-2030 (%)

12.5 APAC - Market size and forecast 2025-2030

Chart on APAC - Market size and forecast 2025-2030 ($ million)
Data Table on APAC - Market size and forecast 2025-2030 ($ million)
Chart on APAC - Year-over-year growth 2025-2030 (%)
Data Table on APAC - Year-over-year growth 2025-2030 (%)
Chart on Regional Comparison - APAC
Data Table on Regional Comparison - APAC

12.5.1 China - Market size and forecast 2025-2030

Chart on China - Market size and forecast 2025-2030 ($ million)
Data Table on China - Market size and forecast 2025-2030 ($ million)
Chart on China - Year-over-year growth 2025-2030 (%)
Data Table on China - Year-over-year growth 2025-2030 (%)

12.5.2 Japan - Market size and forecast 2025-2030

Chart on Japan - Market size and forecast 2025-2030 ($ million)
Data Table on Japan - Market size and forecast 2025-2030 ($ million)
Chart on Japan - Year-over-year growth 2025-2030 (%)
Data Table on Japan - Year-over-year growth 2025-2030 (%)

12.5.3 India - Market size and forecast 2025-2030

Chart on India - Market size and forecast 2025-2030 ($ million)
Data Table on India - Market size and forecast 2025-2030 ($ million)
Chart on India - Year-over-year growth 2025-2030 (%)
Data Table on India - Year-over-year growth 2025-2030 (%)

12.5.4 South Korea - Market size and forecast 2025-2030

Chart on South Korea - Market size and forecast 2025-2030 ($ million)
Data Table on South Korea - Market size and forecast 2025-2030 ($ million)
Chart on South Korea - Year-over-year growth 2025-2030 (%)
Data Table on South Korea - Year-over-year growth 2025-2030 (%)

12.5.5 Australia - Market size and forecast 2025-2030

Chart on Australia - Market size and forecast 2025-2030 ($ million)
Data Table on Australia - Market size and forecast 2025-2030 ($ million)
Chart on Australia - Year-over-year growth 2025-2030 (%)
Data Table on Australia - Year-over-year growth 2025-2030 (%)

12.5.6 Indonesia - Market size and forecast 2025-2030

Chart on Indonesia - Market size and forecast 2025-2030 ($ million)
Data Table on Indonesia - Market size and forecast 2025-2030 ($ million)
Chart on Indonesia - Year-over-year growth 2025-2030 (%)
Data Table on Indonesia - Year-over-year growth 2025-2030 (%)

12.6 Middle East and Africa - Market size and forecast 2025-2030

Chart on Middle East and Africa - Market size and forecast 2025-2030 ($ million)
Data Table on Middle East and Africa - Market size and forecast 2025-2030 ($ million)
Chart on Middle East and Africa - Year-over-year growth 2025-2030 (%)
Data Table on Middle East and Africa - Year-over-year growth 2025-2030 (%)
Chart on Regional Comparison - Middle East and Africa
Data Table on Regional Comparison - Middle East and Africa

12.6.1 Saudi Arabia - Market size and forecast 2025-2030

Chart on Saudi Arabia - Market size and forecast 2025-2030 ($ million)
Data Table on Saudi Arabia - Market size and forecast 2025-2030 ($ million)
Chart on Saudi Arabia - Year-over-year growth 2025-2030 (%)
Data Table on Saudi Arabia - Year-over-year growth 2025-2030 (%)

12.6.2 UAE - Market size and forecast 2025-2030

Chart on UAE - Market size and forecast 2025-2030 ($ million)
Data Table on UAE - Market size and forecast 2025-2030 ($ million)
Chart on UAE - Year-over-year growth 2025-2030 (%)
Data Table on UAE - Year-over-year growth 2025-2030 (%)

12.6.3 South Africa - Market size and forecast 2025-2030

Chart on South Africa - Market size and forecast 2025-2030 ($ million)
Data Table on South Africa - Market size and forecast 2025-2030 ($ million)
Chart on South Africa - Year-over-year growth 2025-2030 (%)
Data Table on South Africa - Year-over-year growth 2025-2030 (%)

12.6.4 Israel - Market size and forecast 2025-2030

Chart on Israel - Market size and forecast 2025-2030 ($ million)
Data Table on Israel - Market size and forecast 2025-2030 ($ million)
Chart on Israel - Year-over-year growth 2025-2030 (%)
Data Table on Israel - Year-over-year growth 2025-2030 (%)

12.6.5 Turkey - Market size and forecast 2025-2030

Chart on Turkey - Market size and forecast 2025-2030 ($ million)
Data Table on Turkey - Market size and forecast 2025-2030 ($ million)
Chart on Turkey - Year-over-year growth 2025-2030 (%)
Data Table on Turkey - Year-over-year growth 2025-2030 (%)

12.7 South America - Market size and forecast 2025-2030

Chart on South America - Market size and forecast 2025-2030 ($ million)
Data Table on South America - Market size and forecast 2025-2030 ($ million)
Chart on South America - Year-over-year growth 2025-2030 (%)
Data Table on South America - Year-over-year growth 2025-2030 (%)
Chart on Regional Comparison - South America
Data Table on Regional Comparison - South America

12.7.1 Brazil - Market size and forecast 2025-2030

Chart on Brazil - Market size and forecast 2025-2030 ($ million)
Data Table on Brazil - Market size and forecast 2025-2030 ($ million)
Chart on Brazil - Year-over-year growth 2025-2030 (%)
Data Table on Brazil - Year-over-year growth 2025-2030 (%)

12.7.2 Argentina - Market size and forecast 2025-2030

Chart on Argentina - Market size and forecast 2025-2030 ($ million)
Data Table on Argentina - Market size and forecast 2025-2030 ($ million)
Chart on Argentina - Year-over-year growth 2025-2030 (%)
Data Table on Argentina - Year-over-year growth 2025-2030 (%)

12.7.3 Chile - Market size and forecast 2025-2030

Chart on Chile - Market size and forecast 2025-2030 ($ million)
Data Table on Chile - Market size and forecast 2025-2030 ($ million)
Chart on Chile - Year-over-year growth 2025-2030 (%)
Data Table on Chile - Year-over-year growth 2025-2030 (%)

12.8 Market opportunity by geography

Market opportunity by geography ($ million)
Data Tables on Market opportunity by geography ($ million)

13. Drivers, Challenges, and Opportunity

13.1 Market drivers

Heightened consumer awareness of preventive healthcare and nutritional literacy
Rapid urbanization and rising demand for portable nutrient density
Strengthening regulatory frameworks and government health initiatives

13.2 Market challenges

High raw material volatility and supply chain fragility
Nutritional degradation during processing and technical stabilization hurdles
Intense competition from alternative functional beverage categories and price sensitivity

13.3 Impact of drivers and challenges

Impact of drivers and challenges in 2025 and 2030

13.4 Market opportunities

Proliferation of functional fortification and personalized wellness
Radical transparency and evolution of clean label standards
Sustainability and ethical sourcing as core brand values

14. Competitive Landscape

14.1 Overview

14.2

Overview on criticality of inputs and factors of differentiation

14.3 Landscape disruption

Overview on factors of disruption

14.4 Industry risks

Impact of key risks on business

15. Competitive Analysis

15.1 Companies profiled

Companies covered

15.2 Company ranking index

15.3 Market positioning of companies

Matrix on companies position and classification

15.4 Amafruits LLC

Amafruits LLC - Overview
Amafruits LLC - Product / Service
Amafruits LLC - Key offerings
SWOT

15.5 Bolthouse Farms Inc.

Bolthouse Farms Inc. - Overview
Bolthouse Farms Inc. - Product / Service
Bolthouse Farms Inc. - Key offerings
SWOT

15.6 Evolution Fresh LLC.

Evolution Fresh LLC. - Overview
Evolution Fresh LLC. - Product / Service
Evolution Fresh LLC. - Key offerings
SWOT

15.7 Goya Foods Inc.

Goya Foods Inc. - Overview
Goya Foods Inc. - Product / Service
Goya Foods Inc. - Key offerings
SWOT

15.8 Innocent Drinks

Innocent Drinks - Overview
Innocent Drinks - Product / Service
Innocent Drinks - Key offerings
SWOT

15.9 Lakewood Juice Co

Lakewood Juice Co - Overview
Lakewood Juice Co - Product / Service
Lakewood Juice Co - Key offerings
SWOT

15.10 Langer Juice Co. Inc.

Langer Juice Co. Inc. - Overview
Langer Juice Co. Inc. - Product / Service
Langer Juice Co. Inc. - Key offerings
SWOT

15.11 Naked Juice Co.

Naked Juice Co. - Overview
Naked Juice Co. - Product / Service
Naked Juice Co. - Key offerings
SWOT

15.12 Ocean Spray Cranberries Inc.

Ocean Spray Cranberries Inc. - Overview
Ocean Spray Cranberries Inc. - Product / Service
Ocean Spray Cranberries Inc. - Key offerings
SWOT

15.13 Old Orchard Brands

Old Orchard Brands - Overview
Old Orchard Brands - Product / Service
Old Orchard Brands - Key offerings
SWOT

15.14 POM Wonderful LLC

POM Wonderful LLC - Overview
POM Wonderful LLC - Product / Service
POM Wonderful LLC - Key offerings
SWOT

15.15 Sambazon Inc.

Sambazon Inc. - Overview
Sambazon Inc. - Product / Service
Sambazon Inc. - Key offerings
SWOT

15.16 Smart Juices LLC

Smart Juices LLC - Overview
Smart Juices LLC - Product / Service
Smart Juices LLC - Key offerings
SWOT

15.17 Suja Life LLC

Suja Life LLC - Overview
Suja Life LLC - Product / Service
Suja Life LLC - Key offerings
SWOT

15.18 The Campbell Co.

The Campbell Co. - Overview
The Campbell Co. - Business segments
The Campbell Co. - Key news
The Campbell Co. - Key offerings
The Campbell Co. - Segment focus
SWOT

16. Appendix

16.1 Scope of the report

Market definition
Objectives
Notes and caveats

16.2 Inclusions and exclusions checklist

Inclusions checklist
Exclusions checklist

16.3 Currency conversion rates for US$

16.4 Research methodology

16.5 Data procurement

Information sources

16.6 Data validation

16.7 Validation techniques employed for market sizing

16.8 Data synthesis

16.9 360 degree market analysis

16.10 List of abbreviations

Research Methodology

Technavio presents a detailed picture of the market by way of study, synthesis, and summation of data from multiple sources. The analysts have presented the various facets of the market with a particular focus on identifying the key industry influencers. The data thus presented is comprehensive, reliable, and the result of extensive research, both primary and secondary.

INFORMATION SOURCES

Primary sources

  • Manufacturers and suppliers
  • Channel partners
  • Industry experts
  • Strategic decision makers

Secondary sources

  • Industry journals and periodicals
  • Government data
  • Financial reports of key industry players
  • Historical data
  • Press releases

DATA ANALYSIS

Data Synthesis

  • Collation of data
  • Estimation of key figures
  • Analysis of derived insights

Data Validation

  • Triangulation with data models
  • Reference against proprietary databases
  • Corroboration with industry experts

REPORT WRITING

Qualitative

  • Market drivers
  • Market challenges
  • Market trends
  • Five forces analysis

Quantitative

  • Market size and forecast
  • Market segmentation
  • Geographical insights
  • Competitive landscape

Interested in this report?

Get your sample now to see our research methodology and insights!

Download Now

Frequently Asked Questions

Super Fruit Juices market growth will increase by USD 9625.1 million during 2026-2030.

The Super Fruit Juices market is expected to grow at a CAGR of 10.4% during 2026-2030.

Super Fruit Juices market is segmented by Distribution channel (Offline, Online) Product type (Hundred percent, Zero to twenty four percent, Others) Type (Conventional, Organic)

Amafruits LLC, Biotta AG, Bolthouse Farms Inc., Cheribundi Inc., Evolution Fresh LLC., Goya Foods Inc., Innocent Drinks, Lakewood Juice Co, Langer Juice Co. Inc., Naked Juice Co., Nutraceutical Corp, Ocean Spray Cranberries Inc., Old Orchard Brands, POM Wonderful LLC, R.W. Knudsen Family, Rabenhorst, Sambazon Inc., Smart Juices LLC, Suja Life LLC, The Campbell Co. are a few of the key vendors in the Super Fruit Juices market.

North America will register the highest growth rate of 32.7% among the other regions. Therefore, the Super Fruit Juices market in North America is expected to garner significant business opportunities for the vendors during the forecast period.

Germany, UK, France, Italy, Spain, The Netherlands, US, Canada, Mexico, China, Japan, India, South Korea, Australia, Indonesia, Saudi Arabia, UAE, South Africa, Israel, Turkey, Brazil, Argentina, Chile

  • Heightened consumer awareness of preventive healthcare and nutritional literacy is the driving factor this market.

The Super Fruit Juices market vendors should focus on grabbing business opportunities from the Distribution channel segment as it accounted for the largest market share in the base year.
RIA - Research AI Assistant
Ask RIA