Application Development And Integration Market Analysis, Size, and Forecast 2025-2029: North America (US, Canada, and Mexico), Europe (Germany, UK, and France), APAC (China, Japan, and India), South America (Brazil and Argentina), Middle East and Africa (South Africa, UAE, and Saudi Arabia), and Rest of World (ROW)

Application Development And Integration Market Analysis, Size, and Forecast 2025-2029:
North America (US, Canada, and Mexico), Europe (Germany, UK, and France), APAC (China, Japan, and India), South America (Brazil and Argentina), Middle East and Africa (South Africa, UAE, and Saudi Arabia), and Rest of World (ROW)

Published: Dec 2025 302 Pages SKU: IRTNTR73047

Market Overview at a Glance

$76.4 B
Market Opportunity
6.4%
CAGR 2024 - 2029
43.6%
North America Growth
$148.5 B
Application development segment 2023

Application Development And Integration Market Size 2025-2029

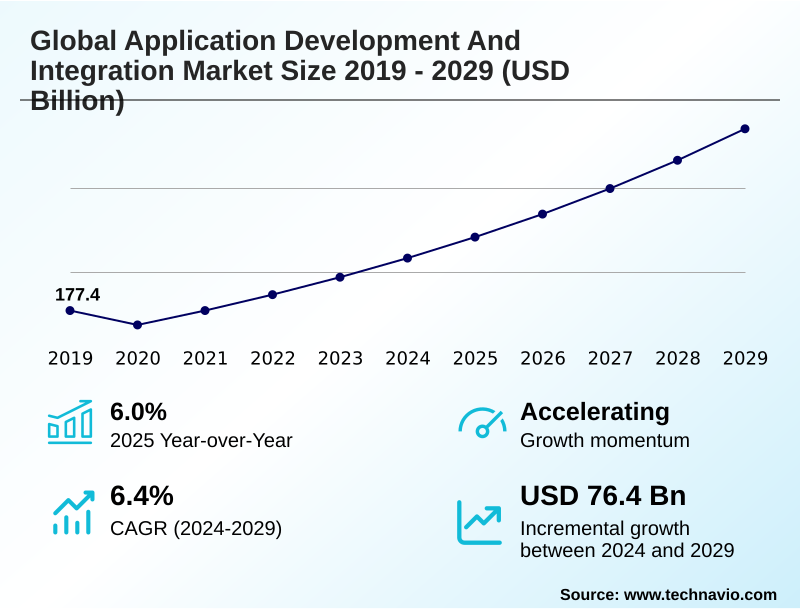
The application development and integration market size is valued to increase by USD 76.4 billion, at a CAGR of 6.4% from 2024 to 2029. Advantage of cost reduction due to operational streamlining will drive the application development and integration market.

Major Market Trends & Insights

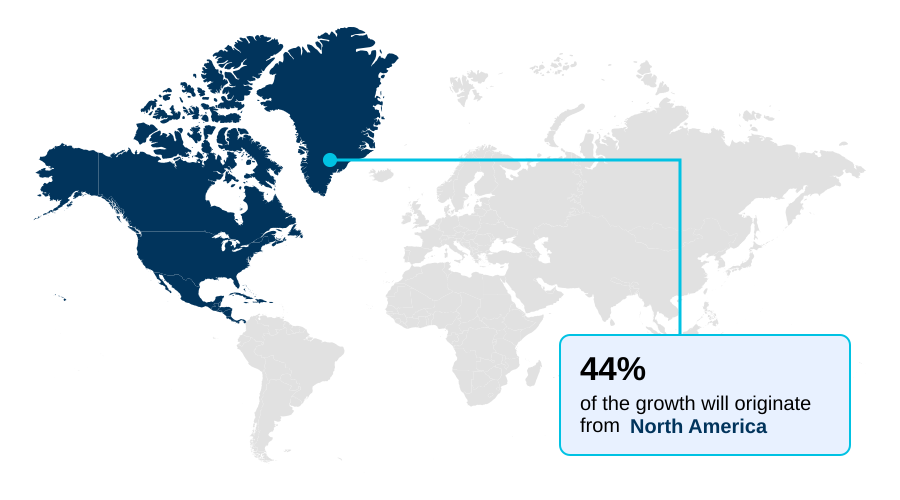
  • North America dominated the market and accounted for a 43.6% growth during the forecast period.
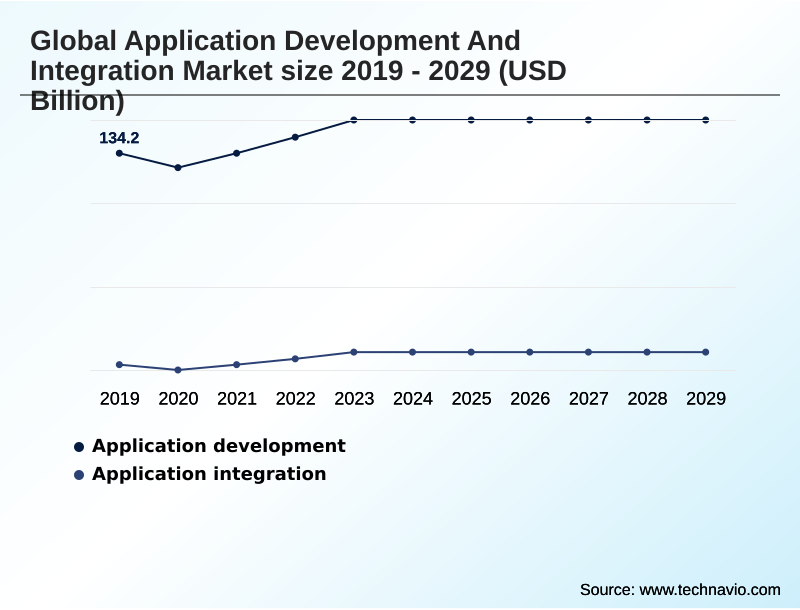
  • By Product - Application development segment was valued at USD 148.5 billion in 2023
  • By Deployment - On-premises segment accounted for the largest market revenue share in 2023

Market Size & Forecast

  • Market Opportunities: USD 107.4 billion
  • Market Future Opportunities: USD 76.4 billion
  • CAGR from 2024 to 2029 : 6.4%

Market Summary

  • The application development and integration market is pivotal to modern digital transformation, enabling enterprises to innovate and streamline operations. Driven by the need for greater agility, organizations are undergoing agile transformation, moving away from monolithic systems toward cloud-native architecture and microservices. This shift necessitates sophisticated system integration strategies, particularly for companies managing a mix of new and legacy systems.
  • A key trend is the adoption of iPaaS and low-code platforms, which democratize development and accelerate business process automation. In a typical business scenario, a manufacturing firm might implement a hybrid integration solution to connect its on-premises enterprise resource planning system with a cloud-based customer relationship management platform.
  • This real-time data integration allows for a unified view of the supply chain and customer orders, enhancing decision-making. However, the market faces challenges related to data security and interoperability, demanding a strong focus on DevSecOps and secure application development.
  • The rise of API-led connectivity and service mesh technologies helps manage these complex, distributed environments, ensuring that both custom-built and SaaS applications can communicate seamlessly and securely.

What will be the Size of the Application Development And Integration Market during the forecast period?

Get Key Insights on Market Forecast (PDF) Request Free Sample

How is the Application Development And Integration Market Segmented?

The application development and integration industry research report provides comprehensive data (region-wise segment analysis), with forecasts and estimates in "USD billion" for the period 2025-2029, as well as historical data from 2019-2023 for the following segments.

  • Product
    • Application development
    • Application integration
  • Deployment
    • On-premises
    • Cloud
  • Type
    • Web applications
    • Mobile applications
    • Desktop applications
  • Geography
    • North America
      • US
      • Canada
      • Mexico
    • Europe
      • Germany
      • UK
      • France
    • APAC
      • China
      • Japan
      • India
    • South America
      • Brazil
      • Argentina
    • Middle East and Africa
      • South Africa
      • UAE
      • Saudi Arabia
    • Rest of World (ROW)

By Product Insights

The application development segment is estimated to witness significant growth during the forecast period.

The application development segment is driven by ongoing business transformation, as enterprises digitalize processes to achieve operational efficiency. Organizations are pursuing agile transformation and adopting agile and devops methodologies to accelerate application lifecycle management.

There is a constant demand for custom application development tailored to specific business needs, resulting in a focus on effective application portfolio management. The process involves utilizing a robust software development kit and ensuring strong DevOps support for continuous delivery.

This segment also sees growing investment in application modernization and advanced capabilities like predictive analytics, with successful system integration projects improving deployment frequency by over 40% and reducing post-launch defects.

This strategic focus ensures that application landscapes evolve to meet dynamic business demands.

Request Free Sample

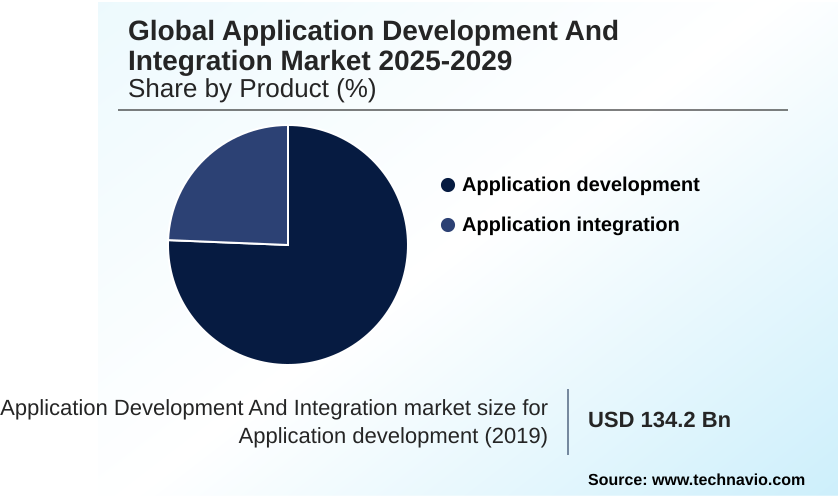
The Application development segment was valued at USD 148.5 billion in 2023 and showed a gradual increase during the forecast period.

Request Free Sample

Regional Analysis

North America is estimated to contribute 43.6% to the growth of the global market during the forecast period.Technavio’s analysts have elaborately explained the regional trends and drivers that shape the market during the forecast period.

See How Application Development And Integration Market Demand is Rising in North America Request Free Sample

The market's geographic landscape is led by North America, which is a hub for technological innovation in cloud computing and AI. Enterprises in this region are rapidly adopting digital transformation strategies, driving demand for modern application development and integration tools.

This includes the implementation of microservices, scalable backend services, and advanced API management platforms. Stringent data protection regulations in both North America and Europe are fueling a 20% rise in demand for solutions with robust, built-in security features.

In APAC, the proliferation of mobile devices and SMEs is accelerating the adoption of cost-effective integration platform as a service (iPaaS) solutions.

These platforms are essential for connecting disparate systems, including customer relationship management (CRM) software, to create a unified operational view.

Market Dynamics

Our researchers analyzed the data with 2024 as the base year, along with the key drivers, trends, and challenges. A holistic analysis of drivers will help companies refine their marketing strategies to gain a competitive advantage.

  • Strategic planning in today's digital economy requires a deep understanding of the cost of migrating legacy systems to cloud and the benefits of hybrid application integration technology. Enterprises face significant challenges in enterprise saas application integration, making it crucial to know how to implement a secure devsecops pipeline for risk mitigation.
  • Following best practices for api management and governance is no longer optional. A key decision point is choosing between low-code and custom development, a choice that profoundly shapes resource allocation and time-to-market. The impact of ai on application development is accelerating this, with a focus on improving developer productivity with ai tools.
  • The necessity of real-time data synchronization across hybrid cloud is driving the adoption of platforms for automating workflows with ipaas solutions. Furthermore, the ubiquity of mobile requires seamless mobile application integration with backend services. Security remains a top concern, centered on securely connecting on-premises and cloud applications.
  • For established companies, developing strategies for modernizing monolithic applications is essential for survival, often involving the role of service mesh in microservices. Technical teams frequently perform a cross-platform development frameworks comparison to balance performance and cost. Ultimately, solving enterprise resource planning system integration challenges and customer relationship management data integration methods is fundamental to achieving operational efficiency through process automation.
  • In fact, firms that successfully integrate these core systems report operational efficiencies more than 35% higher than their less-integrated peers. This focus extends to integrating iot data with enterprise systems and effectively managing application portfolios for cost optimization.

What are the key market drivers leading to the rise in the adoption of Application Development And Integration Industry?

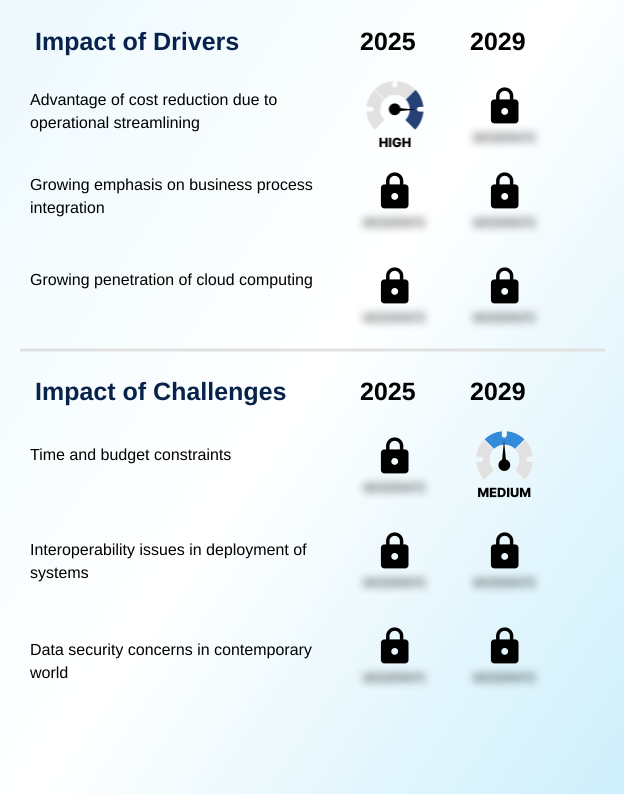
  • A primary market driver is the significant cost reduction advantage achieved through operational streamlining enabled by cohesive application development and integration strategies.

  • The growing emphasis on efficient business process integration is a significant market driver. Enterprises are investing in IT infrastructure modernization and cloud application development to streamline operations and reduce costs, with some achieving a 20% reduction in operational expenditures.
  • The adoption of a cloud-native architecture enables greater flexibility and scalability. This shift necessitates on-premises to cloud migration and legacy migration projects, which rely on robust tools for real-time data integration and data synchronization.
  • Automating key functions through business process automation and integrating complex systems like enterprise resource planning (ERP) are critical. These drivers underscore the market's role in helping organizations achieve operational coherence and make informed, data-driven decisions.

What are the market trends shaping the Application Development And Integration Industry?

  • The increasing worldwide penetration of integration Platform as a Service (iPaaS) is an emerging market trend, driven by the need for scalable and flexible solutions to handle complex integration scenarios.

  • A key trend is the worldwide penetration of platform-as-a-service (PaaS) and iPaaS, which are essential for managing complex enterprise ecosystems. The rise of hybrid integration technology is critical for organizations that use both on-premises and cloud models, where API-led connectivity ensures seamless data flow, improving integration speed by up to 30%.
  • Serverless architectures and low-code platforms are democratizing development, allowing for faster creation of applications. We also see wider adoption of service mesh technologies to manage microservices communication. For the modern workforce, mobile application integration within a virtualized workspace is paramount, with some organizations reporting a 25% increase in productivity.
  • This trend is supported by workflow automation tools and cross-platform development frameworks that deliver consistent user experiences across devices.

What challenges does the Application Development And Integration Industry face during its growth?

  • Significant time and budget constraints for the deployment and long-term maintenance of application development and integration systems pose a considerable challenge to market growth.

  • A primary challenge involves the time and budget constraints associated with large-scale digital transformation initiatives. Interoperability issues in deploying enterprise application integration systems can lead to a 15% increase in long-term maintenance costs. Furthermore, data security concerns are paramount in an era of SaaS integration challenges, demanding a focus on secure application development and robust DevSecOps practices.
  • Implementing and maintaining CI/CD pipelines require significant investment and skilled personnel. The complexity of data transformation across disparate systems and the need for comprehensive automated testing add to the resource burden. As organizations adopt technologies like containerization to streamline deployments, managing the security of these environments and ensuring effective B2B integration solutions remains a persistent challenge for many.

Exclusive Technavio Analysis on Customer Landscape

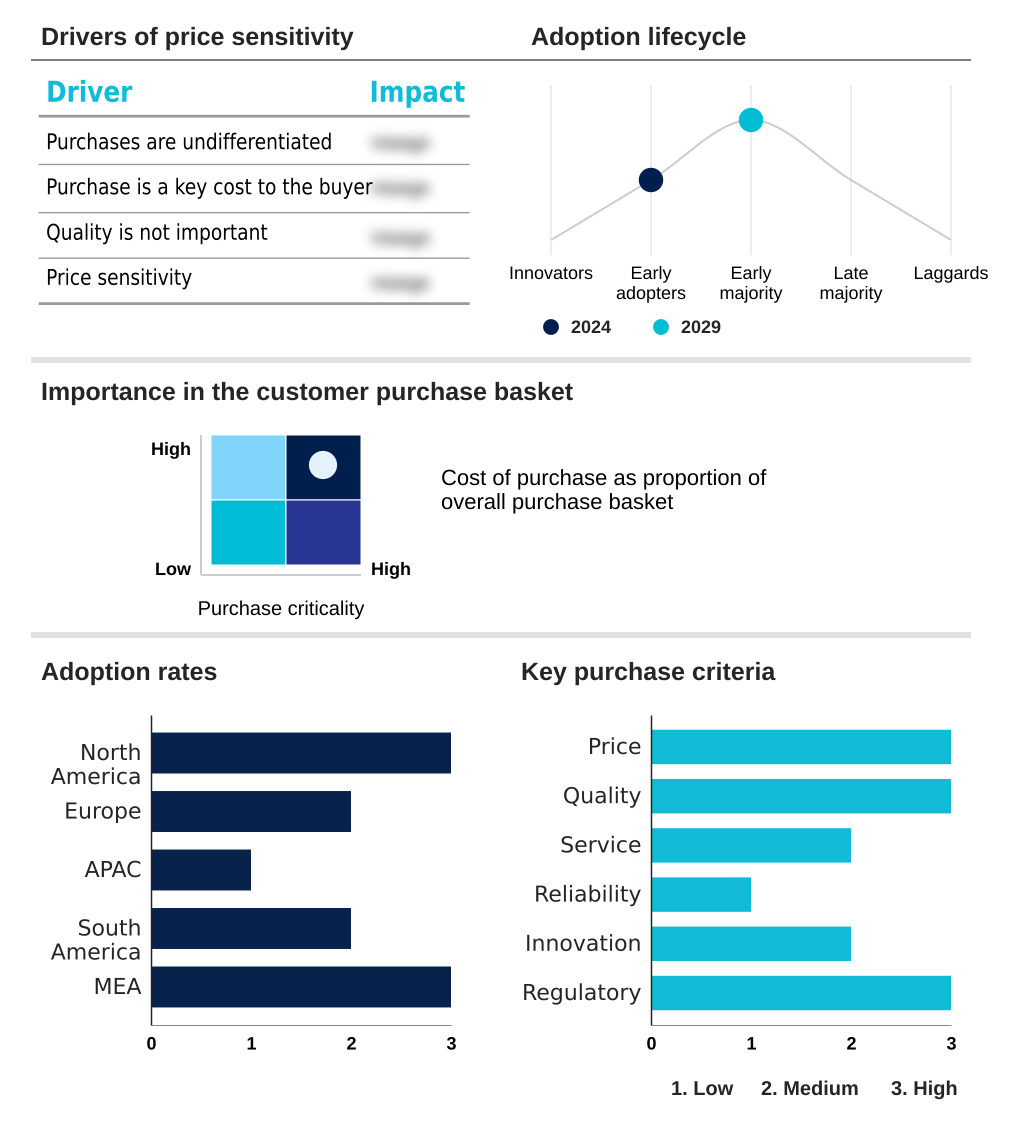
The application development and integration market forecasting report includes the adoption lifecycle of the market, covering from the innovator’s stage to the laggard’s stage. It focuses on adoption rates in different regions based on penetration. Furthermore, the application development and integration market report also includes key purchase criteria and drivers of price sensitivity to help companies evaluate and develop their market growth analysis strategies.

Customer Landscape of Application Development And Integration Industry

Competitive Landscape

Companies are implementing various strategies, such as strategic alliances, application development and integration market forecast, partnerships, mergers and acquisitions, geographical expansion, and product/service launches, to enhance their presence in the industry.

Accenture PLC - Solutions focus on agile transformation and modernizing application landscapes, enabling organizations to innovate with greater speed and realize enhanced business value.

The industry research and growth report includes detailed analyses of the competitive landscape of the market and information about key companies, including:

  • Accenture PLC
  • Atos SE
  • Capgemini Service SAS
  • Cognizant Technology Solution
  • Fujitsu Ltd.
  • HCL Technologies Ltd.
  • Hewlett Packard
  • Infosys Ltd.
  • IBM Corp.
  • Larsen and Toubro Ltd.
  • Mahindra and Mahindra Ltd.
  • Microsoft Corp.
  • Mindteck India Ltd.
  • NTT DATA Corp.
  • Oracle Corp.
  • RSM International Ltd.
  • SAP SE
  • Tata Consultancy Services
  • Unisys Corp.
  • Wipro Ltd.

Qualitative and quantitative analysis of companies has been conducted to help clients understand the wider business environment as well as the strengths and weaknesses of key industry players. Data is qualitatively analyzed to categorize companies as pure play, category-focused, industry-focused, and diversified; it is quantitatively analyzed to categorize companies as dominant, leading, strong, tentative, and weak.

Recent Development and News in Application development and integration market

  • In November, 2024, Red Hat Inc. announced new capabilities for its Developer Hub, integrating AI to help organizations accelerate the delivery of smarter applications and services.
  • In August, 2024, the Tauri framework released its 2.0 beta, a Rust-based tool promising significant performance gains and introducing alpha support for mobile platforms, challenging existing cross-platform solutions.
  • In January, 2025, Tata Consultancy Services launched an enhanced service offering focused on migrating complex on-premise application integration platforms to Azure iPaaS for large enterprises.
  • In March, 2025, Oracle Corp. expanded its AI-powered low-code toolset, adding new features to its autonomous databases and cloud-native platforms designed to improve developer productivity.

Dive into Technavio’s robust research methodology, blending expert interviews, extensive data synthesis, and validated models for unparalleled Application Development And Integration Market insights. See full methodology.

Market Scope
Page number 302
Base year 2024
Historic period 2019-2023
Forecast period 2025-2029
Growth momentum & CAGR Accelerate at a CAGR of 6.4%
Market growth 2025-2029 USD 76.4 billion
Market structure Fragmented
YoY growth 2024-2025(%) 6.0%
Key countries US, Canada, Mexico, Germany, UK, France, Russia, Italy, Spain, China, Japan, India, South Korea, Australia, Indonesia, Brazil, Argentina, Chile, South Africa, UAE, Saudi Arabia, Israel and Egypt
Competitive landscape Leading Companies, Market Positioning of Companies, Competitive Strategies, and Industry Risks

Request Free Sample

Research Analyst Overview

  • The application development and integration market is defined by the enterprise-wide push for agile transformation and application modernization. Boardroom decisions increasingly center on the strategic value of a cohesive cloud-native architecture, which is essential for supporting business process automation and deriving insights from predictive analytics.
  • The adoption of microservices is not just a technical shift but a core business strategy to enhance agility. This requires robust API management and system integration capabilities, often managed with service mesh technologies. Key processes like legacy migration are complex undertakings that benefit from DevSecOps principles and extensive automated testing within CI/CD pipelines to ensure quality.
  • Organizations leveraging this approach report a 40% reduction in critical post-deployment issues. The ecosystem relies on containerization, efficient data transformation, and continuous DevOps support to connect core systems like enterprise resource planning and customer relationship management while enabling advanced functionalities in a virtualized workspace through seamless data synchronization. The use of low-code platforms and iPaaS further accelerates these initiatives.

What are the Key Data Covered in this Application Development And Integration Market Research and Growth Report?

  • What is the expected growth of the Application Development And Integration Market between 2025 and 2029?

    • USD 76.4 billion, at a CAGR of 6.4%

  • What segmentation does the market report cover?

    • The report is segmented by Product (Application development, and Application integration), Deployment (On-premises, and Cloud), Type (Web applications, Mobile applications, and Desktop applications) and Geography (North America, Europe, APAC, South America, Middle East and Africa)

  • Which regions are analyzed in the report?

    • North America, Europe, APAC, South America and Middle East and Africa

  • What are the key growth drivers and market challenges?

    • Advantage of cost reduction due to operational streamlining, Time and budget constraints

  • Who are the major players in the Application Development And Integration Market?

    • Accenture PLC, Atos SE, Capgemini Service SAS, Cognizant Technology Solution, Fujitsu Ltd., HCL Technologies Ltd., Hewlett Packard, Infosys Ltd., IBM Corp., Larsen and Toubro Ltd., Mahindra and Mahindra Ltd., Microsoft Corp., Mindteck India Ltd., NTT DATA Corp., Oracle Corp., RSM International Ltd., SAP SE, Tata Consultancy Services, Unisys Corp. and Wipro Ltd.

Market Research Insights

  • The market is shaped by significant digital transformation initiatives that compel organizations to pursue IT infrastructure modernization and custom application development. Effective application portfolio management is critical, with firms leveraging API-led connectivity and workflow automation tools to streamline business process integration.
  • The move toward cloud application development addresses SaaS integration challenges and facilitates on-premises to cloud migration, with successful projects reducing infrastructure costs by up to 30%. Real-time data integration is supported by platform-as-a-service (PaaS) and integration platform as a service, while cross-platform development via a modern software development kit ensures broad reach.
  • Agile and devops methodologies, combined with a focus on secure application development, underpin the entire application lifecycle management process. This environment also drives demand for mobile application integration, scalable backend services, and sophisticated B2B integration solutions managed through a robust application programming interface.

We can help! Our analysts can customize this application development and integration market research report to meet your requirements.

Get in touch

1. Executive Summary

1.1 Market overview

Executive Summary - Chart on Market Overview
Executive Summary - Data Table on Market Overview
Executive Summary - Chart on Global Market Characteristics
Executive Summary - Chart on Market by Geography
Executive Summary - Chart on Market Segmentation by Product
Executive Summary - Chart on Market Segmentation by Deployment
Executive Summary - Chart on Market Segmentation by Type
Executive Summary - Chart on Incremental Growth
Executive Summary - Data Table on Incremental Growth
Executive Summary - Chart on Company Market Positioning

2. Technavio Analysis

2.1 Analysis of price sensitivity, lifecycle, customer purchase basket, adoption rates, and purchase criteria

2.2 Criticality of inputs and Factors of differentiation

Chart on Overview on criticality of inputs and factors of differentiation

2.3 Factors of disruption

Chart on Overview on factors of disruption

2.4 Impact of drivers and challenges

Chart on Impact of drivers and challenges in 2024 and 2029

3. Market Landscape

3.1 Market ecosystem

Chart on Parent Market
Data Table on - Parent Market

3.2 Market characteristics

Chart on Market characteristics analysis

3.3 Value chain analysis

Chart on Value chain analysis

4. Market Sizing

4.1 Market definition

Data Table on Offerings of companies included in the market definition

4.2 Market segment analysis

Market segments

4.3 Market size 2024

4.4 Market outlook: Forecast for 2024-2029

Chart on Global - Market size and forecast 2024-2029 ($ billion)
Data Table on Global - Market size and forecast 2024-2029 ($ billion)
Chart on Global Market: Year-over-year growth 2024-2029 (%)
Data Table on Global Market: Year-over-year growth 2024-2029 (%)

5. Historic Market Size

5.1 Global Application Development And Integration Market 2019 - 2023

Historic Market Size - Data Table on Global Application Development And Integration Market 2019 - 2023 ($ billion)

5.2 Product segment analysis 2019 - 2023

Historic Market Size - Product Segment 2019 - 2023 ($ billion)

5.3 Deployment segment analysis 2019 - 2023

Historic Market Size - Deployment Segment 2019 - 2023 ($ billion)

5.4 Type segment analysis 2019 - 2023

Historic Market Size - Type Segment 2019 - 2023 ($ billion)

5.5 Geography segment analysis 2019 - 2023

Historic Market Size - Geography Segment 2019 - 2023 ($ billion)

5.6 Country segment analysis 2019 - 2023

Historic Market Size - Country Segment 2019 - 2023 ($ billion)

6. Qualitative Analysis

6.1 The AI impact on Global Application Development and Integration Market

7. Five Forces Analysis

7.1 Five forces summary

Five forces analysis - Comparison between 2024 and 2029

7.2 Bargaining power of buyers

Bargaining power of buyers - Impact of key factors 2024 and 2029

7.3 Bargaining power of suppliers

Bargaining power of suppliers - Impact of key factors in 2024 and 2029

7.4 Threat of new entrants

Threat of new entrants - Impact of key factors in 2024 and 2029

7.5 Threat of substitutes

Threat of substitutes - Impact of key factors in 2024 and 2029

7.6 Threat of rivalry

Threat of rivalry - Impact of key factors in 2024 and 2029

7.7 Market condition

Chart on Market condition - Five forces 2024 and 2029

8. Market Segmentation by Product

8.1 Market segments

Chart on Product - Market share 2024-2029 (%)
Data Table on Product - Market share 2024-2029 (%)

8.2 Comparison by Product

Chart on Comparison by Product
Data Table on Comparison by Product

8.3 Application development - Market size and forecast 2024-2029

Chart on Application development - Market size and forecast 2024-2029 ($ billion)
Data Table on Application development - Market size and forecast 2024-2029 ($ billion)
Chart on Application development - Year-over-year growth 2024-2029 (%)
Data Table on Application development - Year-over-year growth 2024-2029 (%)

8.4 Application integration - Market size and forecast 2024-2029

Chart on Application integration - Market size and forecast 2024-2029 ($ billion)
Data Table on Application integration - Market size and forecast 2024-2029 ($ billion)
Chart on Application integration - Year-over-year growth 2024-2029 (%)
Data Table on Application integration - Year-over-year growth 2024-2029 (%)

8.5 Market opportunity by Product

Market opportunity by Product ($ billion)
Data Table on Market opportunity by Product ($ billion)

9. Market Segmentation by Deployment

9.1 Market segments

Chart on Deployment - Market share 2024-2029 (%)
Data Table on Deployment - Market share 2024-2029 (%)

9.2 Comparison by Deployment

Chart on Comparison by Deployment
Data Table on Comparison by Deployment

9.3 On-premises - Market size and forecast 2024-2029

Chart on On-premises - Market size and forecast 2024-2029 ($ billion)
Data Table on On-premises - Market size and forecast 2024-2029 ($ billion)
Chart on On-premises - Year-over-year growth 2024-2029 (%)
Data Table on On-premises - Year-over-year growth 2024-2029 (%)

9.4 Cloud - Market size and forecast 2024-2029

Chart on Cloud - Market size and forecast 2024-2029 ($ billion)
Data Table on Cloud - Market size and forecast 2024-2029 ($ billion)
Chart on Cloud - Year-over-year growth 2024-2029 (%)
Data Table on Cloud - Year-over-year growth 2024-2029 (%)

9.5 Market opportunity by Deployment

Market opportunity by Deployment ($ billion)
Data Table on Market opportunity by Deployment ($ billion)

10. Market Segmentation by Type

10.1 Market segments

Chart on Type - Market share 2024-2029 (%)
Data Table on Type - Market share 2024-2029 (%)

10.2 Comparison by Type

Chart on Comparison by Type
Data Table on Comparison by Type

10.3 Web applications - Market size and forecast 2024-2029

Chart on Web applications - Market size and forecast 2024-2029 ($ billion)
Data Table on Web applications - Market size and forecast 2024-2029 ($ billion)
Chart on Web applications - Year-over-year growth 2024-2029 (%)
Data Table on Web applications - Year-over-year growth 2024-2029 (%)

10.4 Mobile applications - Market size and forecast 2024-2029

Chart on Mobile applications - Market size and forecast 2024-2029 ($ billion)
Data Table on Mobile applications - Market size and forecast 2024-2029 ($ billion)
Chart on Mobile applications - Year-over-year growth 2024-2029 (%)
Data Table on Mobile applications - Year-over-year growth 2024-2029 (%)

10.5 Desktop applications - Market size and forecast 2024-2029

Chart on Desktop applications - Market size and forecast 2024-2029 ($ billion)
Data Table on Desktop applications - Market size and forecast 2024-2029 ($ billion)
Chart on Desktop applications - Year-over-year growth 2024-2029 (%)
Data Table on Desktop applications - Year-over-year growth 2024-2029 (%)

10.6 Market opportunity by Type

Market opportunity by Type ($ billion)
Data Table on Market opportunity by Type ($ billion)

11. Customer Landscape

11.1 Customer landscape overview

Analysis of price sensitivity, lifecycle, customer purchase basket, adoption rates, and purchase criteria

12. Geographic Landscape

12.1 Geographic segmentation

Chart on Market share by geography 2024-2029 (%)
Data Table on Market share by geography 2024-2029 (%)

12.2 Geographic comparison

Chart on Geographic comparison
Data Table on Geographic comparison

12.3 North America - Market size and forecast 2024-2029

Chart on North America - Market size and forecast 2024-2029 ($ billion)
Data Table on North America - Market size and forecast 2024-2029 ($ billion)
Chart on North America - Year-over-year growth 2024-2029 (%)
Data Table on North America - Year-over-year growth 2024-2029 (%)
Chart on Regional Comparison - North America
Data Table on Regional Comparison - North America

12.3.1 US - Market size and forecast 2024-2029

Chart on US - Market size and forecast 2024-2029 ($ billion)
Data Table on US - Market size and forecast 2024-2029 ($ billion)
Chart on US - Year-over-year growth 2024-2029 (%)
Data Table on US - Year-over-year growth 2024-2029 (%)

12.3.2 Canada - Market size and forecast 2024-2029

Chart on Canada - Market size and forecast 2024-2029 ($ billion)
Data Table on Canada - Market size and forecast 2024-2029 ($ billion)
Chart on Canada - Year-over-year growth 2024-2029 (%)
Data Table on Canada - Year-over-year growth 2024-2029 (%)

12.3.3 Mexico - Market size and forecast 2024-2029

Chart on Mexico - Market size and forecast 2024-2029 ($ billion)
Data Table on Mexico - Market size and forecast 2024-2029 ($ billion)
Chart on Mexico - Year-over-year growth 2024-2029 (%)
Data Table on Mexico - Year-over-year growth 2024-2029 (%)

12.4 Europe - Market size and forecast 2024-2029

Chart on Europe - Market size and forecast 2024-2029 ($ billion)
Data Table on Europe - Market size and forecast 2024-2029 ($ billion)
Chart on Europe - Year-over-year growth 2024-2029 (%)
Data Table on Europe - Year-over-year growth 2024-2029 (%)
Chart on Regional Comparison - Europe
Data Table on Regional Comparison - Europe

12.4.1 Germany - Market size and forecast 2024-2029

Chart on Germany - Market size and forecast 2024-2029 ($ billion)
Data Table on Germany - Market size and forecast 2024-2029 ($ billion)
Chart on Germany - Year-over-year growth 2024-2029 (%)
Data Table on Germany - Year-over-year growth 2024-2029 (%)

12.4.2 UK - Market size and forecast 2024-2029

Chart on UK - Market size and forecast 2024-2029 ($ billion)
Data Table on UK - Market size and forecast 2024-2029 ($ billion)
Chart on UK - Year-over-year growth 2024-2029 (%)
Data Table on UK - Year-over-year growth 2024-2029 (%)

12.4.3 France - Market size and forecast 2024-2029

Chart on France - Market size and forecast 2024-2029 ($ billion)
Data Table on France - Market size and forecast 2024-2029 ($ billion)
Chart on France - Year-over-year growth 2024-2029 (%)
Data Table on France - Year-over-year growth 2024-2029 (%)

12.4.4 Russia - Market size and forecast 2024-2029

Chart on Russia - Market size and forecast 2024-2029 ($ billion)
Data Table on Russia - Market size and forecast 2024-2029 ($ billion)
Chart on Russia - Year-over-year growth 2024-2029 (%)
Data Table on Russia - Year-over-year growth 2024-2029 (%)

12.4.5 Italy - Market size and forecast 2024-2029

Chart on Italy - Market size and forecast 2024-2029 ($ billion)
Data Table on Italy - Market size and forecast 2024-2029 ($ billion)
Chart on Italy - Year-over-year growth 2024-2029 (%)
Data Table on Italy - Year-over-year growth 2024-2029 (%)

12.4.6 Spain - Market size and forecast 2024-2029

Chart on Spain - Market size and forecast 2024-2029 ($ billion)
Data Table on Spain - Market size and forecast 2024-2029 ($ billion)
Chart on Spain - Year-over-year growth 2024-2029 (%)
Data Table on Spain - Year-over-year growth 2024-2029 (%)

12.5 APAC - Market size and forecast 2024-2029

Chart on APAC - Market size and forecast 2024-2029 ($ billion)
Data Table on APAC - Market size and forecast 2024-2029 ($ billion)
Chart on APAC - Year-over-year growth 2024-2029 (%)
Data Table on APAC - Year-over-year growth 2024-2029 (%)
Chart on Regional Comparison - APAC
Data Table on Regional Comparison - APAC

12.5.1 China - Market size and forecast 2024-2029

Chart on China - Market size and forecast 2024-2029 ($ billion)
Data Table on China - Market size and forecast 2024-2029 ($ billion)
Chart on China - Year-over-year growth 2024-2029 (%)
Data Table on China - Year-over-year growth 2024-2029 (%)

12.5.2 Japan - Market size and forecast 2024-2029

Chart on Japan - Market size and forecast 2024-2029 ($ billion)
Data Table on Japan - Market size and forecast 2024-2029 ($ billion)
Chart on Japan - Year-over-year growth 2024-2029 (%)
Data Table on Japan - Year-over-year growth 2024-2029 (%)

12.5.3 India - Market size and forecast 2024-2029

Chart on India - Market size and forecast 2024-2029 ($ billion)
Data Table on India - Market size and forecast 2024-2029 ($ billion)
Chart on India - Year-over-year growth 2024-2029 (%)
Data Table on India - Year-over-year growth 2024-2029 (%)

12.5.4 South Korea - Market size and forecast 2024-2029

Chart on South Korea - Market size and forecast 2024-2029 ($ billion)
Data Table on South Korea - Market size and forecast 2024-2029 ($ billion)
Chart on South Korea - Year-over-year growth 2024-2029 (%)
Data Table on South Korea - Year-over-year growth 2024-2029 (%)

12.5.5 Australia - Market size and forecast 2024-2029

Chart on Australia - Market size and forecast 2024-2029 ($ billion)
Data Table on Australia - Market size and forecast 2024-2029 ($ billion)
Chart on Australia - Year-over-year growth 2024-2029 (%)
Data Table on Australia - Year-over-year growth 2024-2029 (%)

12.5.6 Indonesia - Market size and forecast 2024-2029

Chart on Indonesia - Market size and forecast 2024-2029 ($ billion)
Data Table on Indonesia - Market size and forecast 2024-2029 ($ billion)
Chart on Indonesia - Year-over-year growth 2024-2029 (%)
Data Table on Indonesia - Year-over-year growth 2024-2029 (%)

12.6 South America - Market size and forecast 2024-2029

Chart on South America - Market size and forecast 2024-2029 ($ billion)
Data Table on South America - Market size and forecast 2024-2029 ($ billion)
Chart on South America - Year-over-year growth 2024-2029 (%)
Data Table on South America - Year-over-year growth 2024-2029 (%)
Chart on Regional Comparison - South America
Data Table on Regional Comparison - South America

12.6.1 Brazil - Market size and forecast 2024-2029

Chart on Brazil - Market size and forecast 2024-2029 ($ billion)
Data Table on Brazil - Market size and forecast 2024-2029 ($ billion)
Chart on Brazil - Year-over-year growth 2024-2029 (%)
Data Table on Brazil - Year-over-year growth 2024-2029 (%)

12.6.2 Argentina - Market size and forecast 2024-2029

Chart on Argentina - Market size and forecast 2024-2029 ($ billion)
Data Table on Argentina - Market size and forecast 2024-2029 ($ billion)
Chart on Argentina - Year-over-year growth 2024-2029 (%)
Data Table on Argentina - Year-over-year growth 2024-2029 (%)

12.6.3 Chile - Market size and forecast 2024-2029

Chart on Chile - Market size and forecast 2024-2029 ($ billion)
Data Table on Chile - Market size and forecast 2024-2029 ($ billion)
Chart on Chile - Year-over-year growth 2024-2029 (%)
Data Table on Chile - Year-over-year growth 2024-2029 (%)

12.7 Middle East and Africa - Market size and forecast 2024-2029

Chart on Middle East and Africa - Market size and forecast 2024-2029 ($ billion)
Data Table on Middle East and Africa - Market size and forecast 2024-2029 ($ billion)
Chart on Middle East and Africa - Year-over-year growth 2024-2029 (%)
Data Table on Middle East and Africa - Year-over-year growth 2024-2029 (%)
Chart on Regional Comparison - Middle East and Africa
Data Table on Regional Comparison - Middle East and Africa

12.7.1 South Africa - Market size and forecast 2024-2029

Chart on South Africa - Market size and forecast 2024-2029 ($ billion)
Data Table on South Africa - Market size and forecast 2024-2029 ($ billion)
Chart on South Africa - Year-over-year growth 2024-2029 (%)
Data Table on South Africa - Year-over-year growth 2024-2029 (%)

12.7.2 UAE - Market size and forecast 2024-2029

Chart on UAE - Market size and forecast 2024-2029 ($ billion)
Data Table on UAE - Market size and forecast 2024-2029 ($ billion)
Chart on UAE - Year-over-year growth 2024-2029 (%)
Data Table on UAE - Year-over-year growth 2024-2029 (%)

12.7.3 Saudi Arabia - Market size and forecast 2024-2029

Chart on Saudi Arabia - Market size and forecast 2024-2029 ($ billion)
Data Table on Saudi Arabia - Market size and forecast 2024-2029 ($ billion)
Chart on Saudi Arabia - Year-over-year growth 2024-2029 (%)
Data Table on Saudi Arabia - Year-over-year growth 2024-2029 (%)

12.7.4 Israel - Market size and forecast 2024-2029

Chart on Israel - Market size and forecast 2024-2029 ($ billion)
Data Table on Israel - Market size and forecast 2024-2029 ($ billion)
Chart on Israel - Year-over-year growth 2024-2029 (%)
Data Table on Israel - Year-over-year growth 2024-2029 (%)

12.7.5 Egypt - Market size and forecast 2024-2029

Chart on Egypt - Market size and forecast 2024-2029 ($ billion)
Data Table on Egypt - Market size and forecast 2024-2029 ($ billion)
Chart on Egypt - Year-over-year growth 2024-2029 (%)
Data Table on Egypt - Year-over-year growth 2024-2029 (%)

12.8 Market opportunity by geography

Market opportunity by geography ($ billion)
Data Tables on Market opportunity by geography ($ billion)

13. Drivers, Challenges, and Opportunity

13.1 Market drivers

Advantage of cost reduction due to operational streamlining
Growing emphasis on business process integration
Growing penetration of cloud computing

13.2 Market challenges

Time and budget constraints
Interoperability issues in deployment of systems
Data security concerns in contemporary world

13.3 Impact of drivers and challenges

Impact of drivers and challenges in 2024 and 2029

13.4 Market opportunities

Worldwide penetration of iPaaS
Rise of hybrid application integration technology
Application integration for mobile device platform

14. Competitive Landscape

14.1 Overview

14.2

Overview on criticality of inputs and factors of differentiation

14.3 Landscape disruption

Overview on factors of disruption

14.4 Industry risks

Impact of key risks on business

15. Competitive Analysis

15.1 Companies profiled

Companies covered

15.2 Company ranking index

15.3 Market positioning of companies

Matrix on companies position and classification

15.4 Accenture PLC

Accenture PLC - Overview
Accenture PLC - Business segments
Accenture PLC - Key news
Accenture PLC - Key offerings
Accenture PLC - Segment focus
SWOT

15.5 Atos SE

Atos SE - Overview
Atos SE - Business segments
Atos SE - Key news
Atos SE - Key offerings
Atos SE - Segment focus
SWOT

15.6 Capgemini Service SAS

Capgemini Service SAS - Overview
Capgemini Service SAS - Business segments
Capgemini Service SAS - Key news
Capgemini Service SAS - Key offerings
Capgemini Service SAS - Segment focus
SWOT

15.7 Cognizant Technology Solution

Cognizant Technology Solution - Overview
Cognizant Technology Solution - Business segments
Cognizant Technology Solution - Key news
Cognizant Technology Solution - Key offerings
Cognizant Technology Solution - Segment focus
SWOT

15.8 Fujitsu Ltd.

Fujitsu Ltd. - Overview
Fujitsu Ltd. - Business segments
Fujitsu Ltd. - Key news
Fujitsu Ltd. - Key offerings
Fujitsu Ltd. - Segment focus
SWOT

15.9 HCL Technologies Ltd.

HCL Technologies Ltd. - Overview
HCL Technologies Ltd. - Business segments
HCL Technologies Ltd. - Key news
HCL Technologies Ltd. - Key offerings
HCL Technologies Ltd. - Segment focus
SWOT

15.10 Hewlett Packard

Hewlett Packard - Overview
Hewlett Packard - Business segments
Hewlett Packard - Key news
Hewlett Packard - Key offerings
Hewlett Packard - Segment focus
SWOT

15.11 Infosys Ltd.

Infosys Ltd. - Overview
Infosys Ltd. - Business segments
Infosys Ltd. - Key news
Infosys Ltd. - Key offerings
Infosys Ltd. - Segment focus
SWOT

15.12 IBM Corp.

IBM Corp. - Overview
IBM Corp. - Business segments
IBM Corp. - Key news
IBM Corp. - Key offerings
IBM Corp. - Segment focus
SWOT

15.13 Microsoft Corp.

Microsoft Corp. - Overview
Microsoft Corp. - Business segments
Microsoft Corp. - Key news
Microsoft Corp. - Key offerings
Microsoft Corp. - Segment focus
SWOT

15.14 NTT DATA Corp.

NTT DATA Corp. - Overview
NTT DATA Corp. - Product / Service
NTT DATA Corp. - Key news
NTT DATA Corp. - Key offerings
SWOT

15.15 Oracle Corp.

Oracle Corp. - Overview
Oracle Corp. - Business segments
Oracle Corp. - Key news
Oracle Corp. - Key offerings
Oracle Corp. - Segment focus
SWOT

15.16 SAP SE

SAP SE - Overview
SAP SE - Business segments
SAP SE - Key news
SAP SE - Key offerings
SAP SE - Segment focus
SWOT

15.17 Tata Consultancy Services

Tata Consultancy Services - Overview
Tata Consultancy Services - Business segments
Tata Consultancy Services - Key news
Tata Consultancy Services - Key offerings
Tata Consultancy Services - Segment focus
SWOT

15.18 Wipro Ltd.

Wipro Ltd. - Overview
Wipro Ltd. - Business segments
Wipro Ltd. - Key news
Wipro Ltd. - Key offerings
Wipro Ltd. - Segment focus
SWOT

16. Appendix

16.1 Scope of the report

Market definition
Objectives
Notes and caveats

16.2 Inclusions and exclusions checklist

Inclusions checklist
Exclusions checklist

16.3 Currency conversion rates for US$

16.4 Research methodology

16.5 Data procurement

Information sources

16.6 Data validation

16.7 Validation techniques employed for market sizing

16.8 Data synthesis

16.9 360 degree market analysis

16.10 List of abbreviations

Research Methodology

Technavio presents a detailed picture of the market by way of study, synthesis, and summation of data from multiple sources. The analysts have presented the various facets of the market with a particular focus on identifying the key industry influencers. The data thus presented is comprehensive, reliable, and the result of extensive research, both primary and secondary.

INFORMATION SOURCES

Primary sources

  • Manufacturers and suppliers
  • Channel partners
  • Industry experts
  • Strategic decision makers

Secondary sources

  • Industry journals and periodicals
  • Government data
  • Financial reports of key industry players
  • Historical data
  • Press releases

DATA ANALYSIS

Data Synthesis

  • Collation of data
  • Estimation of key figures
  • Analysis of derived insights

Data Validation

  • Triangulation with data models
  • Reference against proprietary databases
  • Corroboration with industry experts

REPORT WRITING

Qualitative

  • Market drivers
  • Market challenges
  • Market trends
  • Five forces analysis

Quantitative

  • Market size and forecast
  • Market segmentation
  • Geographical insights
  • Competitive landscape

Interested in this report?

Get your sample now to see our research methodology and insights!

Download Now

Frequently Asked Questions

Application Development And Integration market growth will increase by USD 76.4 billion during 2025-2029 .

The Application Development And Integration market is expected to grow at a CAGR of 6.4% during 2025-2029 .

Application Development And Integration market is segmented by Product (Application development, Application integration) Deployment (On-premises, Cloud) Type (Web applications, Mobile applications, Desktop applications)

Accenture PLC, Atos SE, Capgemini Service SAS, Cognizant Technology Solution, Fujitsu Ltd., HCL Technologies Ltd., Hewlett Packard, Infosys Ltd., IBM Corp., Larsen and Toubro Ltd., Mahindra and Mahindra Ltd., Microsoft Corp., Mindteck India Ltd., NTT DATA Corp., Oracle Corp., RSM International Ltd., SAP SE, Tata Consultancy Services, Unisys Corp., Wipro Ltd. are a few of the key vendors in the Application Development And Integration market.

North America will register the highest growth rate of 43.6% among the other regions. Therefore, the Application Development And Integration market in North America is expected to garner significant business opportunities for the vendors during the forecast period.

US, Canada, Mexico, Germany, UK, France, Russia, Italy, Spain, China, Japan, India, South Korea, Australia, Indonesia, Brazil, Argentina, Chile, South Africa, UAE, Saudi Arabia, Israel, Egypt

  • Advantage of cost reduction due to operational streamlining is the driving factor this market.

The Application Development And Integration market vendors should focus on grabbing business opportunities from the Product segment as it accounted for the largest market share in the base year.