Aptamers Market Analysis, Size, and Forecast 2026-2030: North America (US, Canada, and Mexico), Europe (Germany, UK, and France), APAC (China, Japan, and India), South America (Brazil, Argentina, and Colombia), Middle East and Africa (Saudi Arabia, UAE, and South Africa), Asia, Rest of World (ROW)

Aptamers Market Analysis, Size, and Forecast 2026-2030:
North America (US, Canada, and Mexico), Europe (Germany, UK, and France), APAC (China, Japan, and India), South America (Brazil, Argentina, and Colombia), Middle East and Africa (Saudi Arabia, UAE, and South Africa), Asia, Rest of World (ROW)

Published: Apr 2026 292 Pages SKU: IRTNTR71707

Market Overview at a Glance

$8.34 B
Market Opportunity
55.2%
CAGR 2025 - 2030
53.6%
North America Growth
$306.07 Mn
Therapeutics development segment 2024

Aptamers Market Size 2026-2030

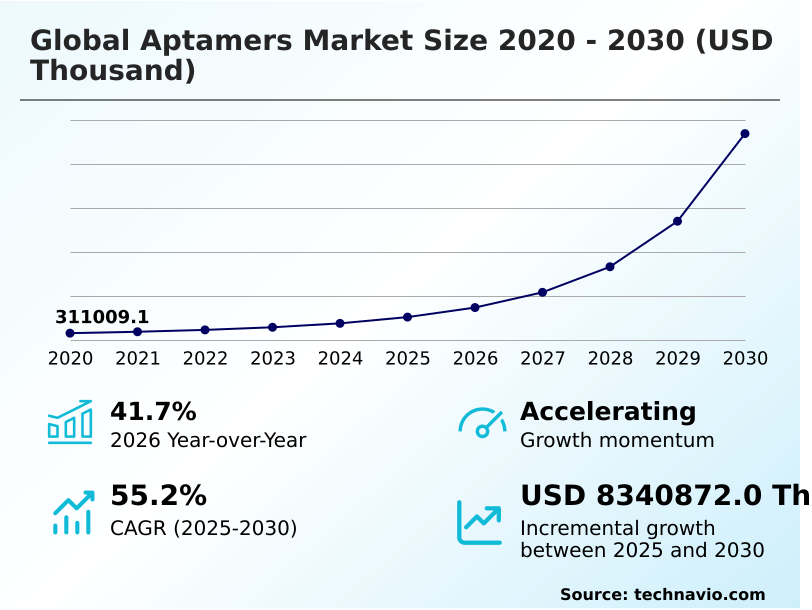
The aptamers market size is valued to increase by USD 8.34 billion, at a CAGR of 55.2% from 2025 to 2030. Strategic mainstreaming of AI-driven in-silico aptamer discovery will drive the aptamers market.

Major Market Trends & Insights

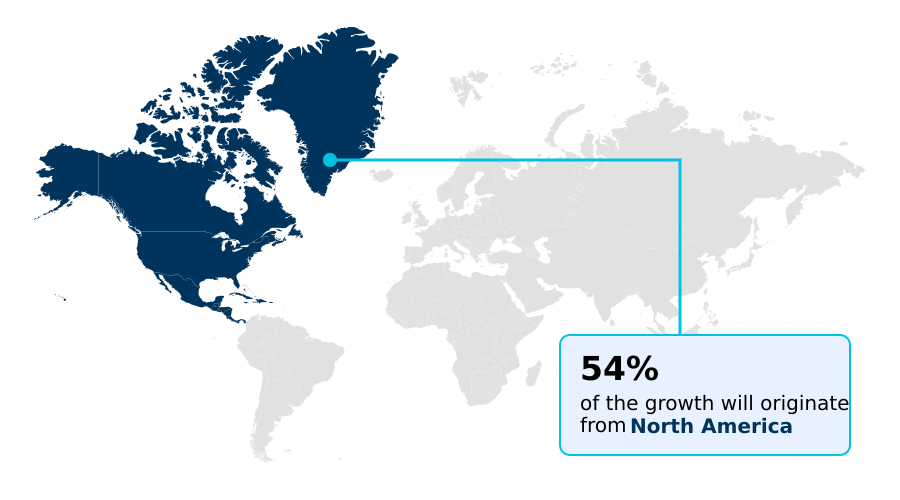
  • North America dominated the market and accounted for a 53.6% growth during the forecast period.
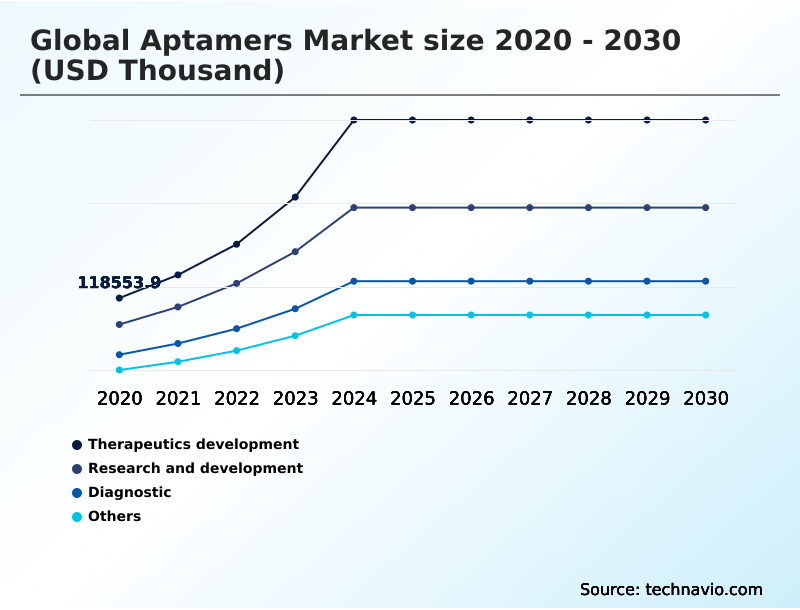
  • By Application - Therapeutics development segment was valued at USD 306.07 million in 2024
  • By Type - Nucleic acid aptamers segment accounted for the largest market revenue share in 2024

Market Size & Forecast

  • Market Opportunities:
  • Market Future Opportunities: USD 8.34 billion
  • CAGR from 2025 to 2030 : 55.2%

Market Summary

  • The aptamers market is undergoing a significant expansion, driven by the advantages of synthetic ligands over traditional antibodies. These molecules, identified through processes like systematic evolution of ligands by exponential enrichment, offer superior stability and cost-effective chemical synthesis, making them ideal for precision medicine.
  • Key drivers include the integration of AI-driven discovery platforms, which accelerate the identification of novel aptamer-drug conjugates and therapeutic binders. A central trend is the development of multivalent aptamer architectures for targeted radiopharmaceutical therapy and advanced point-of-care diagnostics.
  • For instance, a biotechnology firm can leverage in-silico selection to model millions of oligonucleotide sequences, reducing R&D timelines from months to weeks and bypassing the high costs of traditional screening.
  • However, the market faces challenges related to intellectual property thickets, manufacturing bottlenecks for analytical-grade oligonucleotide synthesis, and the need for pharmacokinetic optimization to address issues like rapid renal clearance, which requires advanced chemical modification techniques.

What will be the Size of the Aptamers Market during the forecast period?

Get Key Insights on Market Forecast (PDF) Request Free Sample

How is the Aptamers Market Segmented?

The aptamers industry research report provides comprehensive data (region-wise segment analysis), with forecasts and estimates in "USD thousand" for the period 2026-2030, as well as historical data from 2020-2024 for the following segments.

  • Application
    • Therapeutics development
    • Research and development
    • Diagnostic
    • Others
  • Type
    • Nucleic acid aptamers
    • Peptide aptamers
  • End-user
    • Pharmaceutical and biotechnology companies
    • Academic and government research institutes
    • Contract research organizations
    • Others
  • Geography
    • North America
      • US
      • Canada
      • Mexico
    • Europe
      • Germany
      • UK
      • France
    • Asia
    • Rest of World (ROW)

By Application Insights

The therapeutics development segment is estimated to witness significant growth during the forecast period.

The therapeutics development segment leverages both nucleic acid aptamers and peptide aptamers as crucial target validation tools. A primary focus is on serum half-life optimization through PEGylation strategies to improve in vivo stability for clinical use.

These nucleic acid ligands are instrumental in biomarker discovery and are central to creating advanced bioinformatics-integrated solutions. The development pipeline includes next-generation Xeno-Nucleic Acids (XNA) and non-proprietary modification techniques.

These platforms have demonstrated high value, with some programs delivering a greater than 25% increase in identified leads compared to traditional methods, and are also enabling new tools for cell sorting probes and single-molecule imaging.

Request Free Sample

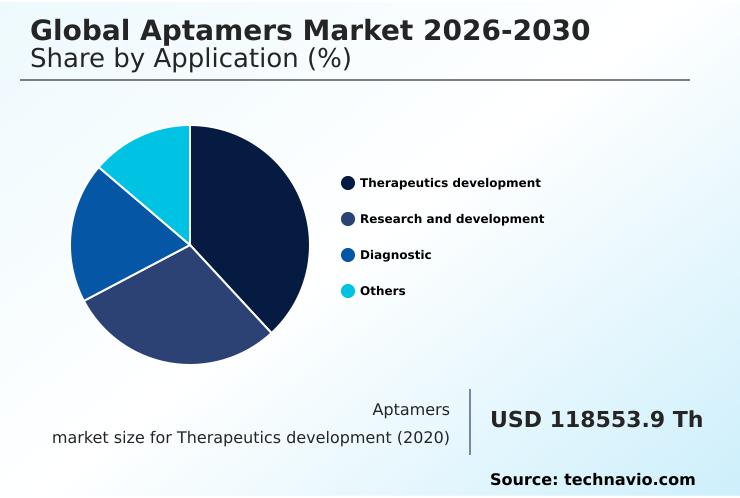
The Therapeutics development segment was valued at USD 306.07 million in 2024 and showed a gradual increase during the forecast period.

Request Free Sample

Regional Analysis

North America is estimated to contribute 53.6% to the growth of the global market during the forecast period.Technavio’s analysts have elaborately explained the regional trends and drivers that shape the market during the forecast period.

See How Aptamers Market Demand is Rising in North America Request Free Sample

North America commands over 50% of the market, driven by a robust ecosystem for high-throughput screening and the development of theranostic agents. Europe remains a key region for proteomics solutions and advanced affinity reagent development.

However, the most dynamic growth is in Asia, where the market is expanding at a rate nearly 1.5% faster than in Europe.

This is fueled by massive investments in biotechnology, including the development of aptamer-gated nanoparticles and synthetic binders for industrial fermentation control. Emerging applications are also seen in targeted skin treatments and environmental monitoring sensors.

The global landscape is shifting as regions outside North America build out their own cGMP manufacturing standards and aptamer selection services, diversifying the supply chain and fostering innovation in areas like organ-on-a-chip technology.

Market Dynamics

Our researchers analyzed the data with 2025 as the base year, along with the key drivers, trends, and challenges. A holistic analysis of drivers will help companies refine their marketing strategies to gain a competitive advantage.

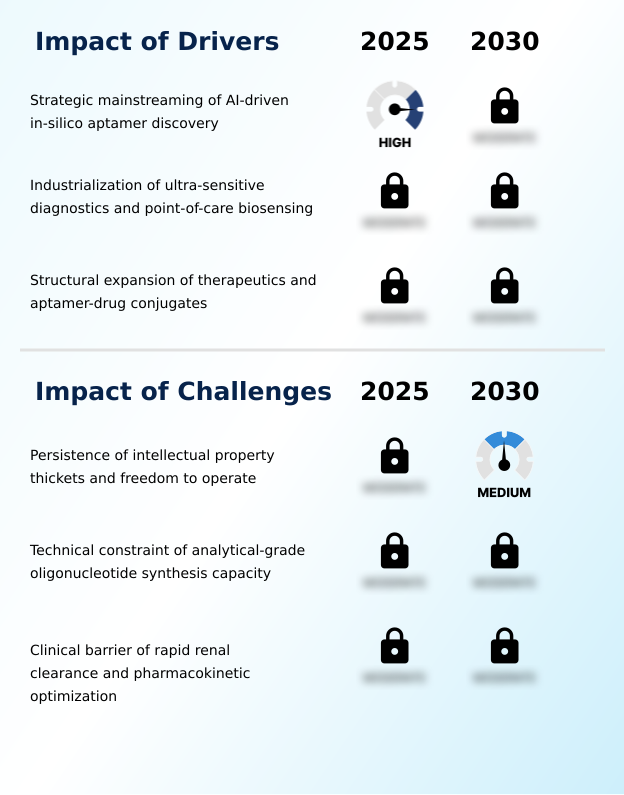
  • Strategic decision-making in the sector is increasingly influenced by the need to navigate a complex technological and regulatory landscape. Companies are investing heavily in AI-driven in-silico aptamer discovery processes to accelerate development timelines, a critical factor for gaining a competitive edge. This is particularly relevant for developing aptamer-drug conjugates for targeted oncology therapy, where speed to market is paramount.
  • A key focus is on improving aptamer stability against nuclease degradation and overcoming rapid renal clearance of small oligonucleotides through advanced chemical modifications. As part of this, firms are developing Xeno-Nucleic Acid (XNA) aptamers and exploring new techniques for optimizing aptamer serum half-life for therapeutics. The use of peptide aptamers for intracellular signaling inhibition is also opening new therapeutic avenues.
  • Concurrently, developing aptamer-based point-of-care diagnostic tools and aptamer-based biosensing for infectious disease detection remain high-priority areas, with multivalent aptamer architectures for increased avidity showing significant promise. These efforts are often complicated by challenges in analytical-grade oligonucleotide synthesis at scale and persistent intellectual property challenges in aptamer commercialization, requiring thorough freedom-to-operate analysis for modified oligonucleotides.
  • The integration of aptamers into lipid nanoparticle platforms and their use as molecular switches in bioprocessing represent growing areas of innovation. Such strategic pivots have enabled some firms to achieve a threefold increase in successful lead candidates advancing to preclinical trials.

What are the key market drivers leading to the rise in the adoption of Aptamers Industry?

  • The strategic mainstreaming of AI-driven in-silico aptamer discovery is a key driver for the market.

  • A primary market driver is the industrialization of high-throughput discovery platforms, enabling the rapid development of aptamers as superior molecular recognition elements.
  • The demand for ultra-sensitive diagnostics and point-of-care biosensing solutions is fueling the adoption of aptamer-based biosensing platforms, which achieve sub-picomolar limits of detection for critical biomarkers.
  • This capability has led to a greater than 25% increase in contracts for firms specializing in this area. Additionally, the strategic evolution toward targeted therapeutics powers the demand for high-precision aptamer-drug conjugates.
  • These therapeutic binders are used as delivery vehicles for gene-silencing agents and in radiopharmaceutical therapy, advancing personalized medicine through improved molecular target validation and supporting the creation of advanced synthetic biology solutions.

What are the market trends shaping the Aptamers Industry?

  • A significant market trend is the rising adoption of generative AI and machine learning to drive aptamer selection. This technological shift is accelerating discovery protocols and redefining development timelines.

  • Market trends are defined by the institutionalization of generative AI and machine learning, moving beyond the labor-intensive systematic evolution of ligands by exponential enrichment. This shift to in-silico selection and AI-augmented discovery accelerates the identification of high-affinity nucleic acid-based solutions, with some platforms achieving an 80% reduction in discovery timelines.
  • Concurrently, the proliferation of multivalent aptamer architectures is enabling their use in targeted radiopharmaceutical delivery. Another key trend is the move toward commercial licensing, where enzyme-modulating proprietary technology is embedded into diagnostic reagents and hot-start PCR reagents.
  • This framework is also expanding into agricultural diagnostics and food safety testing, driven by the demand for custom aptamer discovery to create sustainable, long-term revenue streams.

What challenges does the Aptamers Industry face during its growth?

  • The persistence of intellectual property thickets and issues with freedom to operate are key challenges affecting industry growth.

  • Significant challenges constrain market growth, including navigating complex intellectual property thickets which complicates freedom-to-operate analysis for modified oligonucleotides. A second major hurdle is the limited capacity for analytical-grade oligonucleotide production, where solid-phase synthesis yields can drop by over 40% for longer sequences, creating a bottleneck for cGMP manufacturing.
  • The inherent physiological limitations of aptamers, such as susceptibility to rapid renal clearance, also pose a challenge. Unmodified aptamers have a half-life reduction of over 95% compared to those undergoing chemical modification techniques.
  • This necessitates extensive pharmacokinetic profiling to optimize nuclease resistance and in vivo stability, adding complexity and cost to the development of aptamer development platforms for non-immunogenic ligand and anticoagulant aptamer drugs.

Exclusive Technavio Analysis on Customer Landscape

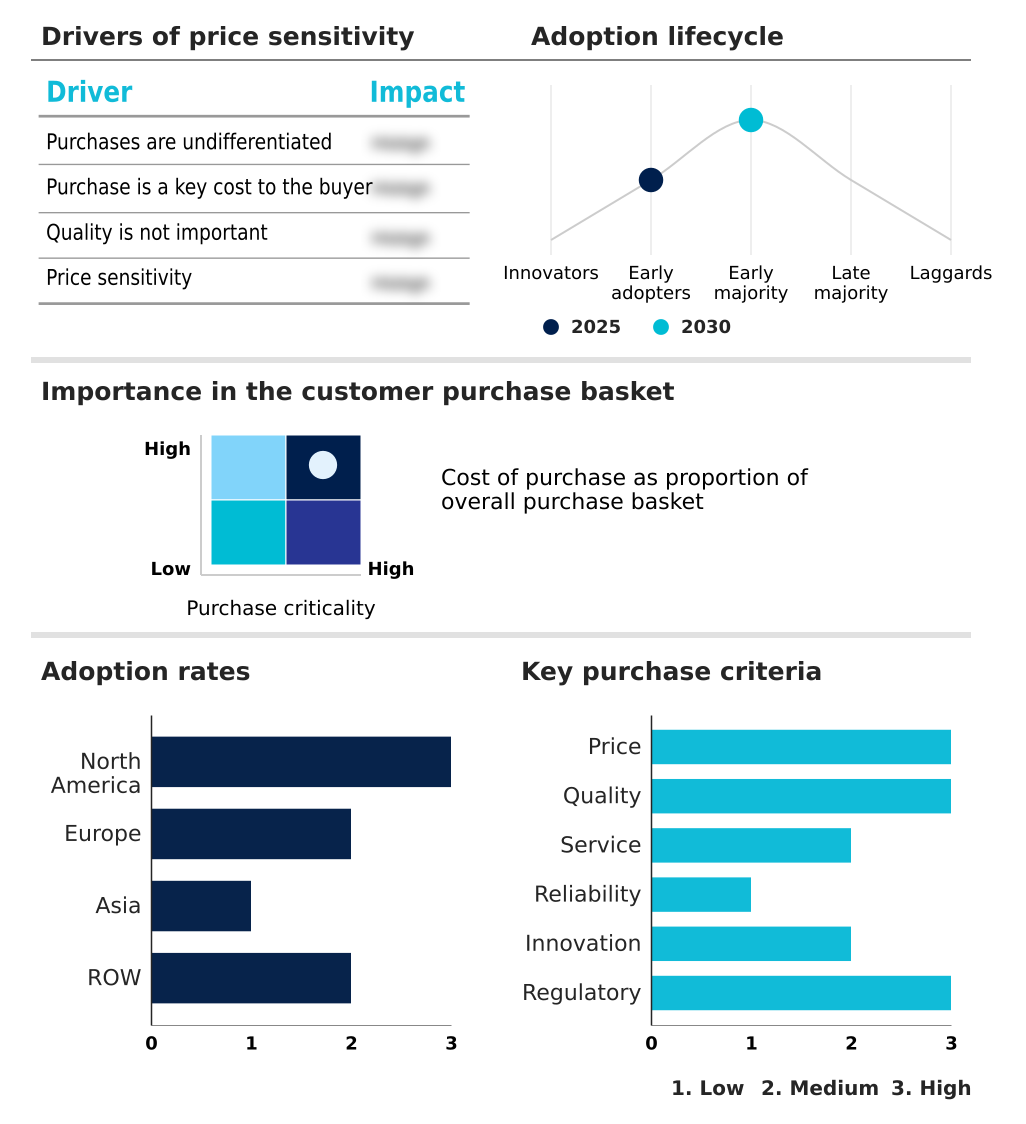
The aptamers market forecasting report includes the adoption lifecycle of the market, covering from the innovator’s stage to the laggard’s stage. It focuses on adoption rates in different regions based on penetration. Furthermore, the aptamers market report also includes key purchase criteria and drivers of price sensitivity to help companies evaluate and develop their market growth analysis strategies.

Customer Landscape of Aptamers Industry

Competitive Landscape

Companies are implementing various strategies, such as strategic alliances, aptamers market forecast, partnerships, mergers and acquisitions, geographical expansion, and product/service launches, to enhance their presence in the industry.

2bind GmbH - Specialized services include custom aptamer discovery, development, and production for diverse diagnostic, therapeutic, and research applications.

The industry research and growth report includes detailed analyses of the competitive landscape of the market and information about key companies, including:

  • 2bind GmbH
  • AMS Biotechnology Ltd.
  • Aptadel Therapeutics
  • Aptagen LLC
  • Aptus Biotech S.L.
  • Barrick Lab
  • Base Pair Biotechnologies Inc.
  • Basking Biosciences Inc.
  • Creative Biogene
  • NeoVentures Biotechnology Inc.
  • Novaptech SAS
  • Oligo Factory
  • SomaLogic Inc.
  • TriLink BioTechnologies
  • Veraptus
  • Vivonics Inc.

Qualitative and quantitative analysis of companies has been conducted to help clients understand the wider business environment as well as the strengths and weaknesses of key industry players. Data is qualitatively analyzed to categorize companies as pure play, category-focused, industry-focused, and diversified; it is quantitatively analyzed to categorize companies as dominant, leading, strong, tentative, and weak.

Recent Development and News in Aptamers market

  • In May 2025, Aptamer Group announced a royalty agreement with Neuro-Bio for the commercialization of Optimer-based clinical diagnostics targeting Alzheimer disease biomarkers.
  • In May 2025, IQVIA announced a strategic collaboration with the Sarah Cannon Research Institute to transform oncology clinical trials through improved operational efficiency and molecular insights.
  • In April 2025, Zentek announced securing a major contract from Innovative Solutions Canada to develop a multi-valent aptamer-based countermeasure for the H5N1 avian influenza virus.
  • In January 2025, Basepair Inc. and Sciencewerke established an agreement to deploy bioinformatics-integrated aptamer solutions across Southeast Asia.

Dive into Technavio’s robust research methodology, blending expert interviews, extensive data synthesis, and validated models for unparalleled Aptamers Market insights. See full methodology.

Market Scope
Page number 292
Base year 2025
Historic period 2020-2024
Forecast period 2026-2030
Growth momentum & CAGR Accelerate at a CAGR of 55.2%
Market growth 2026-2030 USD 8340872.0 thousand
Market structure Fragmented
YoY growth 2025-2026(%) 41.7%
Key countries US, Canada, Mexico, Germany, UK, France, Italy, Spain, The Netherlands, China, Japan, India, South Korea, Indonesia, Thailand, Brazil, Saudi Arabia, UAE, South Africa, Argentina, Colombia, Turkey and Israel
Competitive landscape Leading Companies, Market Positioning of Companies, Competitive Strategies, and Industry Risks

Request Free Sample

Research Analyst Overview

  • The aptamers market is defined by a transformative shift toward AI-driven discovery and high-throughput screening, fundamentally altering R&D economics. Boardroom-level decisions are now centered on allocating capital toward integrated platforms that combine custom aptamer discovery with advanced bioinformatics-integrated solutions. The adoption of these technologies, including synthetic biology solutions, enables the development of highly specific affinity reagents and nucleic acid-based solutions.
  • This transition is critical for creating next-generation point-of-care diagnostics, therapeutic binders, and theranostic agents. The use of both nucleic acid aptamers and peptide aptamers is expanding into novel areas like anticoagulant aptamer drugs and radiopharmaceutical therapy. Key technical advancements focus on nuclease resistance and serum half-life optimization through the use of modified oligonucleotides and advanced chemical modification techniques.
  • Platforms leveraging these approaches are now capable of processing over ten times the number of sequences compared to traditional methods, significantly accelerating biomarker discovery and the creation of new proteomics solutions and diagnostic reagents.

What are the Key Data Covered in this Aptamers Market Research and Growth Report?

  • What is the expected growth of the Aptamers Market between 2026 and 2030?

    • USD 8.34 billion, at a CAGR of 55.2%

  • What segmentation does the market report cover?

    • The report is segmented by Application (Therapeutics development, Research and development, Diagnostic, and Others), Type (Nucleic acid aptamers, and Peptide aptamers), End-user (Pharmaceutical and biotechnology companies, Academic and government research institutes, Contract research organizations, and Others) and Geography (North America, Europe, Asia, Rest of World (ROW))

  • Which regions are analyzed in the report?

    • North America, Europe, Asia and Rest of World (ROW)

  • What are the key growth drivers and market challenges?

    • Strategic mainstreaming of AI-driven in-silico aptamer discovery, Persistence of intellectual property thickets and freedom to operate

  • Who are the major players in the Aptamers Market?

    • 2bind GmbH, AMS Biotechnology Ltd., Aptadel Therapeutics, Aptagen LLC, Aptus Biotech S.L., Barrick Lab, Base Pair Biotechnologies Inc., Basking Biosciences Inc., Creative Biogene, NeoVentures Biotechnology Inc., Novaptech SAS, Oligo Factory, SomaLogic Inc., TriLink BioTechnologies, Veraptus and Vivonics Inc.

Market Research Insights

  • Market dynamics are increasingly shaped by the shift toward high-precision applications, leveraging AI-augmented discovery and advanced point-of-care biosensing. The adoption of aptamer-functionalized nanoparticles in ultra-sensitive diagnostics has enabled the achievement of sub-picomolar limits of detection, a greater than 10-fold improvement over some conventional assays.
  • This focus on performance is also evident in therapeutics, where platforms incorporating multiplexed detection and advanced gene-silencing agents are accelerating molecular target validation. Consequently, development timelines for identifying viable candidates have been reduced by over 50% in certain applications. These advancements reflect a strategic pivot toward platforms that can deliver superior in vivo stability and performance, driving market differentiation.

We can help! Our analysts can customize this aptamers market research report to meet your requirements.

Get in touch

1. Executive Summary

1.1 Market overview

Executive Summary - Chart on Market Overview
Executive Summary - Data Table on Market Overview
Executive Summary - Chart on Global Market Characteristics
Executive Summary - Chart on Market by Geography
Executive Summary - Chart on Market Segmentation by Application
Executive Summary - Chart on Market Segmentation by Type
Executive Summary - Chart on Market Segmentation by End-user
Executive Summary - Chart on Incremental Growth
Executive Summary - Data Table on Incremental Growth
Executive Summary - Chart on Company Market Positioning

2. Technavio Analysis

2.1 Analysis of price sensitivity, lifecycle, customer purchase basket, adoption rates, and purchase criteria

2.2 Criticality of inputs and Factors of differentiation

Chart on Overview on criticality of inputs and factors of differentiation

2.3 Factors of disruption

Chart on Overview on factors of disruption

2.4 Impact of drivers and challenges

Chart on Impact of drivers and challenges in 2025 and 2030

3. Market Landscape

3.1 Market ecosystem

Chart on Parent Market
Data Table on - Parent Market

3.2 Market characteristics

Chart on Market characteristics analysis

3.3 Value chain analysis

Chart on Value chain analysis

4. Market Sizing

4.1 Market definition

Data Table on Offerings of companies included in the market definition

4.2 Market segment analysis

Market segments

4.3 Market size 2025

4.4 Market outlook: Forecast for 2025-2030

Chart on Global - Market size and forecast 2025-2030 ($ thousand)
Data Table on Global - Market size and forecast 2025-2030 ($ thousand)
Chart on Global Market: Year-over-year growth 2025-2030 (%)
Data Table on Global Market: Year-over-year growth 2025-2030 (%)

5. Historic Market Size

5.1 Global Aptamers Market 2020 - 2024

Historic Market Size - Data Table on Global Aptamers Market 2020 - 2024 ($ thousand)

5.2 Application segment analysis 2020 - 2024

Historic Market Size - Application Segment 2020 - 2024 ($ thousand)

5.3 Type segment analysis 2020 - 2024

Historic Market Size - Type Segment 2020 - 2024 ($ thousand)

5.4 End-user segment analysis 2020 - 2024

Historic Market Size - End-user Segment 2020 - 2024 ($ thousand)

5.5 Geography segment analysis 2020 - 2024

Historic Market Size - Geography Segment 2020 - 2024 ($ thousand)

5.6 Country segment analysis 2020 - 2024

Historic Market Size - Country Segment 2020 - 2024 ($ thousand)

6. Qualitative Analysis

6.1 Impact of AI in global aptamers market

6.2 Impact of geopolitical conflict for global aptamers market

7. Five Forces Analysis

7.1 Five forces summary

Five forces analysis - Comparison between 2025 and 2030

7.2 Bargaining power of buyers

Bargaining power of buyers - Impact of key factors 2025 and 2030

7.3 Bargaining power of suppliers

Bargaining power of suppliers - Impact of key factors in 2025 and 2030

7.4 Threat of new entrants

Threat of new entrants - Impact of key factors in 2025 and 2030

7.5 Threat of substitutes

Threat of substitutes - Impact of key factors in 2025 and 2030

7.6 Threat of rivalry

Threat of rivalry - Impact of key factors in 2025 and 2030

7.7 Market condition

Chart on Market condition - Five forces 2025 and 2030

8. Market Segmentation by Application

8.1 Market segments

Chart on Application - Market share 2025-2030 (%)
Data Table on Application - Market share 2025-2030 (%)

8.2 Comparison by Application

Chart on Comparison by Application
Data Table on Comparison by Application

8.3 Therapeutics development - Market size and forecast 2025-2030

Chart on Therapeutics development - Market size and forecast 2025-2030 ($ thousand)
Data Table on Therapeutics development - Market size and forecast 2025-2030 ($ thousand)
Chart on Therapeutics development - Year-over-year growth 2025-2030 (%)
Data Table on Therapeutics development - Year-over-year growth 2025-2030 (%)

8.4 Research and development - Market size and forecast 2025-2030

Chart on Research and development - Market size and forecast 2025-2030 ($ thousand)
Data Table on Research and development - Market size and forecast 2025-2030 ($ thousand)
Chart on Research and development - Year-over-year growth 2025-2030 (%)
Data Table on Research and development - Year-over-year growth 2025-2030 (%)

8.5 Diagnostic - Market size and forecast 2025-2030

Chart on Diagnostic - Market size and forecast 2025-2030 ($ thousand)
Data Table on Diagnostic - Market size and forecast 2025-2030 ($ thousand)
Chart on Diagnostic - Year-over-year growth 2025-2030 (%)
Data Table on Diagnostic - Year-over-year growth 2025-2030 (%)

8.6 Others - Market size and forecast 2025-2030

Chart on Others - Market size and forecast 2025-2030 ($ thousand)
Data Table on Others - Market size and forecast 2025-2030 ($ thousand)
Chart on Others - Year-over-year growth 2025-2030 (%)
Data Table on Others - Year-over-year growth 2025-2030 (%)

8.7 Market opportunity by Application

Market opportunity by Application ($ thousand)
Data Table on Market opportunity by Application ($ thousand)

9. Market Segmentation by Type

9.1 Market segments

Chart on Type - Market share 2025-2030 (%)
Data Table on Type - Market share 2025-2030 (%)

9.2 Comparison by Type

Chart on Comparison by Type
Data Table on Comparison by Type

9.3 Nucleic acid aptamers - Market size and forecast 2025-2030

Chart on Nucleic acid aptamers - Market size and forecast 2025-2030 ($ thousand)
Data Table on Nucleic acid aptamers - Market size and forecast 2025-2030 ($ thousand)
Chart on Nucleic acid aptamers - Year-over-year growth 2025-2030 (%)
Data Table on Nucleic acid aptamers - Year-over-year growth 2025-2030 (%)

9.4 Peptide aptamers - Market size and forecast 2025-2030

Chart on Peptide aptamers - Market size and forecast 2025-2030 ($ thousand)
Data Table on Peptide aptamers - Market size and forecast 2025-2030 ($ thousand)
Chart on Peptide aptamers - Year-over-year growth 2025-2030 (%)
Data Table on Peptide aptamers - Year-over-year growth 2025-2030 (%)

9.5 Market opportunity by Type

Market opportunity by Type ($ thousand)
Data Table on Market opportunity by Type ($ thousand)

10. Market Segmentation by End-user

10.1 Market segments

Chart on End-user - Market share 2025-2030 (%)
Data Table on End-user - Market share 2025-2030 (%)

10.2 Comparison by End-user

Chart on Comparison by End-user
Data Table on Comparison by End-user

10.3 Pharmaceutical and biotechnology companies - Market size and forecast 2025-2030

Chart on Pharmaceutical and biotechnology companies - Market size and forecast 2025-2030 ($ thousand)
Data Table on Pharmaceutical and biotechnology companies - Market size and forecast 2025-2030 ($ thousand)
Chart on Pharmaceutical and biotechnology companies - Year-over-year growth 2025-2030 (%)
Data Table on Pharmaceutical and biotechnology companies - Year-over-year growth 2025-2030 (%)

10.4 Academic and government research institutes - Market size and forecast 2025-2030

Chart on Academic and government research institutes - Market size and forecast 2025-2030 ($ thousand)
Data Table on Academic and government research institutes - Market size and forecast 2025-2030 ($ thousand)
Chart on Academic and government research institutes - Year-over-year growth 2025-2030 (%)
Data Table on Academic and government research institutes - Year-over-year growth 2025-2030 (%)

10.5 Contract research organizations - Market size and forecast 2025-2030

Chart on Contract research organizations - Market size and forecast 2025-2030 ($ thousand)
Data Table on Contract research organizations - Market size and forecast 2025-2030 ($ thousand)
Chart on Contract research organizations - Year-over-year growth 2025-2030 (%)
Data Table on Contract research organizations - Year-over-year growth 2025-2030 (%)

10.6 Others - Market size and forecast 2025-2030

Chart on Others - Market size and forecast 2025-2030 ($ thousand)
Data Table on Others - Market size and forecast 2025-2030 ($ thousand)
Chart on Others - Year-over-year growth 2025-2030 (%)
Data Table on Others - Year-over-year growth 2025-2030 (%)

10.7 Market opportunity by End-user

Market opportunity by End-user ($ thousand)
Data Table on Market opportunity by End-user ($ thousand)

11. Customer Landscape

11.1 Customer landscape overview

Analysis of price sensitivity, lifecycle, customer purchase basket, adoption rates, and purchase criteria

12. Geographic Landscape

12.1 Geographic segmentation

Chart on Market share by geography 2025-2030 (%)
Data Table on Market share by geography 2025-2030 (%)

12.2 Geographic comparison

Chart on Geographic comparison
Data Table on Geographic comparison

12.3 North America - Market size and forecast 2025-2030

Chart on North America - Market size and forecast 2025-2030 ($ thousand)
Data Table on North America - Market size and forecast 2025-2030 ($ thousand)
Chart on North America - Year-over-year growth 2025-2030 (%)
Data Table on North America - Year-over-year growth 2025-2030 (%)
Chart on Regional Comparison - North America
Data Table on Regional Comparison - North America

12.3.1 US - Market size and forecast 2025-2030

Chart on US - Market size and forecast 2025-2030 ($ thousand)
Data Table on US - Market size and forecast 2025-2030 ($ thousand)
Chart on US - Year-over-year growth 2025-2030 (%)
Data Table on US - Year-over-year growth 2025-2030 (%)

12.3.2 Canada - Market size and forecast 2025-2030

Chart on Canada - Market size and forecast 2025-2030 ($ thousand)
Data Table on Canada - Market size and forecast 2025-2030 ($ thousand)
Chart on Canada - Year-over-year growth 2025-2030 (%)
Data Table on Canada - Year-over-year growth 2025-2030 (%)

12.3.3 Mexico - Market size and forecast 2025-2030

Chart on Mexico - Market size and forecast 2025-2030 ($ thousand)
Data Table on Mexico - Market size and forecast 2025-2030 ($ thousand)
Chart on Mexico - Year-over-year growth 2025-2030 (%)
Data Table on Mexico - Year-over-year growth 2025-2030 (%)

12.4 Europe - Market size and forecast 2025-2030

Chart on Europe - Market size and forecast 2025-2030 ($ thousand)
Data Table on Europe - Market size and forecast 2025-2030 ($ thousand)
Chart on Europe - Year-over-year growth 2025-2030 (%)
Data Table on Europe - Year-over-year growth 2025-2030 (%)
Chart on Regional Comparison - Europe
Data Table on Regional Comparison - Europe

12.4.1 Germany - Market size and forecast 2025-2030

Chart on Germany - Market size and forecast 2025-2030 ($ thousand)
Data Table on Germany - Market size and forecast 2025-2030 ($ thousand)
Chart on Germany - Year-over-year growth 2025-2030 (%)
Data Table on Germany - Year-over-year growth 2025-2030 (%)

12.4.2 UK - Market size and forecast 2025-2030

Chart on UK - Market size and forecast 2025-2030 ($ thousand)
Data Table on UK - Market size and forecast 2025-2030 ($ thousand)
Chart on UK - Year-over-year growth 2025-2030 (%)
Data Table on UK - Year-over-year growth 2025-2030 (%)

12.4.3 France - Market size and forecast 2025-2030

Chart on France - Market size and forecast 2025-2030 ($ thousand)
Data Table on France - Market size and forecast 2025-2030 ($ thousand)
Chart on France - Year-over-year growth 2025-2030 (%)
Data Table on France - Year-over-year growth 2025-2030 (%)

12.4.4 Italy - Market size and forecast 2025-2030

Chart on Italy - Market size and forecast 2025-2030 ($ thousand)
Data Table on Italy - Market size and forecast 2025-2030 ($ thousand)
Chart on Italy - Year-over-year growth 2025-2030 (%)
Data Table on Italy - Year-over-year growth 2025-2030 (%)

12.4.5 Spain - Market size and forecast 2025-2030

Chart on Spain - Market size and forecast 2025-2030 ($ thousand)
Data Table on Spain - Market size and forecast 2025-2030 ($ thousand)
Chart on Spain - Year-over-year growth 2025-2030 (%)
Data Table on Spain - Year-over-year growth 2025-2030 (%)

12.4.6 The Netherlands - Market size and forecast 2025-2030

Chart on The Netherlands - Market size and forecast 2025-2030 ($ thousand)
Data Table on The Netherlands - Market size and forecast 2025-2030 ($ thousand)
Chart on The Netherlands - Year-over-year growth 2025-2030 (%)
Data Table on The Netherlands - Year-over-year growth 2025-2030 (%)

12.5 Asia - Market size and forecast 2025-2030

Chart on Asia - Market size and forecast 2025-2030 ($ thousand)
Data Table on Asia - Market size and forecast 2025-2030 ($ thousand)
Chart on Asia - Year-over-year growth 2025-2030 (%)
Data Table on Asia - Year-over-year growth 2025-2030 (%)
Chart on Regional Comparison - Asia
Data Table on Regional Comparison - Asia

12.5.1 China - Market size and forecast 2025-2030

Chart on China - Market size and forecast 2025-2030 ($ thousand)
Data Table on China - Market size and forecast 2025-2030 ($ thousand)
Chart on China - Year-over-year growth 2025-2030 (%)
Data Table on China - Year-over-year growth 2025-2030 (%)

12.5.2 Japan - Market size and forecast 2025-2030

Chart on Japan - Market size and forecast 2025-2030 ($ thousand)
Data Table on Japan - Market size and forecast 2025-2030 ($ thousand)
Chart on Japan - Year-over-year growth 2025-2030 (%)
Data Table on Japan - Year-over-year growth 2025-2030 (%)

12.5.3 India - Market size and forecast 2025-2030

Chart on India - Market size and forecast 2025-2030 ($ thousand)
Data Table on India - Market size and forecast 2025-2030 ($ thousand)
Chart on India - Year-over-year growth 2025-2030 (%)
Data Table on India - Year-over-year growth 2025-2030 (%)

12.5.4 South Korea - Market size and forecast 2025-2030

Chart on South Korea - Market size and forecast 2025-2030 ($ thousand)
Data Table on South Korea - Market size and forecast 2025-2030 ($ thousand)
Chart on South Korea - Year-over-year growth 2025-2030 (%)
Data Table on South Korea - Year-over-year growth 2025-2030 (%)

12.5.5 Indonesia - Market size and forecast 2025-2030

Chart on Indonesia - Market size and forecast 2025-2030 ($ thousand)
Data Table on Indonesia - Market size and forecast 2025-2030 ($ thousand)
Chart on Indonesia - Year-over-year growth 2025-2030 (%)
Data Table on Indonesia - Year-over-year growth 2025-2030 (%)

12.5.6 Thailand - Market size and forecast 2025-2030

Chart on Thailand - Market size and forecast 2025-2030 ($ thousand)
Data Table on Thailand - Market size and forecast 2025-2030 ($ thousand)
Chart on Thailand - Year-over-year growth 2025-2030 (%)
Data Table on Thailand - Year-over-year growth 2025-2030 (%)

12.6 Rest of World (ROW) - Market size and forecast 2025-2030

Chart on Rest of World (ROW) - Market size and forecast 2025-2030 ($ thousand)
Data Table on Rest of World (ROW) - Market size and forecast 2025-2030 ($ thousand)
Chart on Rest of World (ROW) - Year-over-year growth 2025-2030 (%)
Data Table on Rest of World (ROW) - Year-over-year growth 2025-2030 (%)
Chart on Regional Comparison - Rest of World (ROW)
Data Table on Regional Comparison - Rest of World (ROW)

12.6.1 Brazil - Market size and forecast 2025-2030

Chart on Brazil - Market size and forecast 2025-2030 ($ thousand)
Data Table on Brazil - Market size and forecast 2025-2030 ($ thousand)
Chart on Brazil - Year-over-year growth 2025-2030 (%)
Data Table on Brazil - Year-over-year growth 2025-2030 (%)

12.6.2 Saudi Arabia - Market size and forecast 2025-2030

Chart on Saudi Arabia - Market size and forecast 2025-2030 ($ thousand)
Data Table on Saudi Arabia - Market size and forecast 2025-2030 ($ thousand)
Chart on Saudi Arabia - Year-over-year growth 2025-2030 (%)
Data Table on Saudi Arabia - Year-over-year growth 2025-2030 (%)

12.6.3 UAE - Market size and forecast 2025-2030

Chart on UAE - Market size and forecast 2025-2030 ($ thousand)
Data Table on UAE - Market size and forecast 2025-2030 ($ thousand)
Chart on UAE - Year-over-year growth 2025-2030 (%)
Data Table on UAE - Year-over-year growth 2025-2030 (%)

12.6.4 South Africa - Market size and forecast 2025-2030

Chart on South Africa - Market size and forecast 2025-2030 ($ thousand)
Data Table on South Africa - Market size and forecast 2025-2030 ($ thousand)
Chart on South Africa - Year-over-year growth 2025-2030 (%)
Data Table on South Africa - Year-over-year growth 2025-2030 (%)

12.6.5 Argentina - Market size and forecast 2025-2030

Chart on Argentina - Market size and forecast 2025-2030 ($ thousand)
Data Table on Argentina - Market size and forecast 2025-2030 ($ thousand)
Chart on Argentina - Year-over-year growth 2025-2030 (%)
Data Table on Argentina - Year-over-year growth 2025-2030 (%)

12.6.6 Colombia - Market size and forecast 2025-2030

Chart on Colombia - Market size and forecast 2025-2030 ($ thousand)
Data Table on Colombia - Market size and forecast 2025-2030 ($ thousand)
Chart on Colombia - Year-over-year growth 2025-2030 (%)
Data Table on Colombia - Year-over-year growth 2025-2030 (%)

12.6.7 Turkey - Market size and forecast 2025-2030

Chart on Turkey - Market size and forecast 2025-2030 ($ thousand)
Data Table on Turkey - Market size and forecast 2025-2030 ($ thousand)
Chart on Turkey - Year-over-year growth 2025-2030 (%)
Data Table on Turkey - Year-over-year growth 2025-2030 (%)

12.6.8 Israel - Market size and forecast 2025-2030

Chart on Israel - Market size and forecast 2025-2030 ($ thousand)
Data Table on Israel - Market size and forecast 2025-2030 ($ thousand)
Chart on Israel - Year-over-year growth 2025-2030 (%)
Data Table on Israel - Year-over-year growth 2025-2030 (%)

12.7 Market opportunity by geography

Market opportunity by geography ($ thousand)
Data Tables on Market opportunity by geography ($ thousand)

13. Drivers, Challenges, and Opportunity

13.1 Market drivers

Strategic mainstreaming of AI-driven in-silico aptamer discovery
Industrialization of ultra-sensitive diagnostics and point-of-care biosensing
Structural expansion of therapeutics and aptamer-drug conjugates

13.2 Market challenges

Persistence of intellectual property thickets and freedom to operate
Technical constraint of analytical-grade oligonucleotide synthesis capacity
Clinical barrier of rapid renal clearance and pharmacokinetic optimization

13.3 Impact of drivers and challenges

Impact of drivers and challenges in 2025 and 2030

13.4 Market opportunities

Increase of generative AI and ML driven aptamer selection
Growth of multivalent aptamer architectures and targeted radiopharmaceutical
Integration of multi-faceted commercial licensing and enzyme-modulating proprietary

14. Competitive Landscape

14.1 Overview

14.2

Overview on criticality of inputs and factors of differentiation

14.3 Landscape disruption

Overview on factors of disruption

14.4 Industry risks

Impact of key risks on business

15. Competitive Analysis

15.1 Companies profiled

Companies covered

15.2 Company ranking index

15.3 Market positioning of companies

Matrix on companies position and classification

15.4 AMS Biotechnology Ltd.

AMS Biotechnology Ltd. - Overview
AMS Biotechnology Ltd. - Product / Service
AMS Biotechnology Ltd. - Key offerings
SWOT

15.5 Aptadel Therapeutics

Aptadel Therapeutics - Overview
Aptadel Therapeutics - Product / Service
Aptadel Therapeutics - Key offerings
SWOT

15.6 Aptagen LLC

Aptagen LLC - Overview
Aptagen LLC - Product / Service
Aptagen LLC - Key offerings
SWOT

15.7 Aptus Biotech S.L.

Aptus Biotech S.L. - Overview
Aptus Biotech S.L. - Product / Service
Aptus Biotech S.L. - Key offerings
SWOT

15.8 Barrick Lab

Barrick Lab - Overview
Barrick Lab - Product / Service
Barrick Lab - Key offerings
SWOT

15.9 Base Pair Biotechnologies Inc.

Base Pair Biotechnologies Inc. - Overview
Base Pair Biotechnologies Inc. - Product / Service
Base Pair Biotechnologies Inc. - Key offerings
SWOT

15.10 Basking Biosciences Inc.

Basking Biosciences Inc. - Overview
Basking Biosciences Inc. - Product / Service
Basking Biosciences Inc. - Key offerings
SWOT

15.11 Creative Biogene

Creative Biogene - Overview
Creative Biogene - Product / Service
Creative Biogene - Key offerings
SWOT

15.12 NeoVentures Biotechnology Inc.

NeoVentures Biotechnology Inc. - Overview
NeoVentures Biotechnology Inc. - Product / Service
NeoVentures Biotechnology Inc. - Key offerings
SWOT

15.13 Novaptech SAS

Novaptech SAS - Overview
Novaptech SAS - Product / Service
Novaptech SAS - Key offerings
SWOT

15.14 Oligo Factory

Oligo Factory - Overview
Oligo Factory - Product / Service
Oligo Factory - Key offerings
SWOT

15.15 SomaLogic Inc.

SomaLogic Inc. - Overview
SomaLogic Inc. - Product / Service
SomaLogic Inc. - Key offerings
SWOT

15.16 TriLink BioTechnologies

TriLink BioTechnologies - Overview
TriLink BioTechnologies - Product / Service
TriLink BioTechnologies - Key offerings
SWOT

15.17 Veraptus

Veraptus - Overview
Veraptus - Product / Service
Veraptus - Key offerings
SWOT

15.18 Vivonics Inc.

Vivonics Inc. - Overview
Vivonics Inc. - Product / Service
Vivonics Inc. - Key offerings
SWOT

16. Appendix

16.1 Scope of the report

Market definition
Objectives
Notes and caveats

16.2 Inclusions and exclusions checklist

Inclusions checklist
Exclusions checklist

16.3 Currency conversion rates for US$

16.4 Research methodology

16.5 Data procurement

Information sources

16.6 Data validation

16.7 Validation techniques employed for market sizing

16.8 Data synthesis

16.9 360 degree market analysis

16.10 List of abbreviations

Research Methodology

Technavio presents a detailed picture of the market by way of study, synthesis, and summation of data from multiple sources. The analysts have presented the various facets of the market with a particular focus on identifying the key industry influencers. The data thus presented is comprehensive, reliable, and the result of extensive research, both primary and secondary.

INFORMATION SOURCES

Primary sources

  • Manufacturers and suppliers
  • Channel partners
  • Industry experts
  • Strategic decision makers

Secondary sources

  • Industry journals and periodicals
  • Government data
  • Financial reports of key industry players
  • Historical data
  • Press releases

DATA ANALYSIS

Data Synthesis

  • Collation of data
  • Estimation of key figures
  • Analysis of derived insights

Data Validation

  • Triangulation with data models
  • Reference against proprietary databases
  • Corroboration with industry experts

REPORT WRITING

Qualitative

  • Market drivers
  • Market challenges
  • Market trends
  • Five forces analysis

Quantitative

  • Market size and forecast
  • Market segmentation
  • Geographical insights
  • Competitive landscape

Interested in this report?

Get your sample now to see our research methodology and insights!

Download Now

Frequently Asked Questions

Aptamers market growth will increase by USD 8340872.0 thousand thousand during 2026-2030.

The Aptamers market is expected to grow at a CAGR of 55.2% during 2026-2030.

Aptamers market is segmented by Application (Therapeutics development, Research and development, Diagnostic, Others) Type (Nucleic acid aptamers, Peptide aptamers) End-user (Pharmaceutical and biotechnology companies, Academic and government research institutes, Contract research organizations, Others)

2bind GmbH, AMS Biotechnology Ltd., Aptadel Therapeutics, Aptagen LLC, Aptus Biotech S.L., Barrick Lab, Base Pair Biotechnologies Inc., Basking Biosciences Inc., Creative Biogene, NeoVentures Biotechnology Inc., Novaptech SAS, Oligo Factory, SomaLogic Inc., TriLink BioTechnologies, Veraptus, Vivonics Inc. are a few of the key vendors in the Aptamers market.

North America will register the highest growth rate of 53.6% among the other regions. Therefore, the Aptamers market in North America is expected to garner significant business opportunities for the vendors during the forecast period.

US, Canada, Mexico, Germany, UK, France, Italy, Spain, The Netherlands, China, Japan, India, South Korea, Indonesia, Thailand, Brazil, Saudi Arabia, UAE, South Africa, Argentina, Colombia, Turkey, Israel

  • Strategic mainstreaming of AI-driven in-silico aptamer discovery is the driving factor this market.

The Aptamers market vendors should focus on grabbing business opportunities from the Application segment as it accounted for the largest market share in the base year.
RIA - Research AI Assistant
Ask RIA