Aromatic Solvents Market Analysis APAC, North America, Europe, Middle East and Africa, South America - US, United Arab Emirates, China, India, Germany - Size and Forecast 2024-2028

Aromatic Solvents Market Analysis APAC, North America, Europe, Middle East and Africa, South America - US, United Arab Emirates, China, India, Germany - Size and Forecast 2024-2028

Published: Apr 2024 188 Pages SKU: IRTNTR43931

Market Overview at a Glance

$1.27 B
Market Opportunity
3.54%
CAGR
3.12
YoY growth 2023-2024(%)

Aromatic Solvents Market Size 2024-2028

The aromatic solvents market size is forecast to increase by USD 1.27 billion at a CAGR of 3.54% between 2023 and 2028.

  •  The aromatic solvents market is witnessing substantial growth, driven by several key trends. A significant factor fueling this expansion is the rising demand in the building and construction sector, where aromatic solvents are extensively used in paints and coatings applications. 
  • Another influential trend is the prioritization of performance and efficiency by manufacturers, leading to the development of advanced aromatic solvents with enhanced properties. Crude oil price fluctuations also impact the market, as aromatic solvents derived from petrochemicals are affected by these price changes. These trends are anticipated to propel the growth of the aromatic solvents market in the forthcoming years.

What will be the Size of the Aromatic Solvents Market During the Forecast Period?

Aromatic Solvents Market Size

 Request Free Sample

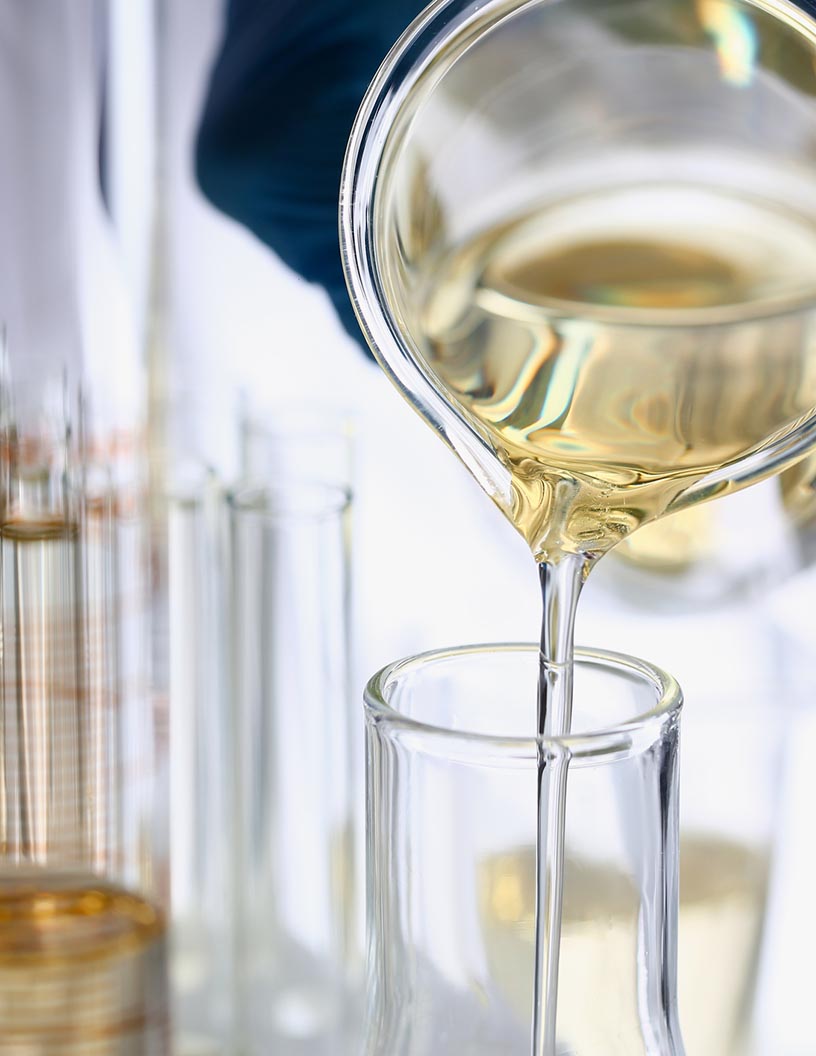
  • The market encompasses a range of organic liquids derived from the refining of crude petroleum stock, including aromatic hydrocarbons such as toluene, xylene, and ethylbenzene. These solvents are widely used in various industries due to their unique properties, such as their ability to dissolve solid materials in homogeneous solutions. In the oil refining industry, aromatic solvents serve as crucial diluents for heavy oils and are integral to the production of gasoline and jet fuel. Beyond energy applications, aromatic solvents find extensive use in sectors like paints & coatings, cleaning & degreasing, automotive OEM, machinery, building & construction activities, and the cosmetics industry.
  • They are essential components In the manufacturing of varnishes, nail polish removers, cleaners, and adhesive films. The market's growth is driven by the increasing demand for these applications, particularly in emerging economies. The automotive sector, including electric, autonomous vehicles, and alternative drivetrains, is another significant market for aromatic solvents. These solvents are used In the production of automotive components and as fuel additives. The construction sector also contributes to the market's growth, with aromatic solvents used as solvents in paints, coatings, and adhesives. In summary, the market is a dynamic and diverse industry, driven by the demand for organic liquids in various sectors, including energy, manufacturing, and consumer goods. The market's size and direction are influenced by factors such as technological advancements, regulatory requirements, and global economic trends.

How is this Aromatic Solvents Industry segmented and which is the largest segment?

The aromatic solvents industry research report provides comprehensive data (region-wise segment analysis), with forecasts and estimates in "USD million" for the period 2024-2028, as well as historical data from 2018-2022 for the following segments.
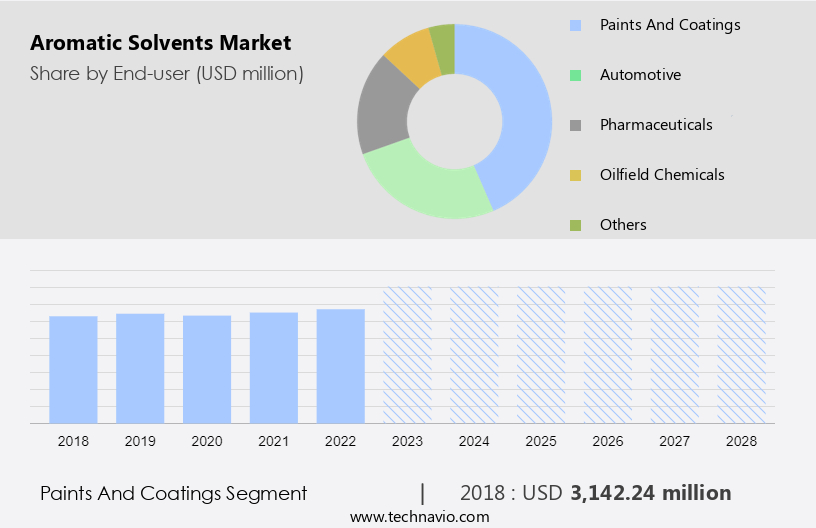
  • End-user
    • Paints and coatings
    • Automotive
    • Pharmaceuticals
    • Oilfield chemicals
    • Others
  • Type
    • Toluene
    • Xylene
    • Ethylbenzene
    • Benzene
    • Others
  • Geography
    • APAC
      • China
      • India
      • Japan
    • North America
      • US
      • Canada
    • Europe
      • Germany
      • Spain
    • Middle East and Africa
      • South Africa
    • South America

By End-user Insights

  • The paints and coatings segment is estimated to witness significant growth during the forecast period.

The market is primarily driven by the paints and coatings industry due to the unique properties of aromatic solvents, such as higher solvency rates, compared to their aliphatic counterparts. Aromatic solvents, including toluene, xylene, and high-flash aromatic naphthas, are essential components In the production and application of paints and coatings. These solvents enhance the performance and quality of paints and coatings by improving their flow and leveling properties. In the oil refining industry, aromatic solvents serve as diluents, solvents for varnishes and pigments, and chemical intermediates. Additionally, they are used In the production of tyre additives, ink, corrosion coatings, adhesives and sealants, vehicle parts, crop protection products, and green solvents. Aromatic solvents are also utilized In the leather and rubber industries as raw materials, and In the automobile manufacturing sector for corrosion resistance and In the production of active pharmaceutical ingredients. With the increasing demand for solvents in various industries, the market for aromatic solvents is expected to grow steadily.

Aromatic Solvents Market Size

Get a glance at the market report of various segments Request Free Sample

The Paints and coatings segment was valued at USD 3.14 billion in 2018 and showed a gradual increase during the forecast period.

Regional Analysis

  • APAC is estimated to contribute 50% to the growth of the global market during the forecast period.

Technavio's analysts have elaborately explained the regional trends and drivers that shape the market during the forecast period.

Aromatic Solvents Market Share by Geography

For more insights on the market size of various regions, Request Free Sample

The APAC the market is experiencing steady growth due to increasing industrialization, urbanization, and infrastructure development In the region. This expansion is driving demand for aromatic solvents in sectors such as construction, automotive, and electronics, where they are used in applications like coatings, adhesives, sealants, and electronic cleaning. The market is also witnessing a shift towards eco-friendly and sustainable solvent solutions due to growing environmental concerns and regulatory pressure to reduce VOC emissions. Bio-based and low-VOC aromatic solvents are gaining popularity In the region, particularly in applications such as paints and coatings, printing inks, and oilfield chemicals. The automotive industry, including electric and autonomous vehicles, and the construction sector are major consumers of aromatic solvents, with the former expected to grow due to the increasing demand for alternative drivetrains.

Market Dynamics

Our  researchers analyzed the data with 2023 as the base year, along with the key drivers, trends, and challenges. A holistic analysis of drivers will help companies refine their marketing strategies to gain a competitive advantage.

What are the key market drivers leading to the rise In the adoption of Aromatic Solvents Industry?

Rise in building and construction activities is the key driver of the market.

  • The market experiences growth due to the escalating demand from various industries, particularly In the construction sector. With the increasing number of infrastructure development projects and urbanization worldwide, the construction industry's need for paints, coatings, adhesives, and sealants is on the rise. Aromatic solvents play a crucial role In the production of these materials, enhancing their properties such as durability, weather resistance, and overall performance. Notable construction projects, including the development of commercial complexes, residential buildings, and skyscrapers in urban centers like Dubai, Shanghai, and New York City, have fueled the demand for aromatic solvents. These solvents are indispensable for creating high-quality architectural coatings and adhesives that meet modern construction designs and standards.
  • Additionally, aromatic solvents are used extensively in various industries, including the oil refining industry, as diluents, varnishes, and chemical intermediates. They are also employed In the production of solvents for printing inks, leather industry, rubber industry, raw materials for automobile manufacturers, corrosion resistance coatings, active pharmaceutical ingredients, adhesives and sealants, vehicle parts, crop protection products, and green solvents for agricultural crops. Aromatic solvents, such as benzene, toluene, xylene, ethane, and naphtha, have diverse applications and are integral to numerous industrial processes. Their chemical composition, including solvency and evaporation rate, makes them suitable for various applications, including cleaning and degreasing, hydrocarbon production, and petrochemicals.
  • Furthermore, aromatic solvents are used In the production of solvents for nail polish removers, cleaners, automotive OEM, machinery, and building & construction activities. The automotive industry, electric vehicles, autonomous vehicles, alternative drivetrains, and the correction fluids industry also utilize aromatic solvents. In the chemical industry, aromatic solvents are used as raw materials for producing polymers, synthetic fibers, synthetic lubricants, dyes, resins, and detergents. Xylene solvents, ethylbenzene solvents, and mixed xylenes are widely used In the production of various chemicals and industrial applications. The oilfield chemicals industry also relies on aromatic solvents for their unique properties, including their ability to enhance the performance of drilling fluids and completion fluids.

What are the market trends shaping the Aromatic Solvents Industry?

Focus of manufacturers on performance and efficiency is the upcoming market trend.

  • Aromatic solvents, derived from organic chemicals such as aromatic hydrocarbons including ethane, toluene, xylene, and naphtha, play a pivotal role in numerous industries. In the oil refining industry, they serve as diluents, enhancing the flow properties of crude petroleum stocks. In the manufacturing of solid materials like varnishes, paints, and chemical intermediates, aromatic solvents like benzene, toluene solvents, and xylene solvents contribute significantly. Industries demand aromatic solvents for their superior performance and efficiency. These solvents offer faster evaporation rates, crucial for applications requiring quick drying times. In the paints and coatings industry, they contribute to high-performance architectural and industrial coatings with excellent adhesion, durability, and weather resistance.
  • In the automotive sector, aromatic solvents are used in automobile manufacturing for corrosion resistance, and In the production of active pharmaceutical ingredients, adhesives and sealants, vehicle parts, crop protection products, and green solvents. Manufacturers focus on creating aromatic solvents with enhanced solvency power and improved compatibility with other chemicals to optimize product performance and efficiency. For instance, In the printing inks industry, aromatic solvents ensure excellent print quality and color consistency. They also cater to the needs of the leather and rubber industries, providing superior processing capabilities. In the construction sector, aromatic solvents are utilized in adhesive films, cleaning and degreasing applications, and In the production of polymers, synthetic fibers, synthetic lubricants, dyes, resins, and detergents.
  • In the context of emerging trends, aromatic solvents are increasingly being used in electric vehicles, autonomous vehicles, and alternative drivetrains, as they offer superior solvency and compatibility with various materials. Furthermore, the demand for non-corrosive, non-carcinogenic, and biodegradable aromatic solvents is on the rise, driven by the growing focus on sustainability and environmental concerns. In summary, The market is driven by the need for high-performance and efficient solvents in various industries. Aromatic solvents offer superior solvency power, faster evaporation rates, and improved compatibility with other chemicals, making them indispensable in applications ranging from paints and coatings to pharmaceuticals and chemical manufacturing.
  • Manufacturers are continually innovating to meet the evolving demands of industries, focusing on developing aromatic solvents with enhanced performance characteristics and sustainability.

What challenges does the Aromatic Solvents Industry face during its growth?

Fluctuation in crude oil price is a key challenge affecting the industry growth.

  • Aromatic solvents, derived primarily from organic chemicals such as aromatic hydrocarbons, play a crucial role in various industries. These solvents, including Ethane, Toluene, Xylene, and Naphtha, are used as diluents, varnishes, paints, chemical intermediates, and solvents in various applications. Their chemical composition, particularly the presence of Benzene, influences their properties, such as solvency and evaporation rate. The oil refining industry is a significant consumer of aromatic solvents. Crude petroleum stock undergoes refining processes to produce these solvents. However, price fluctuations of crude oil pose challenges to the market's growth. Sudden increases in crude oil prices can lead to higher production costs for aromatic solvents, affecting profit margins for manufacturers and potentially resulting in increased prices for consumers.
  • Aromatic solvents are integral to various industries, including the automobile manufacturing sector, where they are used in corrosion resistance coatings, adhesives, and sealants for vehicle parts. They are also used In the production of agrochemicals, such as crop protection products, and In the cosmetics industry for nail polish removers and cleaners. Additionally, they are employed In the printing inks, leather, and rubber industries, as well as In the production of polymers, synthetic fibers, synthetic lubricants, dyes, resins, and detergents. Despite the challenges posed by crude oil price fluctuations, the demand for aromatic solvents remains robust due to their wide range of applications.
  • Alternative drivetrains, such as electric and autonomous vehicles, and the construction sector's growth also contribute to the market's potential expansion. The development of green solvents, which are biodegradable, non-corrosive, and non-carcinogenic, is another trend gaining traction In the market. In summary, the market faces challenges due to price fluctuations of crude oil, but its wide range of applications and the development of eco-friendly alternatives ensure its continued growth. The market encompasses various industries, including oilfield chemicals, paints and coatings, cleaning and degreasing, and the automotive OEM sector. Aromatic solvents are essential raw materials for numerous applications, from varnishes and paints to adhesives and sealants, and from printing inks to agrochemicals and cosmetics.

Exclusive Customer Landscape

The aromatic solvents market forecasting report includes the adoption lifecycle of the market, covering from the innovator's stage to the laggard's stage. It focuses on adoption rates in different regions based on penetration. Furthermore, the aromatic solvents market report also includes key purchase criteria and drivers of price sensitivity to help companies evaluate and develop their market growth analysis strategies.

Aromatic Solvents Market Share by Geography

 Customer Landscape

Key Companies & Market Insights

Companies are implementing various strategies, such as strategic alliances, aromatic solvents market forecast, partnerships, mergers and acquisitions, geographical expansion, and product/service launches, to enhance their presence In the industry.

AGROFERT AS - The company's subsidiary, Deza, provides a range of aromatic solvents including toluene, xylene, and solvent naphtha for various applications In the industries of paints, varnishes, adhesives, and sealants. These solvents are integral components in manufacturing processes, contributing significantly to the production of high-quality end products. The market is witnessing steady growth due to increasing demand from various industries, particularly In the Asia Pacific region. Factors such as expanding infrastructure, rising disposable income, and urbanization are driving the market's growth. Additionally, the shift towards sustainable and eco-friendly solvents is also influencing market trends. Despite these opportunities, challenges such as stringent regulations and price volatility of raw materials persist. The company's commitment to innovation and sustainability positions it well to navigate these challenges and continue providing solutions to its customers.

The industry research and growth report includes detailed analyses of the competitive landscape of the market and information about key companies, including:

  • AGROFERT AS
  • Arham Petrochem Pvt. Ltd.
  • BASF SE
  • Chevron Phillips Chemical Co. LLC
  • Compania Espanola de Petroleos SA
  • Eastman Chemical Co.
  • Exxon Mobil Corp.
  • HCS Group GmbH
  • Honeywell International Inc.
  • Korea Petrochemical Ind. Co. Ltd.
  • Monument Chemical
  • Neste Corp.
  • ORG CHEM GROUP
  • Pampa Energia SA
  • RB Products Inc.
  • Reliance Industries Ltd.
  • Resolute Oil LLC
  • Saudi Arabian Oil Co.
  • Shell plc
  • Shri Parth Petrochem
  • SK Innovation Co. Ltd.
  • Vinati Organics Ltd.

Qualitative and quantitative analysis of companies has been conducted to help clients understand the wider business environment as well as the strengths and weaknesses of key industry players. Data is qualitatively analyzed to categorize companies as pure play, category-focused, industry-focused, and diversified; it is quantitatively analyzed to categorize companies as dominant, leading, strong, tentative, and weak.

Research Analyst Overview

Aromatic solvents, a category of organic chemicals derived from the distillation and refining of crude petroleum stock, play a significant role in various industries. These solvents, which include ethane, toluene, xylene, naphtha, and benzene, among others, offer unique properties that make them indispensable in numerous applications. The oil refining industry is a primary consumer of aromatic hydrocarbons. These solvents serve as diluents, helping to reduce the viscosity of crude oil for easier processing. In addition, they are used as raw materials In the production of various industrial and consumer products. In the manufacturing sector, aromatic solvents find extensive use In the production of varnishes, paints, and chemical intermediates.

Their chemical composition enables them to act as effective solvents, enhancing the flow and dispersion of pigments, extenders, binders, and other additives. The chemical industry relies on aromatic solvents for the production of a wide range of products. Toluene solvents, for instance, are utilized In the production of active pharmaceutical ingredients, adhesives and sealants, and vehicle parts. Xylene solvents are used In the production of dyes, resins, and detergents, while ethylbenzene solvents are used In the synthesis of polymers, synthetic fibers, and synthetic lubricants. The hazardous nature of some aromatic solvents necessitates stringent safety measures In their handling and disposal.

However, efforts are underway to develop green solvents, which are biodegradable, non-corrosive, and non-carcinogenic, to address these concerns. These solvents are finding increasing use In the agricultural sector for crop protection products. The automotive industry is another significant consumer of aromatic solvents. Toluene solvents are used as paint thinners and In the production of tyre additives. Benzene is used In the production of corrosion coatings and as a raw material In the synthesis of various chemical intermediates. The construction sector also utilizes aromatic solvents in various applications. They are used in cleaning and degreasing operations, as well as In the production of adhesive films and correction fluids.

In the automotive OEM sector, aromatic solvents are used In the production of machinery and building & construction activities. The evolution of the transportation sector, with the rise of electric vehicles, autonomous vehicles, and alternative drivetrains, is expected to impact the demand for aromatic solvents. The varnishes industry, for instance, is expected to see a decline in demand due to the shift towards electric vehicles, which require less painting. However, the use of aromatic solvents In the production of batteries and other vehicle components is expected to offset this decline to some extent. In conclusion, aromatic solvents continue to play a crucial role in various industries, from oil refining to manufacturing, construction, and transportation.

Their unique chemical properties make them indispensable In the production of a wide range of products, from paints and coatings to adhesives and sealants, and from pharmaceuticals to agricultural chemicals. Despite the challenges posed by their hazardous nature, efforts are underway to develop green solvents that address these concerns while maintaining their performance advantages. The future of the market is expected to be shaped by technological advancements, regulatory requirements, and changing market dynamics.

Market Scope

Report Coverage

Details

Page number

188

Base year

2023

Historic period

2018-2022

Forecast period

2024-2028

Growth momentum & CAGR

Accelerate at a CAGR of 3.54%

Market growth 2024-2028

USD 1271.13 million

Market structure

Fragmented

YoY growth 2023-2024(%)

3.12

Key countries

US, United Arab Emirates, China, India, and Germany

Competitive landscape

Leading Companies, Market Positioning of Companies, Competitive Strategies, and Industry Risks

Request Free Sample

What are the Key Data Covered in this Aromatic Solvents Market Research and Growth Report?

  • CAGR of the Aromatic Solvents industry during the forecast period
  • Detailed information on factors that will drive the growth and forecasting between 2024 and 2028
  • Precise estimation of the size of the market and its contribution of the industry in focus to the parent market
  • Accurate predictions about upcoming growth and trends and changes in consumer behaviour
  • Growth of the market across APAC, North America, Europe, Middle East and Africa, and South America
  • Thorough analysis of the market's competitive landscape and detailed information about companies
  • Comprehensive analysis of factors that will challenge the aromatic solvents market growth of industry companies

We can help! Our analysts can customize this aromatic solvents market research report to meet your requirements.

Get in touch

1 Executive Summary

  • 1.1 Market overview
    • Exhibit 01: Executive Summary – Chart on Market Overview
    • Exhibit 02: Executive Summary – Data Table on Market Overview
    • Exhibit 03: Executive Summary – Chart on Global Market Characteristics
    • Exhibit 04: Executive Summary – Chart on Market by Geography
    • Exhibit 05: Executive Summary – Chart on Market Segmentation by End-user
    • Exhibit 06: Executive Summary – Chart on Market Segmentation by Type
    • Exhibit 07: Executive Summary – Chart on Incremental Growth
    • Exhibit 08: Executive Summary – Data Table on Incremental Growth
    • Exhibit 09: Executive Summary – Chart on Vendor Market Positioning

2 Market Landscape

  • 2.1 Market ecosystem
    • Exhibit 10: Parent market
    • Exhibit 11: Market Characteristics

3 Market Sizing

  • 3.1 Market definition
    • Exhibit 12: Offerings of vendors included in the market definition
  • 3.2 Market segment analysis
    • Exhibit 13: Market segments
  • 3.3 Market size 2023
    • 3.4 Market outlook: Forecast for 2023-2028
      • Exhibit 14: Chart on Global - Market size and forecast 2023-2028 ($ million)
      • Exhibit 15: Data Table on Global - Market size and forecast 2023-2028 ($ million)
      • Exhibit 16: Chart on Global Market: Year-over-year growth 2023-2028 (%)
      • Exhibit 17: Data Table on Global Market: Year-over-year growth 2023-2028 (%)

    4 Historic Market Size

    • 4.1 Global aromatic solvents market 2018 - 2022
      • Exhibit 18: Historic Market Size – Data Table on global aromatic solvents market 2018 - 2022 ($ million)
    • 4.2 End-user Segment Analysis 2018 - 2022
      • Exhibit 19: Historic Market Size – End-user Segment 2018 - 2022 ($ million)
    • 4.3 Type Segment Analysis 2018 - 2022
      • Exhibit 20: Historic Market Size – Type Segment 2018 - 2022 ($ million)
    • 4.4 Geography Segment Analysis 2018 - 2022
      • Exhibit 21: Historic Market Size – Geography Segment 2018 - 2022 ($ million)
    • 4.5 Country Segment Analysis 2018 - 2022
      • Exhibit 22: Historic Market Size – Country Segment 2018 - 2022 ($ million)

    5 Five Forces Analysis

    • 5.1 Five forces summary
      • Exhibit 23: Five forces analysis - Comparison between 2023 and 2028
    • 5.2 Bargaining power of buyers
      • Exhibit 24: Chart on Bargaining power of buyers – Impact of key factors 2023 and 2028
    • 5.3 Bargaining power of suppliers
      • Exhibit 25: Bargaining power of suppliers – Impact of key factors in 2023 and 2028
    • 5.4 Threat of new entrants
      • Exhibit 26: Threat of new entrants – Impact of key factors in 2023 and 2028
    • 5.5 Threat of substitutes
      • Exhibit 27: Threat of substitutes – Impact of key factors in 2023 and 2028
    • 5.6 Threat of rivalry
      • Exhibit 28: Threat of rivalry – Impact of key factors in 2023 and 2028
    • 5.7 Market condition
      • Exhibit 29: Chart on Market condition - Five forces 2023 and 2028

    6 Market Segmentation by End-user

    • 6.1 Market segments
      • Exhibit 30: Chart on End-user - Market share 2023-2028 (%)
      • Exhibit 31: Data Table on End-user - Market share 2023-2028 (%)
    • 6.2 Comparison by End-user
      • Exhibit 32: Chart on Comparison by End-user
      • Exhibit 33: Data Table on Comparison by End-user
    • 6.3 Paints and coatings - Market size and forecast 2023-2028
      • Exhibit 34: Chart on Paints and coatings - Market size and forecast 2023-2028 ($ million)
      • Exhibit 35: Data Table on Paints and coatings - Market size and forecast 2023-2028 ($ million)
      • Exhibit 36: Chart on Paints and coatings - Year-over-year growth 2023-2028 (%)
      • Exhibit 37: Data Table on Paints and coatings - Year-over-year growth 2023-2028 (%)
    • 6.4 Automotive - Market size and forecast 2023-2028
      • Exhibit 38: Chart on Automotive - Market size and forecast 2023-2028 ($ million)
      • Exhibit 39: Data Table on Automotive - Market size and forecast 2023-2028 ($ million)
      • Exhibit 40: Chart on Automotive - Year-over-year growth 2023-2028 (%)
      • Exhibit 41: Data Table on Automotive - Year-over-year growth 2023-2028 (%)
    • 6.5 Pharmaceuticals - Market size and forecast 2023-2028
      • Exhibit 42: Chart on Pharmaceuticals - Market size and forecast 2023-2028 ($ million)
      • Exhibit 43: Data Table on Pharmaceuticals - Market size and forecast 2023-2028 ($ million)
      • Exhibit 44: Chart on Pharmaceuticals - Year-over-year growth 2023-2028 (%)
      • Exhibit 45: Data Table on Pharmaceuticals - Year-over-year growth 2023-2028 (%)
    • 6.6 Oilfield chemicals - Market size and forecast 2023-2028
      • Exhibit 46: Chart on Oilfield chemicals - Market size and forecast 2023-2028 ($ million)
      • Exhibit 47: Data Table on Oilfield chemicals - Market size and forecast 2023-2028 ($ million)
      • Exhibit 48: Chart on Oilfield chemicals - Year-over-year growth 2023-2028 (%)
      • Exhibit 49: Data Table on Oilfield chemicals - Year-over-year growth 2023-2028 (%)
    • 6.7 Others - Market size and forecast 2023-2028
      • Exhibit 50: Chart on Others - Market size and forecast 2023-2028 ($ million)
      • Exhibit 51: Data Table on Others - Market size and forecast 2023-2028 ($ million)
      • Exhibit 52: Chart on Others - Year-over-year growth 2023-2028 (%)
      • Exhibit 53: Data Table on Others - Year-over-year growth 2023-2028 (%)
    • 6.8 Market opportunity by End-user
      • Exhibit 54: Market opportunity by End-user ($ million)
      • Exhibit 55: Data Table on Market opportunity by End-user ($ million)

    7 Market Segmentation by Type

    • 7.1 Market segments
      • Exhibit 56: Chart on Type - Market share 2023-2028 (%)
      • Exhibit 57: Data Table on Type - Market share 2023-2028 (%)
    • 7.2 Comparison by Type
      • Exhibit 58: Chart on Comparison by Type
      • Exhibit 59: Data Table on Comparison by Type
    • 7.3 Toluene - Market size and forecast 2023-2028
      • Exhibit 60: Chart on Toluene - Market size and forecast 2023-2028 ($ million)
      • Exhibit 61: Data Table on Toluene - Market size and forecast 2023-2028 ($ million)
      • Exhibit 62: Chart on Toluene - Year-over-year growth 2023-2028 (%)
      • Exhibit 63: Data Table on Toluene - Year-over-year growth 2023-2028 (%)
    • 7.4 Xylene - Market size and forecast 2023-2028
      • Exhibit 64: Chart on Xylene - Market size and forecast 2023-2028 ($ million)
      • Exhibit 65: Data Table on Xylene - Market size and forecast 2023-2028 ($ million)
      • Exhibit 66: Chart on Xylene - Year-over-year growth 2023-2028 (%)
      • Exhibit 67: Data Table on Xylene - Year-over-year growth 2023-2028 (%)
    • 7.5 Ethylbenzene - Market size and forecast 2023-2028
      • Exhibit 68: Chart on Ethylbenzene - Market size and forecast 2023-2028 ($ million)
      • Exhibit 69: Data Table on Ethylbenzene - Market size and forecast 2023-2028 ($ million)
      • Exhibit 70: Chart on Ethylbenzene - Year-over-year growth 2023-2028 (%)
      • Exhibit 71: Data Table on Ethylbenzene - Year-over-year growth 2023-2028 (%)
    • 7.6 Benzene - Market size and forecast 2023-2028
      • Exhibit 72: Chart on Benzene - Market size and forecast 2023-2028 ($ million)
      • Exhibit 73: Data Table on Benzene - Market size and forecast 2023-2028 ($ million)
      • Exhibit 74: Chart on Benzene - Year-over-year growth 2023-2028 (%)
      • Exhibit 75: Data Table on Benzene - Year-over-year growth 2023-2028 (%)
    • 7.7 Others - Market size and forecast 2023-2028
      • Exhibit 76: Chart on Others - Market size and forecast 2023-2028 ($ million)
      • Exhibit 77: Data Table on Others - Market size and forecast 2023-2028 ($ million)
      • Exhibit 78: Chart on Others - Year-over-year growth 2023-2028 (%)
      • Exhibit 79: Data Table on Others - Year-over-year growth 2023-2028 (%)
    • 7.8 Market opportunity by Type
      • Exhibit 80: Market opportunity by Type ($ million)
      • Exhibit 81: Data Table on Market opportunity by Type ($ million)

    8 Customer Landscape

    • 8.1 Customer landscape overview
      • Exhibit 82: Analysis of price sensitivity, lifecycle, customer purchase basket, adoption rates, and purchase criteria

    9 Geographic Landscape

    • 9.1 Geographic segmentation
      • Exhibit 83: Chart on Market share by geography 2023-2028 (%)
      • Exhibit 84: Data Table on Market share by geography 2023-2028 (%)
    • 9.2 Geographic comparison
      • Exhibit 85: Chart on Geographic comparison
      • Exhibit 86: Data Table on Geographic comparison
    • 9.3 APAC - Market size and forecast 2023-2028
      • Exhibit 87: Chart on APAC - Market size and forecast 2023-2028 ($ million)
      • Exhibit 88: Data Table on APAC - Market size and forecast 2023-2028 ($ million)
      • Exhibit 89: Chart on APAC - Year-over-year growth 2023-2028 (%)
      • Exhibit 90: Data Table on APAC - Year-over-year growth 2023-2028 (%)
    • 9.4 North America - Market size and forecast 2023-2028
      • Exhibit 91: Chart on North America - Market size and forecast 2023-2028 ($ million)
      • Exhibit 92: Data Table on North America - Market size and forecast 2023-2028 ($ million)
      • Exhibit 93: Chart on North America - Year-over-year growth 2023-2028 (%)
      • Exhibit 94: Data Table on North America - Year-over-year growth 2023-2028 (%)
    • 9.5 Europe - Market size and forecast 2023-2028
      • Exhibit 95: Chart on Europe - Market size and forecast 2023-2028 ($ million)
      • Exhibit 96: Data Table on Europe - Market size and forecast 2023-2028 ($ million)
      • Exhibit 97: Chart on Europe - Year-over-year growth 2023-2028 (%)
      • Exhibit 98: Data Table on Europe - Year-over-year growth 2023-2028 (%)
    • 9.6 Middle East and Africa - Market size and forecast 2023-2028
      • Exhibit 99: Chart on Middle East and Africa - Market size and forecast 2023-2028 ($ million)
      • Exhibit 100: Data Table on Middle East and Africa - Market size and forecast 2023-2028 ($ million)
      • Exhibit 101: Chart on Middle East and Africa - Year-over-year growth 2023-2028 (%)
      • Exhibit 102: Data Table on Middle East and Africa - Year-over-year growth 2023-2028 (%)
    • 9.7 South America - Market size and forecast 2023-2028
      • Exhibit 103: Chart on South America - Market size and forecast 2023-2028 ($ million)
      • Exhibit 104: Data Table on South America - Market size and forecast 2023-2028 ($ million)
      • Exhibit 105: Chart on South America - Year-over-year growth 2023-2028 (%)
      • Exhibit 106: Data Table on South America - Year-over-year growth 2023-2028 (%)
    • 9.8 China - Market size and forecast 2023-2028
      • Exhibit 107: Chart on China - Market size and forecast 2023-2028 ($ million)
      • Exhibit 108: Data Table on China - Market size and forecast 2023-2028 ($ million)
      • Exhibit 109: Chart on China - Year-over-year growth 2023-2028 (%)
      • Exhibit 110: Data Table on China - Year-over-year growth 2023-2028 (%)
    • 9.9 US - Market size and forecast 2023-2028
      • Exhibit 111: Chart on US - Market size and forecast 2023-2028 ($ million)
      • Exhibit 112: Data Table on US - Market size and forecast 2023-2028 ($ million)
      • Exhibit 113: Chart on US - Year-over-year growth 2023-2028 (%)
      • Exhibit 114: Data Table on US - Year-over-year growth 2023-2028 (%)
    • 9.10 Germany - Market size and forecast 2023-2028
      • Exhibit 115: Chart on Germany - Market size and forecast 2023-2028 ($ million)
      • Exhibit 116: Data Table on Germany - Market size and forecast 2023-2028 ($ million)
      • Exhibit 117: Chart on Germany - Year-over-year growth 2023-2028 (%)
      • Exhibit 118: Data Table on Germany - Year-over-year growth 2023-2028 (%)
    • 9.11 United Arab Emirates - Market size and forecast 2023-2028
      • Exhibit 119: Chart on United Arab Emirates - Market size and forecast 2023-2028 ($ million)
      • Exhibit 120: Data Table on United Arab Emirates - Market size and forecast 2023-2028 ($ million)
      • Exhibit 121: Chart on United Arab Emirates - Year-over-year growth 2023-2028 (%)
      • Exhibit 122: Data Table on United Arab Emirates - Year-over-year growth 2023-2028 (%)
    • 9.12 India - Market size and forecast 2023-2028
      • Exhibit 123: Chart on India - Market size and forecast 2023-2028 ($ million)
      • Exhibit 124: Data Table on India - Market size and forecast 2023-2028 ($ million)
      • Exhibit 125: Chart on India - Year-over-year growth 2023-2028 (%)
      • Exhibit 126: Data Table on India - Year-over-year growth 2023-2028 (%)
    • 9.13 Market opportunity by geography
      • Exhibit 127: Market opportunity by geography ($ million)
      • Exhibit 128: Data Tables on Market opportunity by geography ($ million)

    10 Drivers, Challenges, and Trends

    • 10.1 Market drivers
      • 10.2 Market challenges
        • 10.3 Impact of drivers and challenges
          • Exhibit 129: Impact of drivers and challenges in 2023 and 2028
        • 10.4 Market trends

          11 Vendor Landscape

          • 11.1 Overview
            • 11.2 Vendor landscape
              • Exhibit 130: Overview on Criticality of inputs and Factors of differentiation
            • 11.3 Landscape disruption
              • Exhibit 131: Overview on factors of disruption
            • 11.4 Industry risks
              • Exhibit 132: Impact of key risks on business

            12 Vendor Analysis

            • 12.1 Vendors covered
              • Exhibit 133: Vendors covered
            • 12.2 Market positioning of vendors
              • Exhibit 134: Matrix on vendor position and classification
            • 12.3 AGROFERT AS
              • Exhibit 135: AGROFERT AS - Overview
              • Exhibit 136: AGROFERT AS - Product / Service
              • Exhibit 137: AGROFERT AS - Key offerings
            • 12.4 Arham Petrochem Pvt. Ltd.
              • Exhibit 138: Arham Petrochem Pvt. Ltd. - Overview
              • Exhibit 139: Arham Petrochem Pvt. Ltd. - Product / Service
              • Exhibit 140: Arham Petrochem Pvt. Ltd. - Key offerings
            • 12.5 Chevron Phillips Chemical Co. LLC
              • Exhibit 141: Chevron Phillips Chemical Co. LLC - Overview
              • Exhibit 142: Chevron Phillips Chemical Co. LLC - Product / Service
              • Exhibit 143: Chevron Phillips Chemical Co. LLC - Key news
              • Exhibit 144: Chevron Phillips Chemical Co. LLC - Key offerings
            • 12.6 Compania Espanola de Petroleos SA
              • Exhibit 145: Compania Espanola de Petroleos SA - Overview
              • Exhibit 146: Compania Espanola de Petroleos SA - Business segments
              • Exhibit 147: Compania Espanola de Petroleos SA - Key offerings
              • Exhibit 148: Compania Espanola de Petroleos SA - Segment focus
            • 12.7 Exxon Mobil Corp.
              • Exhibit 149: Exxon Mobil Corp. - Overview
              • Exhibit 150: Exxon Mobil Corp. - Business segments
              • Exhibit 151: Exxon Mobil Corp. - Key offerings
              • Exhibit 152: Exxon Mobil Corp. - Segment focus
            • 12.8 Honeywell International Inc.
              • Exhibit 153: Honeywell International Inc. - Overview
              • Exhibit 154: Honeywell International Inc. - Business segments
              • Exhibit 155: Honeywell International Inc. - Key news
              • Exhibit 156: Honeywell International Inc. - Key offerings
              • Exhibit 157: Honeywell International Inc. - Segment focus
            • 12.9 Korea Petrochemical Ind. Co. Ltd.
              • Exhibit 158: Korea Petrochemical Ind. Co. Ltd. - Overview
              • Exhibit 159: Korea Petrochemical Ind. Co. Ltd. - Product / Service
              • Exhibit 160: Korea Petrochemical Ind. Co. Ltd. - Key offerings
            • 12.10 ORG CHEM GROUP
              • Exhibit 161: ORG CHEM GROUP - Overview
              • Exhibit 162: ORG CHEM GROUP - Product / Service
              • Exhibit 163: ORG CHEM GROUP - Key offerings
            • 12.11 Pampa Energia SA
              • Exhibit 164: Pampa Energia SA - Overview
              • Exhibit 165: Pampa Energia SA - Business segments
              • Exhibit 166: Pampa Energia SA - Key offerings
              • Exhibit 167: Pampa Energia SA - Segment focus
            • 12.12 RB Products Inc.
              • Exhibit 168: RB Products Inc. - Overview
              • Exhibit 169: RB Products Inc. - Product / Service
              • Exhibit 170: RB Products Inc. - Key offerings
            • 12.13 Reliance Industries Ltd.
              • Exhibit 171: Reliance Industries Ltd. - Overview
              • Exhibit 172: Reliance Industries Ltd. - Business segments
              • Exhibit 173: Reliance Industries Ltd. - Key news
              • Exhibit 174: Reliance Industries Ltd. - Key offerings
              • Exhibit 175: Reliance Industries Ltd. - Segment focus
            • 12.14 Saudi Arabian Oil Co.
              • Exhibit 176: Saudi Arabian Oil Co. - Overview
              • Exhibit 177: Saudi Arabian Oil Co. - Product / Service
              • Exhibit 178: Saudi Arabian Oil Co. - Key offerings
            • 12.15 Shell plc
              • Exhibit 179: Shell plc - Overview
              • Exhibit 180: Shell plc - Business segments
              • Exhibit 181: Shell plc - Key news
              • Exhibit 182: Shell plc - Key offerings
              • Exhibit 183: Shell plc - Segment focus
            • 12.16 SK Innovation Co. Ltd.
              • Exhibit 184: SK Innovation Co. Ltd. - Overview
              • Exhibit 185: SK Innovation Co. Ltd. - Business segments
              • Exhibit 186: SK Innovation Co. Ltd. - Key offerings
              • Exhibit 187: SK Innovation Co. Ltd. - Segment focus
            • 12.17 Vinati Organics Ltd.
              • Exhibit 188: Vinati Organics Ltd. - Overview
              • Exhibit 189: Vinati Organics Ltd. - Business segments
              • Exhibit 190: Vinati Organics Ltd. - Key offerings
              • Exhibit 191: Vinati Organics Ltd. - Segment focus

            13 Appendix

            • 13.1 Scope of the report
              • 13.2 Inclusions and exclusions checklist
                • Exhibit 192: Inclusions checklist
                • Exhibit 193: Exclusions checklist
              • 13.3 Currency conversion rates for US$
                • Exhibit 194: Currency conversion rates for US$
              • 13.4 Research methodology
                • Exhibit 195: Research methodology
                • Exhibit 196: Validation techniques employed for market sizing
                • Exhibit 197: Information sources
              • 13.5 List of abbreviations
                • Exhibit 198: List of abbreviations

              Research Methodology

              Technavio presents a detailed picture of the market by way of study, synthesis, and summation of data from multiple sources. The analysts have presented the various facets of the market with a particular focus on identifying the key industry influencers. The data thus presented is comprehensive, reliable, and the result of extensive research, both primary and secondary.

              INFORMATION SOURCES

              Primary sources

              • Manufacturers and suppliers
              • Channel partners
              • Industry experts
              • Strategic decision makers

              Secondary sources

              • Industry journals and periodicals
              • Government data
              • Financial reports of key industry players
              • Historical data
              • Press releases

              DATA ANALYSIS

              Data Synthesis

              • Collation of data
              • Estimation of key figures
              • Analysis of derived insights

              Data Validation

              • Triangulation with data models
              • Reference against proprietary databases
              • Corroboration with industry experts

              REPORT WRITING

              Qualitative

              • Market drivers
              • Market challenges
              • Market trends
              • Five forces analysis

              Quantitative

              • Market size and forecast
              • Market segmentation
              • Geographical insights
              • Competitive landscape

              Interested in this report?

              Get your sample now to see our research methodology and insights!

              Download Now

              Frequently Asked Questions

              Aromatic Solvents market growth will increase by $ 1271.13 mn during 2024-2028 .

              The Aromatic Solvents market is expected to grow at a CAGR of 3.54% during 2024-2028 .

              Aromatic Solvents market is segmented by End-user( Paints and coatings, Automotive, Pharmaceuticals, Oilfield chemicals, Others) Type( Toluene, Xylene, Ethylbenzene, Benzene, Others)

              AGROFERT AS, Arham Petrochem Pvt. Ltd., BASF SE, Chevron Phillips Chemical Co. LLC, Compania Espanola de Petroleos SA, Eastman Chemical Co., Exxon Mobil Corp., HCS Group GmbH, Honeywell International Inc., Korea Petrochemical Ind. Co. Ltd., Monument Chemical, Neste Corp., ORG CHEM GROUP, Pampa Energia SA, RB Products Inc., Reliance Industries Ltd., Resolute Oil LLC, Saudi Arabian Oil Co., Shell plc, Shri Parth Petrochem, SK Innovation Co. Ltd., Vinati Organics Ltd. are a few of the key vendors in the Aromatic Solvents market.

              APAC will register the highest growth rate of 50% among the other regions. Therefore, the Aromatic Solvents market in APAC is expected to garner significant business opportunities for the vendors during the forecast period.

              US, United Arab Emirates, China, India, Germany

              • Rise in building and construction activitiesThe rise in building and construction activities is indeed a significant driver for the growth of the global aromatic solvents market. With increasing urbanization and infrastructure development projects worldwide is the driving factor this market.
              • the construction industry's demand for paints is the driving factor this market.
              • coatings is the driving factor this market.
              • adhesives is the driving factor this market.
              • and sealants has surged. Aromatic solvents are vital components in the formulation of these construction materials is the driving factor this market.
              • contributing to their durability is the driving factor this market.
              • weather resistance is the driving factor this market.
              • and overall performance. For instance is the driving factor this market.
              • major construction projects such as the development of skyscrapers is the driving factor this market.
              • commercial complexes is the driving factor this market.
              • and residential buildings in rapidly growing urban centers is the driving factor this market.
              • including Dubai is the driving factor this market.
              • Shanghai is the driving factor this market.
              • and New York City is the driving factor this market.
              • have propelled the demand for aromatic solvents. These solvents are essential for producing high-quality architectural coatings and adhesives is the driving factor this market.
              • meeting the stringent requirements for modern construction designs and standards. The renovation and restoration of historical landmarks and infrastructure projects further drive the demand for aromatic solvents. For example is the driving factor this market.
              • the restoration of iconic structures such as the Colosseum in Rome is the driving factor this market.
              • the Taj Mahal in India is the driving factor this market.
              • and the Louvre Museum in Paris involves the use of specialized coatings and adhesives formulated with aromatic solvents. Additionally is the driving factor this market.
              • the expansion of transportation infrastructure is the driving factor this market.
              • including highways is the driving factor this market.
              • bridges is the driving factor this market.
              • and railways is the driving factor this market.
              • requires protective coatings and sealants that rely on aromatic solvents for their performance characteristics. As construction activities continue to rise globally is the driving factor this market.
              • particularly in emerging economies such as China is the driving factor this market.
              • India is the driving factor this market.
              • and Brazil is the driving factor this market.
              • the demand for aromatic solvents is expected to remain strong is the driving factor this market.
              • thereby driving the growth of the global aromatic solvents market during the forecast period. is the driving factor this market.

              The Aromatic Solvents market vendors should focus on grabbing business opportunities from the Paints and coatings segment as it accounted for the largest market share in the base year.