Artificial Intelligence (AI) In Food And Beverage Industry Market Size 2026-2030
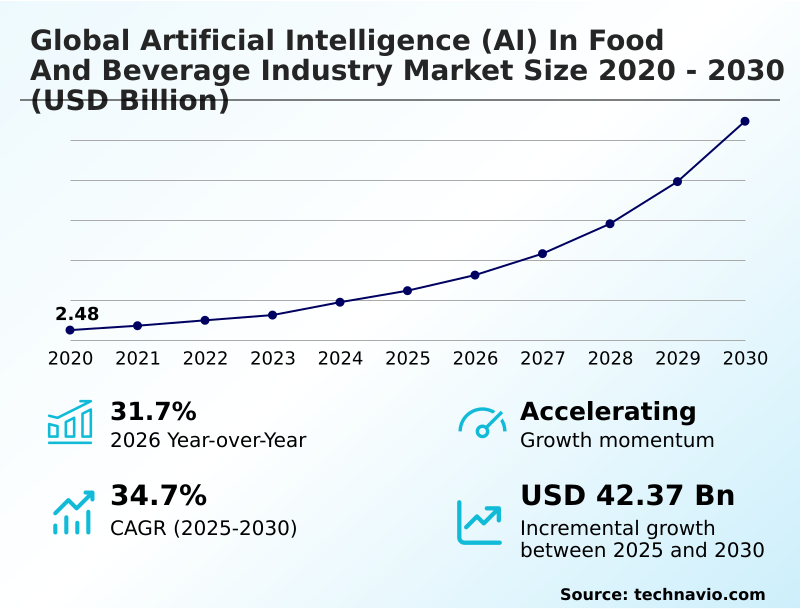
The artificial intelligence (ai) in food and beverage industry market size is valued to increase by USD 42.37 billion, at a CAGR of 34.7% from 2025 to 2030. Increasing demand for supply chain optimization and efficiency will drive the artificial intelligence (ai) in food and beverage industry market.
Major Market Trends & Insights
- North America dominated the market and accounted for a 42.6% growth during the forecast period.
- By Type - Transportation and logistics segment was valued at USD 3.24 billion in 2024
- By End-user - Food processing industry segment accounted for the largest market revenue share in 2024
Market Size & Forecast
- Market Opportunities: USD 52.22 billion
- Market Future Opportunities: USD 42.37 billion
- CAGR from 2025 to 2030 : 34.7%
Market Summary
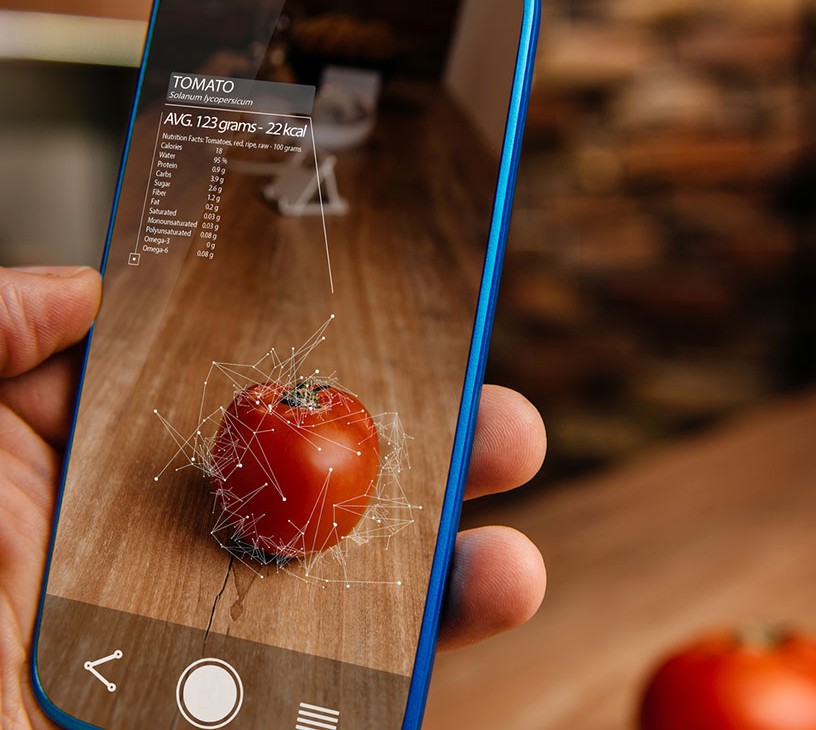
- The artificial intelligence (AI) in food and beverage industry market is undergoing a significant transformation, driven by the need for greater operational efficiency and product innovation. The integration of machine learning models and computer vision systems is enabling advancements in food safety quality control, with automated inspection processes becoming standard.
- A key trend is the use of generative AI flavor development, which allows for rapid research cycle acceleration and better consumer demand alignment. For instance, a beverage company can use a culinary AI model to simulate thousands of flavor combinations, significantly reducing development time and costs.
- Drivers include the push for supply chain optimization and AI-powered sustainability, supported by cloud computing infrastructure. However, challenges such as high implementation costs and the need for specialized talent to manage predictive analytics platforms persist.
- The deployment of robotic process automation and predictive maintenance platforms is helping to streamline operations and reduce downtime, ultimately fostering a more resilient and data-driven industry. The focus on personalized nutrition solutions and recipe formulation customization is also a major factor, with natural language processing tools analyzing consumer feedback to guide food product innovation.
What will be the Size of the Artificial Intelligence (AI) In Food And Beverage Industry Market during the forecast period?
Get Key Insights on Market Forecast (PDF) Get Free Sample
How is the Artificial Intelligence (AI) In Food And Beverage Industry Market Segmented?
The artificial intelligence (ai) in food and beverage industry industry research report provides comprehensive data (region-wise segment analysis), with forecasts and estimates in "USD million" for the period 2026-2030, as well as historical data from 2020-2024 for the following segments.
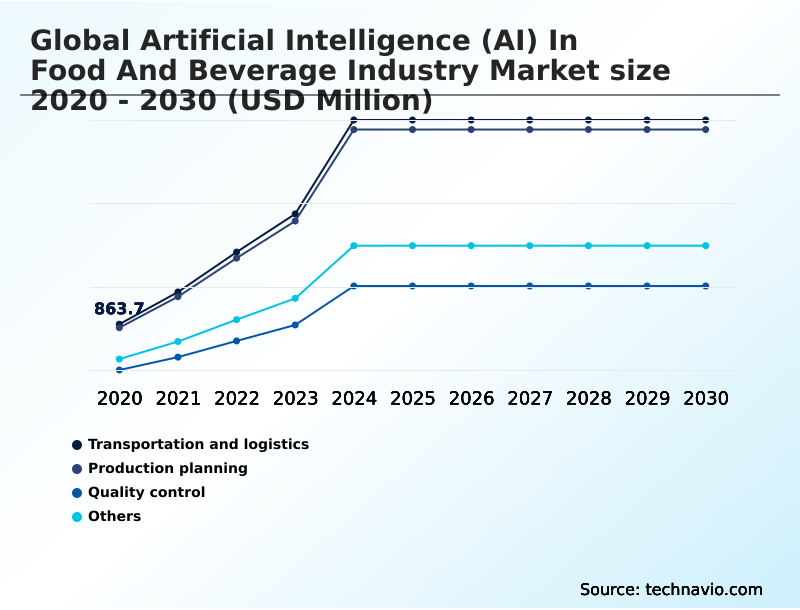
- Type
- Transportation and logistics
- Production planning
- Quality control
- Others
- End-user
- Food processing industry
- Hotels and restaurants
- Beverage industry
- Deployment
- Cloud
- On-premises
- Geography
- North America
- US
- Canada
- Mexico
- Europe
- Germany
- UK
- France
- APAC
- China
- Japan
- India
- South America
- Brazil
- Argentina
- Middle East and Africa
- Saudi Arabia
- UAE
- South Africa
- Rest of World (ROW)
- North America
By Type Insights
The transportation and logistics segment is estimated to witness significant growth during the forecast period.
The transportation and logistics segment is pivotal, with companies leveraging machine learning models for supply chain optimization. The use of automated logistics solutions and autonomous delivery vehicles is reshaping distribution networks to achieve greater labor efficiency improvement.
Through real-time data tracking, firms gain unprecedented supply chain transparency, allowing for dynamic route adjustments and better inventory level optimization. These digital transformation initiatives help mitigate cocoa supply challenges and other disruptions.
Deploying AI agent copilot solutions has led to a 15% reduction in fuel consumption for some fleets.
This integration of customer relationship management analytics and cloud computing infrastructure supports global sourcing resilience and ensures timely delivery in a complex global market, addressing key export demand forecasting needs.
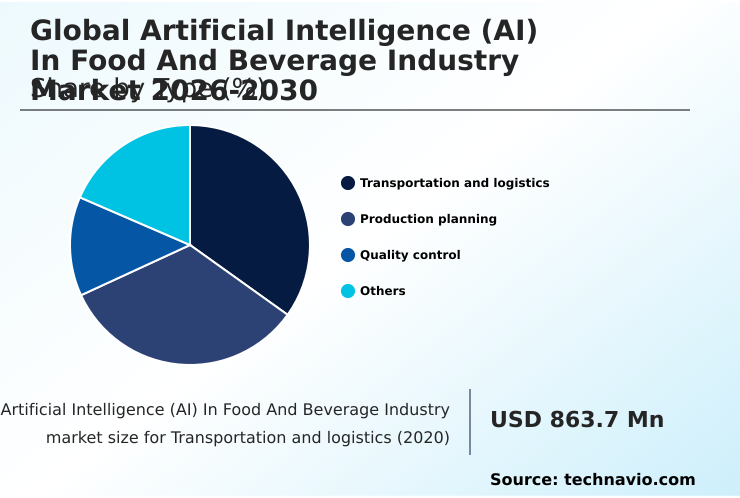
The Transportation and logistics segment was valued at USD 3.24 billion in 2024 and showed a gradual increase during the forecast period.
Regional Analysis
North America is estimated to contribute 42.6% to the growth of the global market during the forecast period.Technavio’s analysts have elaborately explained the regional trends and drivers that shape the market during the forecast period.
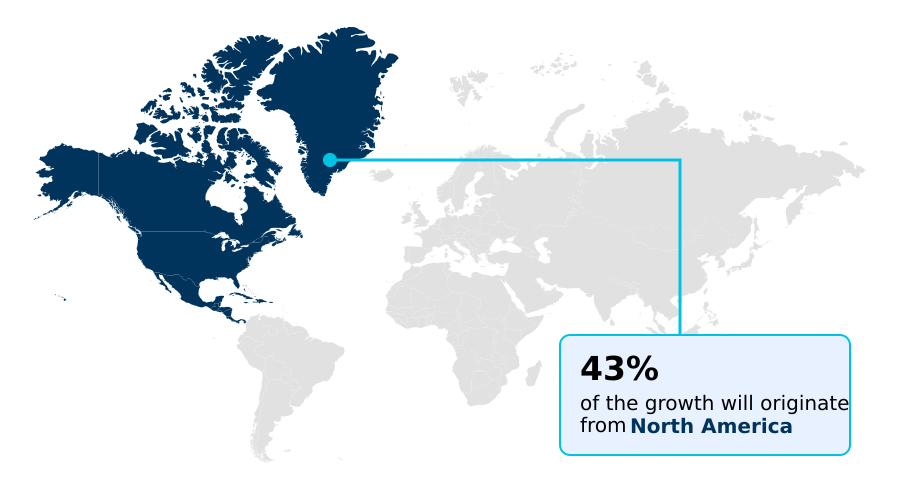
See How Artificial Intelligence (AI) In Food And Beverage Industry Market Demand is Rising in North America Get Free Sample
The market landscape is characterized by varied regional adoption rates, with North America accounting for over 42% of the incremental growth, driven by investments in AI-powered robot technology.
In this region, AI-powered meal glucose prediction tools and platforms for online ordering management are gaining traction, improving last-mile delivery operations. In contrast, APAC is the fastest-growing region, with a strong focus on food waste reduction and post-harvest sorting optimization.
European firms emphasize AI-powered sustainability and precision resource management, with deployments showing a 15% reduction in water usage.
The application of generative AI assistant technologies and digital formulation tools is becoming widespread, supporting industrial food production and enhancing crop management analytics globally.
Market Dynamics
Our researchers analyzed the data with 2025 as the base year, along with the key drivers, trends, and challenges. A holistic analysis of drivers will help companies refine their marketing strategies to gain a competitive advantage.
- The long-term trajectory of the global artificial intelligence (AI) in food and beverage industry market 2026-2030 is shaped by its capacity to address core operational imperatives through targeted applications.
- For instance, the use of global artificial intelligence (AI) in food and beverage industry market 2026-2030 computer vision for quality control is becoming foundational, moving beyond simple defect detection to nuanced grading and consistency checks.
- Similarly, global artificial intelligence (AI) in food and beverage industry market 2026-2030 predictive analytics for demand forecasting is crucial for minimizing waste and optimizing inventory across complex supply chains.
- Investment in global artificial intelligence (AI) in food and beverage industry market 2026-2030 machine learning for predictive maintenance is delivering tangible ROI, with some plants reporting uptime improvements that are twice that of facilities relying on traditional maintenance schedules.
- The creative potential of global artificial intelligence (AI) in food and beverage industry market 2026-2030 generative AI in new product development is unlocking novel flavor profiles and accelerating time-to-market.
- Core functions like global artificial intelligence (AI) in food and beverage industry market 2026-2030 for supply chain optimization and global artificial intelligence (AI) in food and beverage industry market 2026-2030 for automating production planning are achieving new levels of efficiency.
- As the industry matures, focus is expanding to include global artificial intelligence (AI) in food and beverage industry market 2026-2030 for personalized nutrition platforms and global artificial intelligence (AI) in food and beverage industry market 2026-2030 and robotics in food packaging.
- Addressing global artificial intelligence (AI) in food and beverage industry market 2026-2030 data privacy and cybersecurity measures and the global artificial intelligence (AI) in food and beverage industry market 2026-2030 addressing the food tech skills gap will be critical for sustained adoption and success.
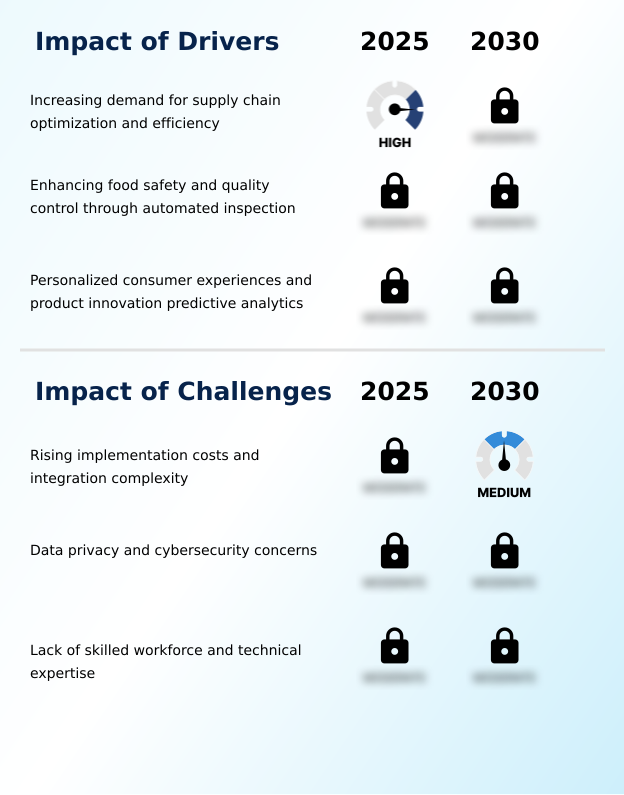
What are the key market drivers leading to the rise in the adoption of Artificial Intelligence (AI) In Food And Beverage Industry Industry?
- The increasing demand for enhanced supply chain optimization and operational efficiency serves as a key market driver.
- The drive for manufacturing process efficiency and operational workflow efficiency is a primary catalyst for market adoption. Integration of AI-enhanced automation platforms and 3D vision guided robotics has enabled a 30% improvement in production accuracy.
- Furthermore, enhancing food safety quality control through automated inspection and bacterial concentration detection is critical. Deployments of AI-powered vision system technology have correlated with a 50% drop in product recall risk mitigation.
- The need for predictive quality sensing also propels investment in natural language processing tools and IIoT driven platform solutions, which provide analytics for process control adjustments and predictive maintenance scheduling, reducing equipment downtime by over 20%.
What are the market trends shaping the Artificial Intelligence (AI) In Food And Beverage Industry Industry?
- Generative AI is an emerging trend, driving flavor development and accelerating product innovation cycles across the industry.
- The market is witnessing a profound shift toward generative AI flavor development and AI-enhanced sensory analysis, enabling research cycle acceleration and more precise consumer demand alignment. Companies are utilizing culinary AI model platforms, which have demonstrated the ability to reduce new product formulation times by up to 40%.
- Concurrently, real-time quality assurance is being achieved through advanced computer vision and hyperspectral imaging analysis, leading to a 25% decrease in inspection-related errors. This focus on food product innovation and recipe formulation customization is supported by AI-powered sustainability initiatives. These tools drive environmental impact reduction and facilitate plant-based alternative formulation, with early adopters reporting a 12% improvement in resource efficiency.
What challenges does the Artificial Intelligence (AI) In Food And Beverage Industry Industry face during its growth?
- Rising implementation costs and the complexities of system integration present a key challenge affecting industry growth.
- Despite clear benefits, high implementation costs and the complexity of integrating predictive analytics platforms with legacy systems remain significant barriers. Organizations report that initial outlays for AI-driven software suite and hardware upgrades can increase project budgets by up to 60%.
- A shortage of skilled personnel capable of managing self-learning manufacturing processes and data-driven distillation techniques also constrains growth, with some firms experiencing project delays of 18-24 months due to talent gaps. Moreover, ensuring data privacy and robust cybersecurity for interconnected systems is paramount.
- The lack of standardized protocols for enterprise resource planning integration and supply chain management software often leads to custom development, which is 35% more expensive than off-the-shelf solutions.
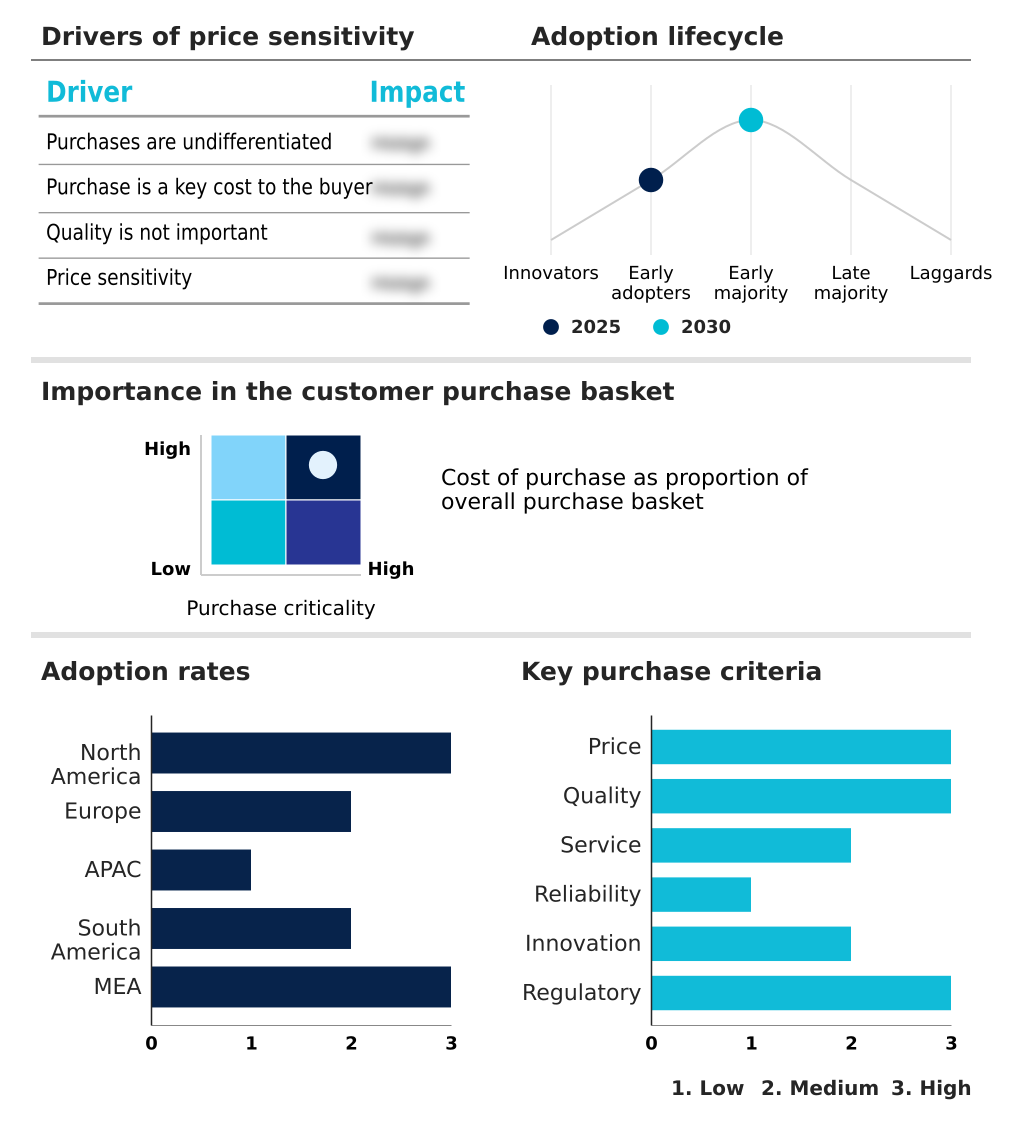
Exclusive Technavio Analysis on Customer Landscape
The artificial intelligence (ai) in food and beverage industry market forecasting report includes the adoption lifecycle of the market, covering from the innovator’s stage to the laggard’s stage. It focuses on adoption rates in different regions based on penetration. Furthermore, the artificial intelligence (ai) in food and beverage industry market report also includes key purchase criteria and drivers of price sensitivity to help companies evaluate and develop their market growth analysis strategies.
Customer Landscape of Artificial Intelligence (AI) In Food And Beverage Industry Industry
Competitive Landscape
Companies are implementing various strategies, such as strategic alliances, artificial intelligence (ai) in food and beverage industry market forecast, partnerships, mergers and acquisitions, geographical expansion, and product/service launches, to enhance their presence in the industry.
ABB Ltd. - Enhanced automation and 3D vision-guided robotics are offered to improve production accuracy, efficiency, and safety in food and beverage operations.
The industry research and growth report includes detailed analyses of the competitive landscape of the market and information about key companies, including:
- ABB Ltd.
- Amazon.com Inc.
- AS Cimbria
- Augury Inc.
- Honeywell International Inc.
- IBM Corp.
- Imago AI
- Keyence Corp.
- Landing AI
- Microsoft Corp.
- Quantis
- Rockwell Automation Inc.
- Schneider Electric SE
- Sesotec GmbH
- Siemens AG
- Sight Machine
- Tomra Systems ASA
Qualitative and quantitative analysis of companies has been conducted to help clients understand the wider business environment as well as the strengths and weaknesses of key industry players. Data is qualitatively analyzed to categorize companies as pure play, category-focused, industry-focused, and diversified; it is quantitatively analyzed to categorize companies as dominant, leading, strong, tentative, and weak.
Recent Development and News in Artificial intelligence (ai) in food and beverage industry market
- In August, 2024, Danone partnered with Microsoft to implement AI for enhancing efficiency across its worldwide operations, with a focus on streamlining supply chain and production workflows.
- In October, 2024, Kellanova launched a comprehensive internal training program to provide its workforce with the technical skills required to operate and manage advanced AI systems within its manufacturing facilities.
- In February, 2025, Moa Foodtech secured USD 1.48 million in a funding round to progress the development of its AI-driven platform for creating innovative and sustainable food ingredients via fermentation.
- In April, 2025, NotCo introduced its Concept Quant business-to-business portal, which utilizes proprietary AI technology to help food companies accelerate their product formulation and development processes for plant-based foods.
Dive into Technavio’s robust research methodology, blending expert interviews, extensive data synthesis, and validated models for unparalleled Artificial Intelligence (AI) In Food And Beverage Industry Market insights. See full methodology.
| Market Scope | |
|---|---|
| Page number | 305 |
| Base year | 2025 |
| Historic period | 2020-2024 |
| Forecast period | 2026-2030 |
| Growth momentum & CAGR | Accelerate at a CAGR of 34.7% |
| Market growth 2026-2030 | USD 42367.5 million |
| Market structure | Fragmented |
| YoY growth 2025-2026(%) | 31.7% |
| Key countries | US, Canada, Mexico, Germany, UK, France, Italy, Spain, The Netherlands, China, Japan, India, South Korea, Australia, Indonesia, Brazil, Argentina, Chile, Saudi Arabia, UAE, South Africa, Israel and Turkey |
| Competitive landscape | Leading Companies, Market Positioning of Companies, Competitive Strategies, and Industry Risks |
Research Analyst Overview
- The market is evolving from siloed applications to integrated, end-to-end ecosystems driven by digital transformation initiatives. The deployment of AI-powered vision system technology and IIoT driven platform solutions is no longer a niche advantage but a competitive necessity.
- Boardroom decisions are increasingly centered on leveraging predictive analytics platforms to achieve AI-powered sustainability goals, with companies using machine learning models to reduce their carbon footprint. For example, some processors have achieved a 20% reduction in energy consumption by optimizing production schedules with demand forecasting models.
- The use of advanced computer vision and 3D vision guided robotics enhances real-time quality assurance, while generative AI flavor development and AI-enhanced sensory analysis are revolutionizing R&D. The integration of AI agent copilot solutions with enterprise resource planning integration is streamlining workflows, from supply chain optimization to customer relationship management analytics, defining a new paradigm for operational excellence.
What are the Key Data Covered in this Artificial Intelligence (AI) In Food And Beverage Industry Market Research and Growth Report?
-
What is the expected growth of the Artificial Intelligence (AI) In Food And Beverage Industry Market between 2026 and 2030?
-
USD 42.37 billion, at a CAGR of 34.7%
-
-
What segmentation does the market report cover?
-
The report is segmented by Type (Transportation and logistics, Production planning, Quality control, and Others), End-user (Food processing industry, Hotels and restaurants, and Beverage industry), Deployment (Cloud, and On-premises) and Geography (North America, Europe, APAC, South America, Middle East and Africa)
-
-
Which regions are analyzed in the report?
-
North America, Europe, APAC, South America and Middle East and Africa
-
-
What are the key growth drivers and market challenges?
-
Increasing demand for supply chain optimization and efficiency, Rising implementation costs and integration complexity
-
-
Who are the major players in the Artificial Intelligence (AI) In Food And Beverage Industry Market?
-
ABB Ltd., Amazon.com Inc., AS Cimbria, Augury Inc., Honeywell International Inc., IBM Corp., Imago AI, Keyence Corp., Landing AI, Microsoft Corp., Quantis, Rockwell Automation Inc., Schneider Electric SE, Sesotec GmbH, Siemens AG, Sight Machine and Tomra Systems ASA
-
Market Research Insights
- The market is defined by dynamic shifts toward data-driven operations and food waste reduction. The adoption of tools for predictive inventory control has enabled some retailers to decrease spoilage by up to 25%. A strong focus on supply chain transparency is compelling firms to invest in platforms that improve global sourcing resilience and traceability.
- This has resulted in a 15% improvement in compliance with international food safety standards. Furthermore, the push for personalized nutrition solutions and plant-based alternative formulation is reshaping product development, with analytics-driven approaches achieving a 30% faster time-to-market for new items.
- The use of systems for milk composition consistency and bacterial concentration detection highlights the industry's commitment to quality and safety through technological integration.
We can help! Our analysts can customize this artificial intelligence (ai) in food and beverage industry market research report to meet your requirements.
 RIA -
RIA - 
