
Breakfast Cereals Market Size 2024-2028
The breakfast cereals market size is estimated to increase by USD 4.10 billion and grow at a CAGR of 3.2% between 2023 and 2028.
- The global breakfast cereals market is growing steadily, driven by increasing demand for convenient, nutritious breakfast options such as ready-to-eat (RTE) breakfast cereals and advancements in product innovation. Key factors include a shift in consumer preferences toward healthier choices like whole-grain and high-fiber cereals as well as yogurt, spurred by greater health awareness, and the expansion of e-commerce, which enhances accessibility and brand reach.
- This report provides a detailed analysis for business leaders, covering market size, growth projections through 2028, and key segments like ready-to-eat cereals, which dominate due to their convenience and widespread appeal. It explores trends such as the rising popularity of organic and plant-based options, reflecting dietary shifts, and addresses challenges like fluctuating raw material costs, which can impact pricing and supply stability. The insights are designed for practical use in strategy, product development, and market expansion.
- For companies aiming to stay competitive in the global breakfast cereals market, this report offers clear, data-driven guidance on leveraging health trends and overcoming economic pressures, ensuring they can adapt to a dynamic, consumer-focused industry.
What will be the size of the Breakfast Cereals Market During the Forecast Period?

To learn more about this market report, Download Report Sample
Market Segmentation
The market research report provides comprehensive data (region wise segment analysis), with forecasts and estimates in "USD Billion" for the period 2024 to 2028, as well as historical data from 2018 to 2022 for the following segments.
- Distribution Channel Outlook
- Supermarkets and hypermarkets
- Independent retailers
- Convenience stores
- Others
- Product Type Outlook
- Ready-to-eat cereals
- Hot cereals
- Region Outlook
- North America
- U.S.
- Canada
- Europe
- The U.K.
- Germany
- France
- Rest of Europe
- APAC
- China
- India
- Middle East & Africa
- Saudi Arabia
- South Africa
- Rest of the Middle East & Africa
- South America
- Chile
- Brazil
- Argentina
- North America
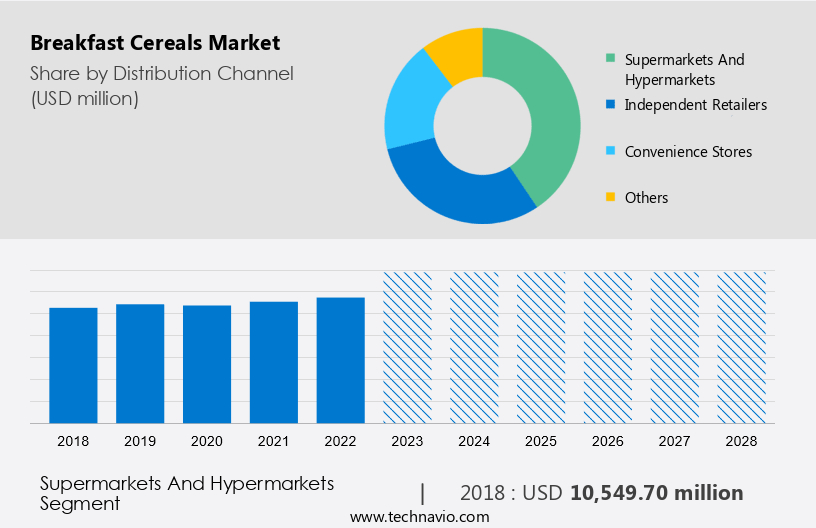
By Distribution Channel
The market share growth by the supermarket and hypermarket segment will be significant during the forecast period. Two of the key distribution channels in the organized retailing sector of breakfast cereals are supermarkets, hypermarkets and convenience stores, which make purchasing easier for customers. The global expansion of supermarkets and hypermarkets is one of the key factors anticipated to propel the segment's growth.
Get a glance at the market contribution of various segments. Request PDF Sample
The supermarkets and hypermarkets segment was valued at USD 10.54 billion in 2018. In supermarkets and hypermarkets, customers can select from a variety of goods based on factors like cost and quality. For those who favor the conventional method of shopping, these stores are convenient. It is also anticipated that the segment will grow as supermarkets and hypermarkets become more prevalent in developing nations. Moreover, consumer purchasing preferences are shifting to supermarkets and hypermarkets as a result of rising disposable incomes and rapid urbanization. Furthermore, innovative and attractive displays in offline points of sale have been made possible by new product launches and an increase in marketing and promotional spending by vendors. Therefore, such factors are anticipated to drive the growth of the supermarket and hypermarket segment in the global market during the forecast period.
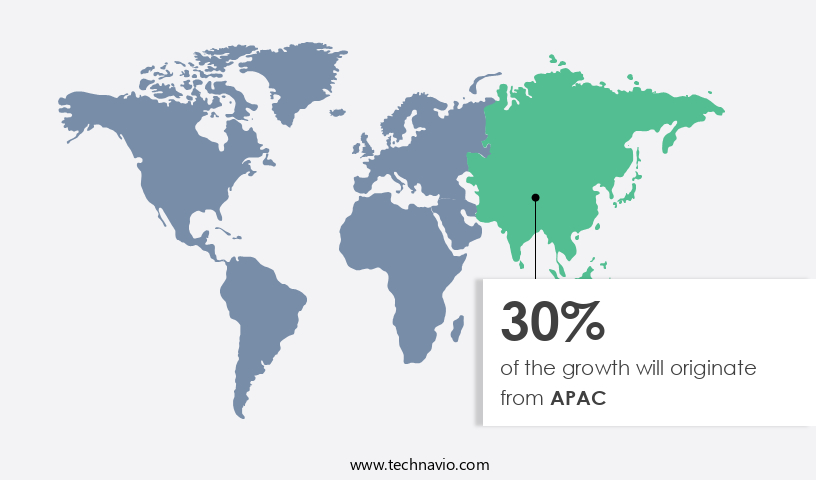
Key Region
For more insights on the market share of various regions, Request PDF Sample now!
North America is estimated to contribute 30% to the growth of the global market during the forecast period. Technavio's analysts have elaborately explained the regional trends and drivers that shape the market during the forecast period. In North America, breakfast cereal consumption is high. Hot breakfast cereals, in particular, are frequently consumed due to their nutritional advantages over ready-to-eat breakfast cereals. Moreover, the fact that North American consumers have begun to view them as a snack is another motivating factor behind the market growth in the region. As consumers start skipping lunch or eating between meals, this trend is expected to grow during the forecast period.
Furthermore, the market for kids' organic breakfast cereals and breakfast food is primarily in North America. Organic cereals are also very popular with young consumers. The market share of manufacturers who adapt their product offerings to consumer preferences is likely to increase. Children and teenagers are typically the target audience for marketing. Furthermore, health issues arise as a result of changing lifestyles and rising obesity rates. Thus, as consumers become more aware of the link between obesity and heart disease, they start looking for healthier options. All these factors will influence the demand for healthy and organic breakfast cereals, which in turn, will boost the market growth during the forecast period.
Market Dynamics
The breakfast cereals market is evolving with a wide range of options that cater to both convenience and nutrition. Crunchy morning bites and nutrient-dense flakes provide a satisfying start to the day, while quick-serve bowls and instant cereal packs offer busy consumers a fast breakfast solution. Whole grain mixes and organic grain clusters ensure a healthy, fiber-rich option, and high-fiber options are becoming more popular for those seeking digestive benefits.
For kids, cereal brands are introducing fun, kid-approved shapes and protein-packed cereals that are both tasty and nutritious. Fruit-infused bites and energy-boosting flakes add natural flavor blends, offering a burst of freshness with every bite. Low-carb recipes and gluten-free mixes are meeting the growing demand for specialty diets, while dairy-free pairings provide inclusive choices.
Hot cereal blends, portable breakfast cups, and multigrain snack bars are becoming go-to options for people on the move. Wholesome oat blends and ancient grain mixes are gaining popularity among health-conscious consumers, and fortified breakfast bites are providing added nutrients. Cold cereal combos and natural sweetener flakes cater to those looking for a lighter, more balanced start to the day. The market continues to innovate with convenient meal starters, ensuring there's something for everyone at breakfast time.
Key Market Driver
The increasing product launches are notably driving market growth. With numerous domestic and international vendors competing in the market, the global market is fragmented. To draw in more customers and improve their visibility in the market, these vendors are providing a range of breakfast cereal products, supported by a number of new product launches and expansions. The growth of the global market is anticipated to be fueled by the rising number of new product launches and the expansion of existing ones by numerous manufacturers around the world during the forecast period.
Some of the prominent new product launches include the announcement by General Mills Inc. in 2021 about the new products that would be joining its RTE breakfast cereal lineup. These products include CinnaGraham Toast Crunch, Reese Puffs Cluster Crunch, Strawberry Banana Cheerios, PJ Masks Cereal, and Plentiful. Similarly, the US-based Kellogg Co. expanded its product portfolio in India in 2021 by launching Froot Loops in the cereals category in the country. Hence, such an increase in the number of product launches is expected to drive the growth of the global market during the forecast period.
Significant Market Trend
The increasing number of internet and e-commerce users are major trends in the market growth. New market participants are entering the global market for online distribution as a result of the rising demand for online purchases. During the forecast period, the market under consideration is also anticipated to grow as a result of expanding food delivery services, a growing number of smartphones, and rising internet usage.
Manufacturers of breakfast cereal can reach consumers in remote places owing to online distribution channels. E-commerce businesses that offer subscription services also encourage customers to repeat the purchase of a particular breakfast cereal. During the forecast period, the convenience provided by the online platform, such as the simplicity of using debit or credit cards for payment from the convenience of the consumer's home and the ease of product delivery, is anticipated to propel market growth.
Major Market Challenge
The fluctuation in food prices is a major challenge impeding market growth. The average annual increase in food prices over the last few years has been close to 2.7%. Cereals are nutritious alternatives to typical meals, but their high cost presents a significant barrier for consumers. Natural disasters and unfavorable weather, like floods, earthquakes, droughts, frost, and pestilence, have an impact on the raw materials and goods used to make whole-grain and high-fiber food products. Oat plantations, for example, are susceptible to natural disasters and unfavorable weather, which can lower the quality of oats and affect their supply. Hence, the producers of oat products rely on a wide range of suppliers in different regions.
Furthermore, due to abrupt shifts in the economy and sociopolitical environment, like the Russia-Ukraine war, food prices fluctuate. Year-over-year (y-o-y) fluctuations in grain prices impede the development of the market. Therefore, these factors have been recognized as difficulties that are anticipated to hinder the expansion of the market for breakfast cereals during the forecast period.
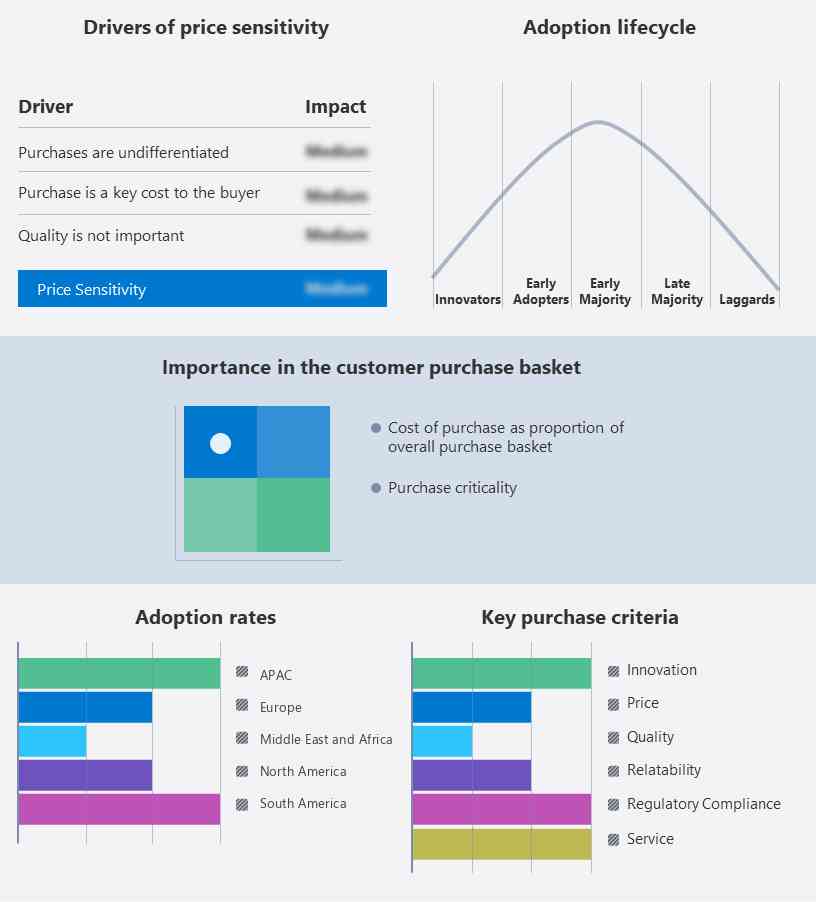
Customer Landscape
The market forecasting report includes the adoption lifecycle of the market, covering from the innovator's stage to the laggard's stage. It focuses on adoption rates in different regions based on penetration. Furthermore, the report also includes key purchase criteria and drivers of price sensitivity to help companies evaluate and develop their growth strategies.
Global Market Customer Landscape
Key Breakfast Cereals Market Players?
Companies are implementing various strategies, such as strategic alliances, partnerships, mergers and acquisitions, geographical expansion, and product/service launches, to enhance their presence in the market.
Bio familia AG - The company primarily offers cereal products. The key offerings of the company include breakfast cereals such as crunchy muesli, organic muesli, and kids muesli.
The report also includes detailed analyses of the competitive landscape of the market and information about 15 market companies, including:
- Associated British Foods Plc
- B and G Foods Inc.
- Bagrrys India Pvt. Ltd.
- Bobs Red Mill Natural Foods Inc.
- Calbee Inc.
- Food For Life Baking Co. Inc.
- General Mills Inc.
- Hometown Food Co.
- Kellogg Co
- Manischewitz Co.
- Marico Ltd.
- Natures Path Foods
- Nestle SA
- New England Natural Bakers
- PepsiCo Inc.
Qualitative and quantitative analysis of companies has been conducted to help clients understand the wider business environment as well as the strengths and weaknesses of key market players. Data is qualitatively analyzed to categorize vendors as pure play, category-focused, industry-focused, and diversified; it is quantitatively analyzed to categorize vendors as dominant, leading, strong, tentative, and weak.
Market Analyst Overview
The food industry sector embraces a wide range of choices catering to modern lifestyles, from ready-to-eat cereals like cornflakes and cold cereals to nutritious options like quinoa, grains, and ancient grains. Yogurt, milk, and fruit complement these offerings, providing essential vitamins and minerals for a healthy lifestyle. Specialty stores and online stores cater to diverse preferences, offering clean label food products and specialty cereals with probiotics, nuts, and other superfoods. Breakfast cereal manufacturers innovate with granola and hot cereal products to meet the demands of fast-paced lifestyles, while convenient packaging enhances convenience store and departmental store accessibility. Social media amplifies the appeal of indulgent flavors and nutritional content, influencing choices in at-home breakfast eating versus conventional meals. With a focus on convenient and healthy foods, this dynamic market segment continues to evolve, driven by consumer preferences and advancements in E-commerce and retail infrastructure.
Moreover, in today's fast-paced world, ready-to-eat cereals cater to busy lifestyles, offering convenient and quick breakfast options that appeal to Millennials and consumers seeking ready-to-eat solutions. These cereals often feature a variety of wheats, seeds, dried fruits, and other organic ingredients, providing nutrition in a health halo context. Specialist retailers and e-commerce platforms play a crucial role in delivering these products to consumers who prioritize taste and convenience. The hot cereal segment offers alternatives for those preferring a warm breakfast, with savory options becoming increasingly popular alongside traditional region-specific products. Cereal brands innovate to capture niche markets with niche breakfast cereals that blend nutrition with unique flavors, leveraging retail infrastructures to reach broader audiences. Whether for at-home breakfast eating or on-the-go consumption, these offerings reflect evolving consumer preferences and the adaptability of the grocery food sector to meet modern dietary needs and lifestyle demands.
|
Market Scope |
|
|
Report Coverage |
Details |
|
Page number |
167 |
|
Base year |
2023 |
|
Historic period |
2018-2022 |
|
Forecast period |
2024-2028 |
|
Growth momentum & CAGR |
Accelerate at a CAGR of 3.2% |
|
Market growth 2024-2028 |
USD 4.10 billion |
|
Market structure |
Fragmented |
|
YoY growth 2023-2024(%) |
3.06 |
|
Regional analysis |
North America, Europe, APAC, Middle East and Africa, and South America |
|
Performing market contribution |
APAC at 30% |
|
Key countries |
US, UK, Germany, Japan, and China |
|
Competitive landscape |
Leading Companies, Market Positioning of Companies, Competitive Strategies, and Industry Risks |
|
Key companies profiled |
Associated British Foods Plc, B and G Foods Inc., Bagrrys India Pvt. Ltd., Bio familia AG, Bobs Red Mill Natural Foods Inc., Calbee Inc., Food For Life Baking Co. Inc., General Mills Inc., Hometown Food Co., Kellogg Co., Manischewitz Co., Marico Ltd., Natures Path Foods, Nestle SA, New England Natural Bakers, PepsiCo Inc., Post Holdings Inc., The Simply Good Foods Co., and Three Wishes Cereal |
|
Market dynamics |
Parent market analysis, Market forecasting growth inducers and obstacles, Fast-growing and slow-growing segment analysis, Market growth and Forecasting, COVID 19 impact and recovery analysis and future consumer dynamics, Market condition analysis for forecast period |
|
Customization purview |
If our market report has not included the data that you are looking for, you can reach out to our analysts and get segments customized. |
What are the Key Data Covered in this Market Forecast Report?
- CAGR of the market during the forecast period
- Detailed information on factors that will drive the market growth and forecasting of the market between 2024 and 2028
- Precise estimation of the market size and its contribution to the parent market
- Accurate predictions about upcoming market trends and analysis and changes in consumer behavior
- Growth of the market across Europe, North America, APAC, South America, and Middle East and Africa
- Thorough market growth analysis of the market's competitive landscape and detailed information about companies
- Comprehensive market analysis and report on the factors that will challenge the market research and growth of market companies
We can help! Our analysts can customize this report to meet your requirements. Get in touch
 RIA -
RIA - 
