
Asset Integrity Management Systems Market Size 2025-2029
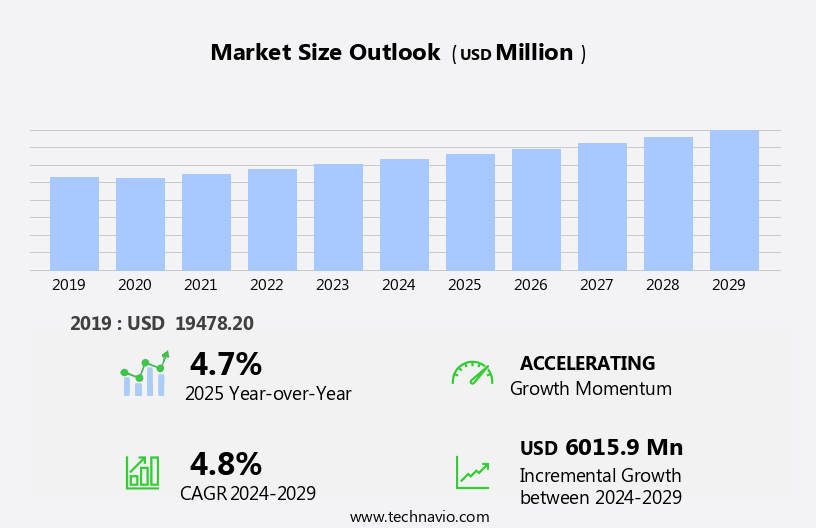
The asset integrity management systems market size is forecast to increase by USD 6.02 billion, at a CAGR of 4.8% between 2024 and 2029.
- The market is driven by the pressing need to maintain and optimize aging infrastructure, particularly in energy and industrial sectors. This requirement is fueled by increasing regulatory scrutiny and the potential for costly downtime or catastrophic failures. Another key trend is the strategic deployment of partnerships and acquisitions to expand offerings and enhance capabilities. However, the integration of legacy systems poses a significant challenge. Companies must navigate the complexity of merging disparate data sources and technologies to achieve seamless, effective AIMS.
- This intricacy necessitates substantial investment in resources and expertise. To capitalize on market opportunities and address these challenges, organizations should prioritize standardization, interoperability, and continuous improvement in their AIMS strategies. By focusing on these areas, they can ensure the reliable operation of their assets, mitigate risks, and maintain a competitive edge.
What will be the Size of the Asset Integrity Management Systems Market during the forecast period?
Explore in-depth regional segment analysis with market size data - historical 2019-2023 and forecasts 2025-2029 - in the full report.
Request Free Sample
Asset Integrity Management Systems continue to evolve, adapting to the ever-changing market dynamics and expanding their applications across various sectors. Integral to these systems are sensor technologies, which provide real-time data for continuous monitoring and analysis. Visual inspection, risk-based inspection, and acoustic emission monitoring are crucial components, ensuring the early detection of defects and potential failures. Cathodic protection and regulatory compliance are essential elements, safeguarding assets from corrosion and ensuring adherence to industry standards. Cloud computing facilitates data storage and accessibility, enabling data visualization and analytics for enhanced operational efficiency and safety improvement. Anodic protection, pipeline integrity management, and defect detection are vital for maintaining the integrity of critical infrastructure.
API standards and corrosion prevention strategies are integrated into these systems, optimizing maintenance and reducing downtime. The integration of data analytics, machine learning, and remote monitoring further enhances AIMS capabilities. These technologies facilitate predictive maintenance, enabling proactive interventions and reducing costs. Ultrasonic testing, eddy current testing, and non-destructive testing (NDT) are essential techniques for structural health monitoring and material selection. Vibration monitoring, pressure vessel integrity, and process safety management are also crucial components, ensuring the ongoing safety and reliability of assets. The unfolding market activities reveal a continuous focus on cost reduction, safety improvement, and risk mitigation.
Leak detection and downtime reduction are essential aspects, ensuring the optimal performance of assets and minimizing potential hazards. Incorporating technologies such as dye penetrant testing, corrosion monitoring, and big data analytics, AIMS are poised to revolutionize asset management across industries. The integration of these advanced technologies ensures a comprehensive approach to asset management, enabling organizations to make informed decisions and maintain the integrity of their critical infrastructure.
How is this Asset Integrity Management Systems Industry segmented?
The asset integrity management systems (aims) industry research report provides comprehensive data (region-wise segment analysis), with forecasts and estimates in "USD million" for the period 2025-2029, as well as historical data from 2019-2023 for the following segments.
- Service Type
- Non-destructive testing
- Risk based inspection
- Corrosion management
- Pipeline integrity management
- Others
- End-user
- Oil and gas
- Power generation
- Aerospace and defense
- Manufacturing and processing
- Others
- Geography
- North America
- US
- Canada
- Europe
- France
- Germany
- UK
- APAC
- China
- India
- Japan
- South Korea
- South America
- Brazil
- Rest of World (ROW)
- North America
By Service Type Insights
The non-destructive testing segment is estimated to witness significant growth during the forecast period.
Asset Integrity Management Systems (AIMS) have gained significant importance in maintaining the reliability, safety, and longevity of industrial assets. Non-destructive testing (NDT), a key component of AIMS, employs various techniques to evaluate asset conditions without disrupting their operation. Ultrasonic testing (UT) uses sound waves to detect internal flaws in metal structures, ensuring the early identification of hidden defects in pipelines and pressure vessels. Magnetic particle testing (MPI) is another NDT technique that detects surface and subsurface cracks in ferromagnetic materials. ISO standards and regulatory compliance play a crucial role in the implementation of AIMS. Data analytics, machine learning, and data visualization facilitate the interpretation of complex data generated by these testing methods.
Structural health monitoring, risk-based inspection, and real-time monitoring enable proactive maintenance and downtime reduction. Corrosion inhibitors, cathodic protection, and anodic protection are essential in preventing and mitigating corrosion. Pipeline integrity management, tank integrity management, and pressure vessel integrity are critical applications of AIMS. Leak detection, vibration monitoring, and process safety management are other applications ensuring operational efficiency and safety improvement. Sensor technologies, such as acoustic emission monitoring and dye penetrant testing, provide valuable data for defect detection and maintenance optimization. API standards and material selection are essential considerations in the implementation of AIMS. Cost reduction is a significant driving factor, with cloud computing enabling remote monitoring and reducing the need for on-site inspections.
AIMS have become indispensable in maintaining the integrity of industrial assets. NDT techniques, including UT and MPI, play a vital role in detecting defects and ensuring safety. Regulatory compliance, data analytics, and machine learning facilitate effective asset management, while cost reduction and operational efficiency are key benefits.
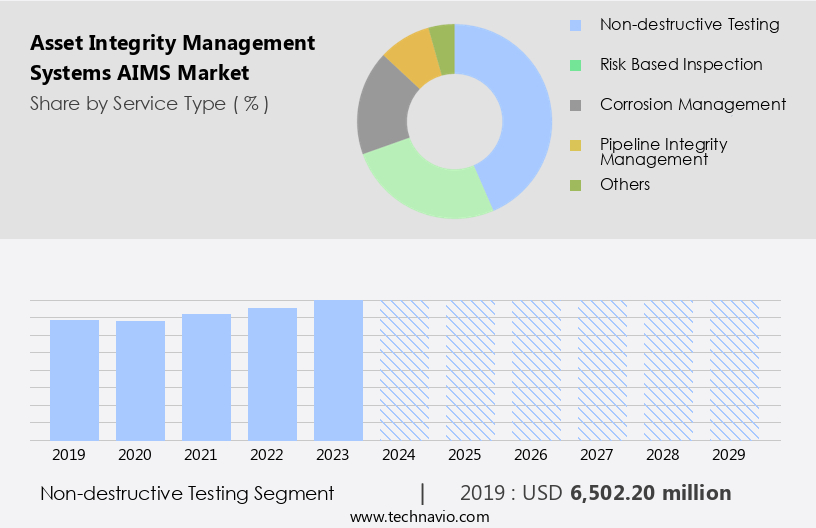
The Non-destructive testing segment was valued at USD 6.5 billion in 2019 and showed a gradual increase during the forecast period.
Regional Analysis
North America is estimated to contribute 41% to the growth of the global market during the forecast period.Technavio's analysts have elaborately explained the regional trends and drivers that shape the market during the forecast period.

The market in North America is experiencing significant growth due to the increasing focus on safety, regulatory compliance, and operational efficiency in various industries. Regulatory bodies such as OSHA and API set stringent guidelines for pipeline and refinery inspections, driving the demand for advanced AIMS solutions. These systems incorporate technologies like eddy current testing, ultrasonic testing, magnetic particle testing, and non-destructive testing (NDT) for defect detection and risk mitigation. Data analytics, machine learning, and real-time monitoring enable predictive maintenance and downtime reduction. Structural health monitoring, corrosion prevention, and material selection ensure tank and pressure vessel integrity. Sensor technologies and remote monitoring facilitate proactive maintenance optimization, while risk-based inspection and process safety management prioritize safety improvement.
Regulatory compliance with ISO standards and API guidelines is essential, and cloud computing facilitates data access and sharing. The market is further bolstered by the integration of advanced technologies like acoustic emission monitoring, cathodic protection, vibration monitoring, and dye penetrant testing. The increasing production of oil and natural gas in the US, particularly in the Permian region, necessitates robust AIMS solutions for maintaining operational efficiency and ensuring safety.
Market Dynamics
Our researchers analyzed the data with 2024 as the base year, along with the key drivers, trends, and challenges. A holistic analysis of drivers will help companies refine their marketing strategies to gain a competitive advantage.
What are the key market drivers leading to the rise in the adoption of Asset Integrity Management Systems Industry?
- The aging infrastructure sector serves as the primary catalyst for market growth, as the need to replace and upgrade outdated systems and structures continues to escalate.
- Asset Integrity Management Systems (AIMS) have gained significant importance in various industries due to the aging infrastructure issue. With the increasing vulnerability of industrial facilities, pipelines, and power plants to wear, corrosion, and mechanical failure, there is a pressing need for advanced AIMS to ensure continuous monitoring, preventive maintenance, and risk assessment. In the oil and gas sector, offshore platforms and pipelines, many of which have surpassed their intended lifespan, pose a considerable challenge. According to the North Sea Transition Authority (NSTA) and the US Energy Information Administration (EIA), as of April 2024, over 1,500 oil and gas platforms and installations in the North Sea had an average age of 25 years.
- AIMS employ various techniques, such as eddy current testing, ultrasonic testing, magnetic particle testing, and structural health monitoring, to assess the condition of assets and prevent potential failures. Furthermore, data analytics, data visualization, machine learning, and remote monitoring enable predictive maintenance and proactive risk management. Corrosion inhibitors are also crucial in maintaining asset integrity by preventing or slowing down the corrosion process. The integration of these technologies and techniques in AIMS enhances operational safety, productivity, and environmental protection.
What are the market trends shaping the Asset Integrity Management Systems Industry?
- Strategic partnerships and acquisitions have emerged as a significant market trend. Companies are increasingly forming alliances and making acquisitions to expand their reach, enhance their capabilities, and gain a competitive edge.
- The market is witnessing significant growth due to strategic partnerships and acquisitions that foster innovation and enhance service offerings. These collaborations enable providers to leverage complementary strengths, delivering comprehensive solutions that optimize asset performance, improve operational efficiency, and ensure regulatory compliance. For instance, on April 2, 2024, Cenosco, a leading asset integrity management software provider, and MaxGrip, a global consultancy specializing in Asset Performance Management (APM), announced a strategic partnership. This collaboration combines Cenosco's IMS Suite, developed in partnership with Shell, with MaxGrip's extensive expertise in APM, change management, and advisory services. The partnership empowers IMS Suite users with industry knowledge and proven experience from MaxGrip, leading to optimized asset performance and substantial cost savings.
- Sensor technologies, such as acoustic emission monitoring and visual inspection, play a crucial role in AIMS by detecting defects and assessing pipeline integrity. Risk-based inspection techniques, based on API standards, ensure regulatory compliance and prioritize maintenance activities based on risk levels. Cathodic protection and anodic protection systems safeguard assets from corrosion, extending their lifespan and reducing maintenance costs. Cloud computing enables real-time data access and analysis, facilitating proactive maintenance and efficient decision-making. These technologies and practices are essential for maintaining asset integrity and ensuring optimal performance in various industries.
What challenges does the Asset Integrity Management Systems Industry face during its growth?
- The integration of legacy systems poses a significant complexity challenge, which negatively impacts industry growth.
- The integration of advanced Asset Integrity Management Systems (AIMS) into legacy infrastructure presents a notable challenge in various industries, including oil and gas, power generation, and manufacturing. Outdated monitoring equipment and control systems, which are common in aging infrastructure, require customization and specialized expertise to be compatible with modern AIMS platforms. Legacy systems often employ proprietary protocols, outdated hardware, and limited data connectivity, making their integration with advanced AIMS solutions complex. For instance, older offshore oil rigs or power plants may still utilize analog sensors and standalone control systems that are incompatible with cloud-based monitoring or digital twin platforms.
- This issue necessitates significant resources and investment to update the infrastructure or develop custom interfaces for seamless integration. Despite these challenges, implementing AIMS can lead to substantial benefits such as corrosion prevention, life cycle assessment, operational efficiency improvements, safety enhancements, cost reduction, tank integrity management, vibration monitoring, and pressure vessel integrity. Real-time monitoring and non-destructive testing (NDT) can also help minimize downtime and ensure optimal performance. By addressing the complexities of integrating legacy systems, businesses can reap the rewards of AIMS, including enhanced operational efficiency, improved safety, and reduced costs.
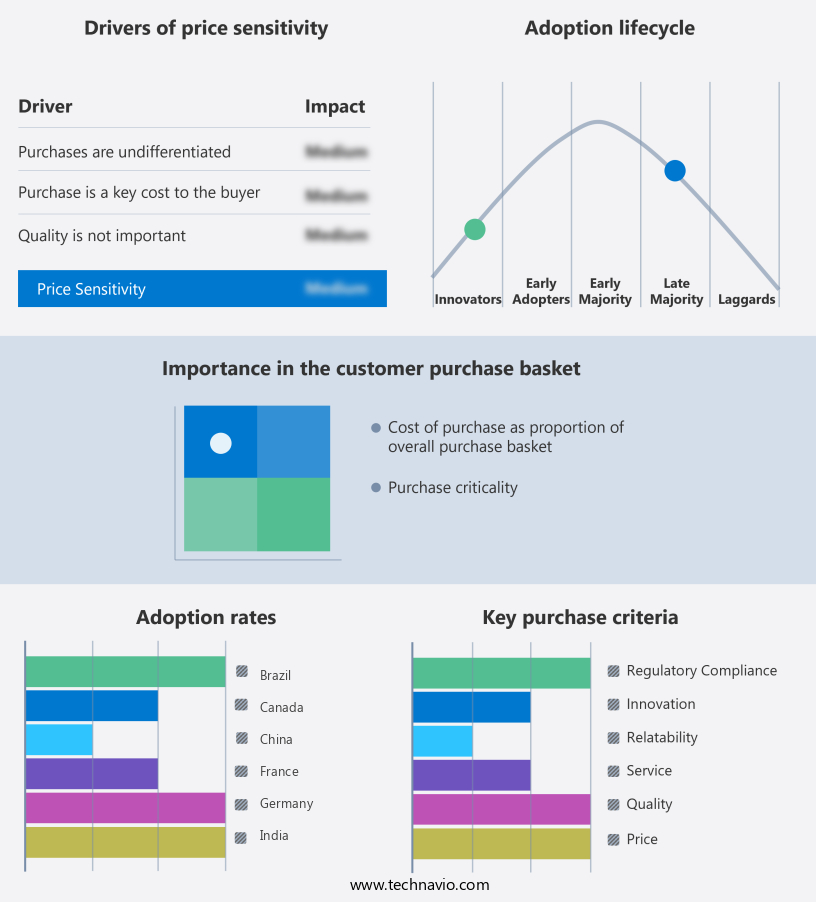
Exclusive Customer Landscape
The asset integrity management systems (aims) market forecasting report includes the adoption lifecycle of the market, covering from the innovator's stage to the laggard's stage. It focuses on adoption rates in different regions based on penetration. Furthermore, the asset integrity management systems (aims) market report also includes key purchase criteria and drivers of price sensitivity to help companies evaluate and develop their market growth analysis strategies.
Customer Landscape
Key Companies & Market Insights
Companies are implementing various strategies, such as strategic alliances, asset integrity management systems (aims) market forecast, partnerships, mergers and acquisitions, geographical expansion, and product/service launches, to enhance their presence in the industry.
ABB Ltd. - Asset Integrity Management Systems (AIMS) from this company are essential for minimizing unplanned outages and enhancing asset performance across diverse industries. These solutions leverage advanced technology to ensure reliable operations and maximize efficiency. AIMS solutions are a critical investment for businesses seeking to optimize their assets and maintain a competitive edge.
The industry research and growth report includes detailed analyses of the competitive landscape of the market and information about key companies, including:
- ABB Ltd.
- Antea
- Asset Integrity Engineering
- Bentley Systems Inc.
- Bureau Veritas SA
- Cenosco B.V.
- DNV Group AS
- Emerson Electric Co.
- FieldCircle Inc.
- GE Vernova Inc.
- Honeywell International Inc.
- IFS World Operations AB
- Intertek Group Plc
- John Wood Group PLC
- Lloyds Register Group Services Ltd.
- Metegrity Inc.
- Oracle Corp.
- Rockwell Automation Inc.
- SAP SE
- Schneider Electric SE
- SGS SA
- Siemens AG
Qualitative and quantitative analysis of companies has been conducted to help clients understand the wider business environment as well as the strengths and weaknesses of key industry players. Data is qualitatively analyzed to categorize companies as pure play, category-focused, industry-focused, and diversified; it is quantitatively analyzed to categorize companies as dominant, leading, strong, tentative, and weak.
Recent Development and News in Asset Integrity Management Systems Market
- In January 2024, Emerson Electric Company announced the launch of its new Asset Performance Management (APM) software, AMS Trellis, which integrates Asset Integrity Management Systems (AIMS) with its existing APM portfolio. This expansion aims to provide clients with a comprehensive solution for managing their assets' lifecycles, from performance optimization to risk mitigation (Emerson Electric Company Press Release, 2024).
- In March 2024, ABB and Wood plc formed a strategic partnership to combine ABB's Ability Asset Management for Utilities with Wood's asset integrity services. This collaboration intends to offer enhanced digital solutions and expertise to the energy and utilities sector, enabling improved asset performance and risk reduction (ABB Press Release, 2024).
- In May 2024, Siemens Energy announced a significant investment of â¬100 million in its MindSphere IoT operating system for energy management and AIMS. This investment will expand the capabilities of its AIMS offerings, allowing for more comprehensive data analysis and predictive maintenance (Siemens Energy Press Release, 2024).
- In February 2025, Honeywell International acquired Metegrity, a leading provider of AIMS software for the oil and gas industry. This acquisition will strengthen Honeywell's digital transformation offerings, enabling clients to optimize their asset performance and risk management (Honeywell International Press Release, 2025).
Research Analyst Overview
- The market is witnessing significant advancements, driven by the integration of technology and data-centric approaches to maintenance management. Key components of AIMS include maintenance scheduling, corrective maintenance, and failure analysis. Data integrity is paramount, ensuring accuracy in root cause analysis and predictive modeling. Blockchain technology and IoT sensors are revolutionizing spare parts management, enabling real-time tracking and streamlined procurement. Human capital management, work management systems, and training and development are crucial for optimizing workforce efficiency. Condition-based maintenance, integration with ERP systems, and compliance management are essential for maintaining regulatory standards.
- Digital twins, predictive modeling, reporting and analytics, and virtual reality (VR) are transforming maintenance processes by providing immersive, data-driven insights. Reliability engineering, augmented reality (AR), wireless communication, inventory management, data security, artificial intelligence (AI), mobile applications, and preventative maintenance are other vital aspects of AIMS, enhancing operational efficiency and asset performance.
Dive into Technavio's robust research methodology, blending expert interviews, extensive data synthesis, and validated models for unparalleled Asset Integrity Management Systems Market insights. See full methodology.
|
Market Scope |
|
|
Report Coverage |
Details |
|
Page number |
229 |
|
Base year |
2024 |
|
Historic period |
2019-2023 |
|
Forecast period |
2025-2029 |
|
Growth momentum & CAGR |
Accelerate at a CAGR of 4.8% |
|
Market growth 2025-2029 |
USD 6015.9 million |
|
Market structure |
Fragmented |
|
YoY growth 2024-2025(%) |
4.7 |
|
Key countries |
US, China, Canada, Germany, India, Japan, UK, France, South Korea, and Brazil |
|
Competitive landscape |
Leading Companies, Market Positioning of Companies, Competitive Strategies, and Industry Risks |
What are the Key Data Covered in this Asset Integrity Management Systems Market Research and Growth Report?
- CAGR of the Asset Integrity Management Systems industry during the forecast period
- Detailed information on factors that will drive the growth and forecasting between 2025 and 2029
- Precise estimation of the size of the market and its contribution of the industry in focus to the parent market
- Accurate predictions about upcoming growth and trends and changes in consumer behaviour
- Growth of the market across North America, APAC, Europe, Middle East and Africa, and South America
- Thorough analysis of the market's competitive landscape and detailed information about companies
- Comprehensive analysis of factors that will challenge the asset integrity management systems market growth of industry companies
We can help! Our analysts can customize this asset integrity management systems market research report to meet your requirements.
 RIA -
RIA - 
