Asset Performance Management Market Size 2024-2028
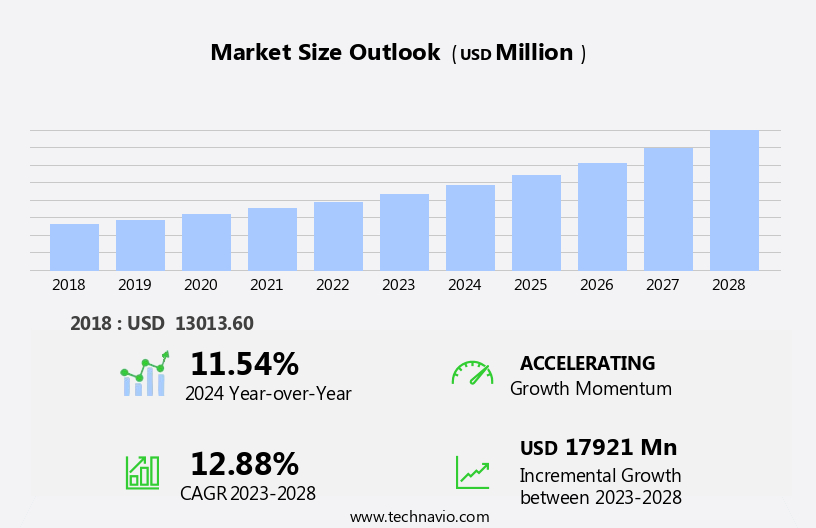
The asset performance management market size is forecast to increase by USD 17.92 billion at a CAGR of 12.88% between 2023 and 2028.
- The Asset Performance Management market is growing rapidly, driven by the adoption of asset management software, the rising importance of asset tracking, and the shift toward cloud-based solutions for flexibility and cost savings.
- While integration challenges exist, APM enhances asset reliability, reduces maintenance costs, and boosts efficiency, making it essential for organizations. The market is set for continued expansion as businesses seek to maximize asset value.
What will be the Size of the Asset Performance Management Market During the Forecast Period?

Request Free Sample
- The Asset Performance Management (APM) market encompasses a range of strategies and technologies aimed at optimizing the reliability and efficiency of critical assets across various industries. Key market dynamics include the adoption of RCM (Reliability-Centered Maintenance) strategies, preventative maintenance, inspection, monitoring, and engineering analytical methodologies. These approaches enable organizations to shift from reactive maintenance to proactive, data-driven decision-making.
- Broader asset management trends include digital transformation, environmental regulations, and net zero policy initiatives driving the integration of sensors and IoT technologies to monitor assets in real-time. Industries such as mining, oil and gas, and arms manufacturing rely heavily on APM to ensure regulatory compliances and maintain equipment reliability.Digital workforce solutions and cloud deployment are also transforming APM, offering customers mobile solutions for managing assets and streamlining processes.
How is this Asset Performance Management Industry segmented and which is the largest segment?
The asset performance management industry research report provides comprehensive data (region-wise segment analysis), with forecasts and estimates in "USD billion" for the period 2024-2028, as well as historical data from 2018-2022 for the following segments.
- End-user
- Energy and utilities
- Oil and gas
- Manufacturing
- Government and public sector
- Others
- Component
- Category
- Predictive Asset Management
- Asset Reliability Management
- Asset Strategy Management
- Others
- Deployment
- Geography
- North America
- Europe
- APAC
- South America
- Middle East and Africa
By End-user Insights
The energy and utilities segment is estimated to witness significant growth during the forecast period. In the energy and utilities sector, Asset Performance Management (APM) is a critical practice for optimizing the performance, reliability, and longevity of essential assets, including power plants, renewable energy infrastructure, pipelines, and grids. APM is vital for this industry, as it enhances operational efficiency by maximizing asset uptime, minimizing downtime, and reducing maintenance costs. Key applications of APM in energy and utilities include power generation, where it enables operators to monitor and maintaIn the performance of turbines, boilers, generators, and other critical equipment. APM strategies encompass various methods, such as predictive and prescriptive analytics, inspection and monitoring, engineering and analytical methodologies, and real-time condition reporting.
Additionally, APM addresses broader asset management aspects, such as operational systems, optimization methods, failure risks, recession, and cost-cutting measures. Industries served by APM extend beyond energy and utilities, reaching the mining, oil and gas, telecommunication, chemicals, and asset-intensive organizations. Digital transformation, environmental regulations, and regulatory compliances are driving the adoption of APM. Digital twin, predictive analytics, and prescriptive analytics are integral components of APM, ensuring asset integrity management, predictive asset management, asset strategy optimization, and asset life extension. The integration of APM with existing applications, such as IT initiatives and infrastructure support, is essential for seamless implementation. APM addresses concerns related to mission-critical assets, data security, confidentiality, cyberattacks, and cybersecurity.

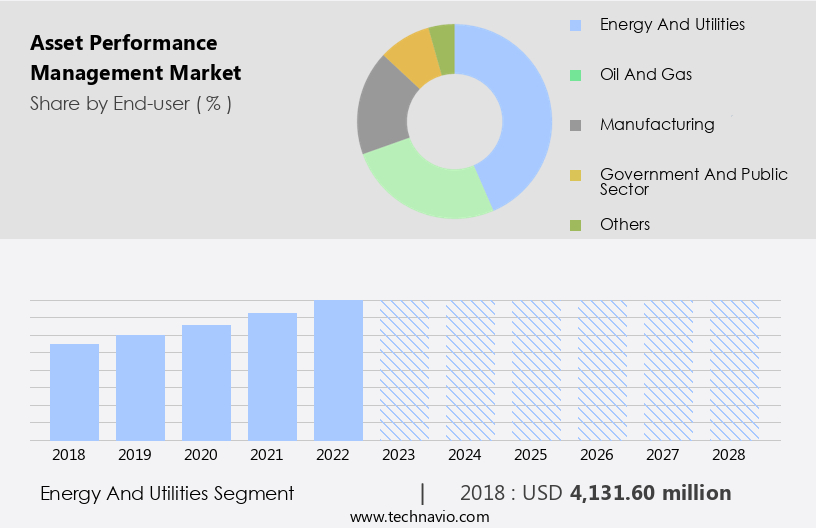
Get a glance at the share of various segments. Request Free Sample
The energy and utilities segment was valued at USD 4.13 billion in 2018 and showed a gradual increase during the forecast period.
Regional Analysis
North America is estimated to contribute 39% to the growth of the global market during the forecast period. Technavio's analysts have elaborately explained the regional trends and drivers that shape the market during the forecast period.

For more insights on the market share of various regions, Request Free Sample
The North American market is projected to hold a significant market share In the global Asset Performance Management (APM) market. This region's growth is attributed to the presence of large IT companies and advanced technological developments, including digitalization In the US and Canada. The increasing emphasis on reducing operational expenses and maximizing asset utilization is driving the demand for APM solutions in this region. Moreover, the presence of key players specializing in IT asset management software in North America is expected to fuel market expansion. The need for real-time condition reports, predictive analytics, and prescriptive maintenance strategies to mitigate failure risks and optimize operational efficiency is a significant trend In the APM market.
Industries served include energy, utilities, and asset-intensive organizations In the chemicals vertical. Digital transformation, regulatory compliances, and net zero policy initiatives are also influencing APM investments. Despite the economic slowdown and cost-cutting measures, the importance of maintaining mission-critical assets and ensuring data security, confidentiality, and cybersecurity concerns remains paramount. Digital twin solutions, predictive analytics, and integration with existing applications are essential for asset strategy management. The market encompasses predictive asset management, asset strategy optimization, and asset integrity management. The hosted systems segment is gaining popularity with public cloud and computing resources.
Market Dynamics
Our researchers analyzed the data with 2023 as the base year, along with the key drivers, trends, and challenges. A holistic analysis of drivers will help companies refine their marketing strategies to gain a competitive advantage.
What are the key market drivers leading to the rise In the adoption of Asset Performance Management Industry?
Rapid adoption of asset management software and growing importance of asset tracking is the key driver of the market.
- Asset Performance Management (APM) is a key priority for asset-intensive industries such as energy, utilities, mining, oil and gas, chemicals, and telecommunications. Managing a vast array of assets has become increasingly complex due to economic slowdowns, cost-cutting measures, and evolving operational demands. Traditional asset management practices, including preventive maintenance, inspections, and monitoring, are now enhanced by real-time condition reports, predictive analytics, and optimization methods to improve efficiency and reduce downtime. APM solutions encompass asset strategy management, integrity management, and early warning notifications, with industries leveraging sensors, software, and digital tools for asset monitoring and maintenance.
- The adoption of digital transformation, IoT, cloud deployment, and digital twin technology is accelerating, particularly among large enterprises focused on data analytics, regulatory compliance, and infrastructure support. Predictive asset management and asset strategy optimization help extend asset life while reducing unplanned repairs and operational disruptions. As organizations strive to enhance efficiency and mitigate failure risks, APM continues to grow in importance, ensuring informed asset decisions and long-term operational stability across industries.
What are the market trends shaping the Asset Performance Management Industry?
Growing adoption of cloud-based asset performance management services is the upcoming market trend.
- Asset Performance Management (APM) is essential for asset-intensive industries to enhance asset utilization, improve operational efficiency, and reduce downtime. It integrates asset reliability, preventive maintenance, inspections, monitoring, engineering, and analytics to optimize asset strategy and mitigate failure risks. Industries such as energy, utilities, chemicals, mining, oil and gas, telecommunications, and manufacturing rely on APM to implement cost-effective maintenance plans, particularly as economic challenges drive the need for efficiency. Advanced technologies like real-time condition monitoring, digital twins, predictive and prescriptive analytics, and neural networks enable early warning notifications and proactive asset management.
- The push for digital transformation, regulatory compliance, and cybersecurity concerns has accelerated cloud adoption, while large enterprises focus on asset integrity management, operational expenses, and infrastructure support. APM leverages sensors, 3D imaging, and risk-based inspection to enhance asset performance, with statistical modeling tools identifying potential issues before they escalate. Public cloud deployment provides flexible computing resources, while digital twin technology and IT initiatives strengthen data security and risk mitigation. As organizations strive to extend asset life, reduce unplanned repairs, and control costs, APM remains a critical investment for long-term operational success.
What challenges does the Asset Performance Management Industry face during its growth?
Integration and implementation issues is a key challenge affecting the industry growth.
- Implementing Asset Performance Management (APM) presents several challenges, including the complexity of asset reliability, preventive maintenance, and analytics, as well as the need for seamless integration with operational systems and early warning notifications. Financial constraints, failure risks, and regulatory compliance further impact asset investment decisions, while industries such as energy, utilities, and manufacturing require tailored solutions to optimize performance.
- The adoption of real-time condition monitoring, predictive analytics, and digital twin technology demands significant investment and expertise, alongside ensuring data security and workforce adaptation. Additionally, organizations face hurdles in customizing APM solutions, integrating with existing applications, and managing labor and environmental risks. As digital transformation accelerates, leveraging cloud-based platforms, machine learning, and statistical modeling is crucial for enhancing asset reliability and efficiency while overcoming deployment and compatibility challenges.
Exclusive Customer Landscape
The asset performance management market forecasting report includes the adoption lifecycle of the market, covering from the innovator's stage to the laggard's stage. It focuses on adoption rates in different regions based on penetration. Furthermore, the asset performance management market report also includes key purchase criteria and drivers of price sensitivity to help companies evaluate and develop their market growth analysis strategies.
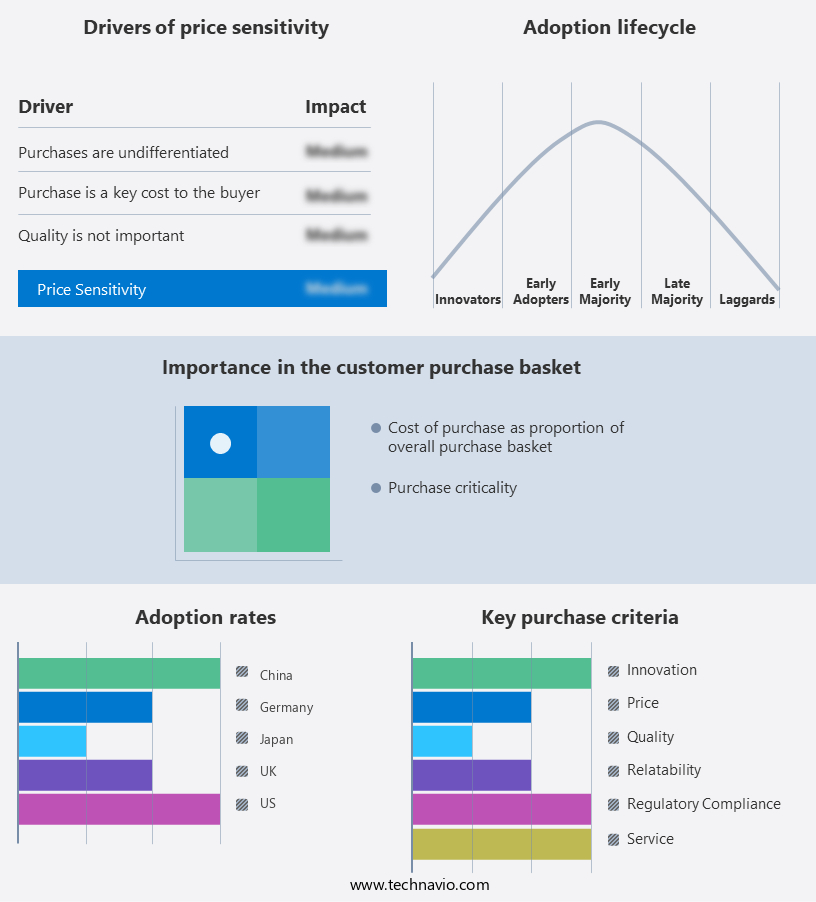
Customer Landscape
Key Companies & Market Insights
Companies are implementing various strategies, such as strategic alliances, asset performance management market forecast, partnerships, mergers and acquisitions, geographical expansion, and product/service launches, to enhance their presence In the industry.
The industry research and growth report includes detailed analyses of the competitive landscape of the market and information about key companies, including:
- GE Digital (General Electric)
- Siemens AG
- ABB Ltd.
- Schneider Electric SE
- IBM Corp.
- SAP SE
- Oracle Corp. (Enterprise Asset Management)
- Honeywell International Inc.
- Emerson Electric Co.
- Rockwell Automation Inc.
- Bentley Systems, Inc.
- Aspen Technology Inc.
- IFS AB
- Infor Inc.
- Hexagon AB
- Dassault Systemes
- Hitachi Vantara
- Fujitsu Ltd.
- PTC Inc.
- Cognite AS
Qualitative and quantitative analysis of companies has been conducted to help clients understand the wider business environment as well as the strengths and weaknesses of key industry players. Data is qualitatively analyzed to categorize companies as pure play, category-focused, industry-focused, and diversified; it is quantitatively analyzed to categorize companies as dominant, leading, strong, tentative, and weak.
Research Analyst Overview
Asset Performance Management (APM) is a critical function for organizations that rely on a significant number of assets to deliver their core business offerings. APM goes beyond traditional maintenance strategies to optimize asset utilization, improve operational efficiency, and minimize downtime. APM encompasses various strategies, such as preventative maintenance, inspection, monitoring, engineering, and analytical methodologies. These approaches aim to identify potential failure risks and address them before they cause significant operational impact. In broader asset management, APM plays a pivotal role in helping asset-intensive organizations make informed decisions regarding asset investments, resource availability, and asset strategy management. This is particularly important during economic slowdowns or recessionary periods when cost-cutting measures may be necessary.
Operational systems and optimization methods are essential components of APM. Real-time condition reports, predictive analytics, prescriptive analytics, and integration with existing applications help organizations proactively manage their assets and minimize unplanned downtime. Mission-critical assets, such as those In the energy, utilities, chemicals, mining, oil and gas, telecommunication, and other industries, require a high level of attention and care. APM solutions and services cater to these industries, offering digital twin solutions, data security, confidentiality, and cybersecurity concerns. Digital transformation is a significant trend in APM, with cloud deployment and digital workforce solutions gaining popularity. Large enterprises are increasingly investing in asset integrity management and predictive asset management to optimize asset health and maintenance costs.
Environmental regulations and net zero policy initiatives also impact APM strategies, as organizations strive to balance operational efficiency with environmental sustainability. APM is not without challenges, however. Labor safety risks, environmental risks, and cybersecurity concerns are just a few of the issues that organizations must address when implementing APM solutions. Neural networks, machine learning, statistical modeling tools, and algorithms are some of the advanced technologies that can help mitigate these risks and improve overall asset performance. In the hosted systems segment, public cloud deployment and computing resources are becoming increasingly popular for APM applications. This trend is driven by the need for scalability, flexibility, and cost savings.
Market Scope
|
Report Coverage
|
Details
|
Page number
|
174
|
Base year
|
2023
|
Historic period
|
2018-2022 |
Forecast period
|
2024-2028
|
Growth momentum & CAGR
|
Accelerate at a CAGR of 12.88%
|
Market growth 2024-2028
|
USD 17.92 billion
|
Market structure
|
Fragmented
|
YoY growth 2023-2024(%)
|
11.54
|
Key countries
|
US, China, UK, Germany, and Japan
|
Competitive landscape
|
Leading Companies, Market Positioning of Companies, Competitive Strategies, and Industry Risks
|
Request Free Sample
What are the Key Data Covered in this Asset Performance Management Market Research and Growth Report?
- CAGR of the Asset Performance Management industry during the forecast period
- Detailed information on factors that will drive the growth and forecasting between 2024 and 2028
- Precise estimation of the size of the market and its contribution of the industry in focus to the parent market
- Accurate predictions about upcoming growth and trends and changes in consumer behaviour
- Growth of the market across North America, Europe, APAC, South America, and Middle East and Africa
- Thorough analysis of the market's competitive landscape and detailed information about companies
- Comprehensive analysis of factors that will challenge the asset performance management market growth of industry companies
We can help! Our analysts can customize this asset performance management market research report to meet your requirements.
Get in touch
1 Executive Summary
- 1.1 Market overview
- Executive Summary - Chart on Market Overview
- Executive Summary - Data Table on Market Overview
- Executive Summary - Chart on Global Market Characteristics
- Executive Summary - Chart on Market by Geography
- Executive Summary - Chart on Market Segmentation by End-user
- Executive Summary - Chart on Market Segmentation by Component
- Executive Summary - Chart on Incremental Growth
- Executive Summary - Data Table on Incremental Growth
- Executive Summary - Chart on Company Market Positioning
2 Market Landscape
- 2.1 Market ecosystem
- Parent Market
- Data Table on - Parent Market
- 2.2 Market characteristics
- Market characteristics analysis
3 Market Sizing
- 3.1 Market definition
- Offerings of companies included in the market definition
- 3.2 Market segment analysis
- 3.4 Market outlook: Forecast for 2023-2028
- Chart on Global - Market size and forecast 2023-2028 ($ million)
- Data Table on Global - Market size and forecast 2023-2028 ($ million)
- Chart on Global Market: Year-over-year growth 2023-2028 (%)
- Data Table on Global Market: Year-over-year growth 2023-2028 (%)
4 Historic Market Size
- 4.1 Global Asset Performance Management Market 2018 - 2022
- Historic Market Size - Data Table on Global Asset Performance Management Market 2018 - 2022 ($ million)
- 4.2 End-user segment analysis 2018 - 2022
- Historic Market Size - End-user Segment 2018 - 2022 ($ million)
- 4.3 Component segment analysis 2018 - 2022
- Historic Market Size - Component Segment 2018 - 2022 ($ million)
- 4.4 Geography segment analysis 2018 - 2022
- Historic Market Size - Geography Segment 2018 - 2022 ($ million)
- 4.5 Country segment analysis 2018 - 2022
- Historic Market Size - Country Segment 2018 - 2022 ($ million)
5 Five Forces Analysis
- 5.1 Five forces summary
- Five forces analysis - Comparison between 2023 and 2028
- 5.2 Bargaining power of buyers
- Bargaining power of buyers - Impact of key factors 2023 and 2028
- 5.3 Bargaining power of suppliers
- Bargaining power of suppliers - Impact of key factors in 2023 and 2028
- 5.4 Threat of new entrants
- Threat of new entrants - Impact of key factors in 2023 and 2028
- 5.5 Threat of substitutes
- Threat of substitutes - Impact of key factors in 2023 and 2028
- 5.6 Threat of rivalry
- Threat of rivalry - Impact of key factors in 2023 and 2028
- 5.7 Market condition
- Chart on Market condition - Five forces 2023 and 2028
6 Market Segmentation by End-user
- 6.1 Market segments
- Chart on End-user - Market share 2023-2028 (%)
- Data Table on End-user - Market share 2023-2028 (%)
- 6.2 Comparison by End-user
- Chart on Comparison by End-user
- Data Table on Comparison by End-user
- 6.3 Energy and utilities - Market size and forecast 2023-2028
- Chart on Energy and utilities - Market size and forecast 2023-2028 ($ million)
- Data Table on Energy and utilities - Market size and forecast 2023-2028 ($ million)
- Chart on Energy and utilities - Year-over-year growth 2023-2028 (%)
- Data Table on Energy and utilities - Year-over-year growth 2023-2028 (%)
- 6.4 Oil and gas - Market size and forecast 2023-2028
- Chart on Oil and gas - Market size and forecast 2023-2028 ($ million)
- Data Table on Oil and gas - Market size and forecast 2023-2028 ($ million)
- Chart on Oil and gas - Year-over-year growth 2023-2028 (%)
- Data Table on Oil and gas - Year-over-year growth 2023-2028 (%)
- 6.5 Manufacturing - Market size and forecast 2023-2028
- Chart on Manufacturing - Market size and forecast 2023-2028 ($ million)
- Data Table on Manufacturing - Market size and forecast 2023-2028 ($ million)
- Chart on Manufacturing - Year-over-year growth 2023-2028 (%)
- Data Table on Manufacturing - Year-over-year growth 2023-2028 (%)
- 6.6 Government and public sector - Market size and forecast 2023-2028
- Chart on Government and public sector - Market size and forecast 2023-2028 ($ million)
- Data Table on Government and public sector - Market size and forecast 2023-2028 ($ million)
- Chart on Government and public sector - Year-over-year growth 2023-2028 (%)
- Data Table on Government and public sector - Year-over-year growth 2023-2028 (%)
- 6.7 Others - Market size and forecast 2023-2028
- Chart on Others - Market size and forecast 2023-2028 ($ million)
- Data Table on Others - Market size and forecast 2023-2028 ($ million)
- Chart on Others - Year-over-year growth 2023-2028 (%)
- Data Table on Others - Year-over-year growth 2023-2028 (%)
- 6.8 Market opportunity by End-user
- Market opportunity by End-user ($ million)
- Data Table on Market opportunity by End-user ($ million)
7 Market Segmentation by Component
- 7.1 Market segments
- Chart on Component - Market share 2023-2028 (%)
- Data Table on Component - Market share 2023-2028 (%)
- 7.2 Comparison by Component
- Chart on Comparison by Component
- Data Table on Comparison by Component
- 7.3 Solution - Market size and forecast 2023-2028
- Chart on Solution - Market size and forecast 2023-2028 ($ million)
- Data Table on Solution - Market size and forecast 2023-2028 ($ million)
- Chart on Solution - Year-over-year growth 2023-2028 (%)
- Data Table on Solution - Year-over-year growth 2023-2028 (%)
- 7.4 Services - Market size and forecast 2023-2028
- Chart on Services - Market size and forecast 2023-2028 ($ million)
- Data Table on Services - Market size and forecast 2023-2028 ($ million)
- Chart on Services - Year-over-year growth 2023-2028 (%)
- Data Table on Services - Year-over-year growth 2023-2028 (%)
- 7.5 Market opportunity by Component
- Market opportunity by Component ($ million)
- Data Table on Market opportunity by Component ($ million)
8 Market Segmentation by Category
- 8.1 Market segments
- Chart on Category - Market share (2023-2028) (%)
- Data Table on Category - Market share (2023-2028) (%)
- 8.2 Comparison by Category
- Chart on Comparison by Category
- Data Table on Comparison by Category
- 8.3 Predictive Asset Management - Market size and forecast (2023-2028)
- Chart on Predictive Asset Management - Market size and forecast (2023-2028) ($ million)
- Data Table on Predictive Asset Management - Market size and forecast (2023-2028) ($ million)
- Chart on Predictive Asset Management - Year-over-year growth (2023-2028) (%)
- Data Table on Predictive Asset Management - Year-over-year growth (2023-2028) (%)
- 8.4 Asset Reliability Management - Market size and forecast (2023-2028)
- Chart on Asset Reliability Management - Market size and forecast (2023-2028) ($ million)
- Data Table on Asset Reliability Management - Market size and forecast (2023-2028) ($ million)
- Chart on Asset Reliability Management - Year-over-year growth (2023-2028) (%)
- Data Table on Asset Reliability Management - Year-over-year growth (2023-2028) (%)
- 8.5 Asset Strategy Management - Market size and forecast (2023-2028)
- Chart on Asset Strategy Management - Market size and forecast (2023-2028) ($ million)
- Data Table on Asset Strategy Management - Market size and forecast (2023-2028) ($ million)
- Chart on Asset Strategy Management - Year-over-year growth (2023-2028) (%)
- Data Table on Asset Strategy Management - Year-over-year growth (2023-2028) (%)
- 8.6 Others - Market size and forecast (2023-2028)
- Chart on Others - Market size and forecast (2023-2028) ($ million)
- Data Table on Others - Market size and forecast (2023-2028) ($ million)
- Chart on Others - Year-over-year growth (2023-2028) (%)
- Data Table on Others - Year-over-year growth (2023-2028) (%)
- 8.7 Market opportunity by Category
- Market opportunity by $segment_name ($ million)
- Data Table on Market opportunity by $segment_name ($ million)
9 Market Segmentation by Deployment
- 9.1 Market segments
- Chart on Deployment - Market share (2023-2028) (%)
- Data Table on Deployment - Market share (2023-2028) (%)
- 9.2 Comparison by Deployment
- Chart on Comparison by Deployment
- Data Table on Comparison by Deployment
- 9.3 On-premise - Market size and forecast (2023-2028)
- Chart on On-premise - Market size and forecast (2023-2028) ($ million)
- Data Table on On-premise - Market size and forecast (2023-2028) ($ million)
- Chart on On-premise - Year-over-year growth (2023-2028) (%)
- Data Table on On-premise - Year-over-year growth (2023-2028) (%)
- 9.4 Hosted - Market size and forecast (2023-2028)
- Chart on Hosted - Market size and forecast (2023-2028) ($ million)
- Data Table on Hosted - Market size and forecast (2023-2028) ($ million)
- Chart on Hosted - Year-over-year growth (2023-2028) (%)
- Data Table on Hosted - Year-over-year growth (2023-2028) (%)
- 9.5 Market opportunity by Deployment
- Market opportunity by $segment_name ($ million)
- Data Table on Market opportunity by $segment_name ($ million)
10 Customer Landscape
- 10.1 Customer landscape overview
- Analysis of price sensitivity, lifecycle, customer purchase basket, adoption rates, and purchase criteria
11 Geographic Landscape
- 11.1 Geographic segmentation
- Chart on Market share by geography 2023-2028 (%)
- Data Table on Market share by geography 2023-2028 (%)
- 11.2 Geographic comparison
- Chart on Geographic comparison
- Data Table on Geographic comparison
- 11.3 North America - Market size and forecast 2023-2028
- Chart on North America - Market size and forecast 2023-2028 ($ million)
- Data Table on North America - Market size and forecast 2023-2028 ($ million)
- Chart on North America - Year-over-year growth 2023-2028 (%)
- Data Table on North America - Year-over-year growth 2023-2028 (%)
- 11.4 Europe - Market size and forecast 2023-2028
- Chart on Europe - Market size and forecast 2023-2028 ($ million)
- Data Table on Europe - Market size and forecast 2023-2028 ($ million)
- Chart on Europe - Year-over-year growth 2023-2028 (%)
- Data Table on Europe - Year-over-year growth 2023-2028 (%)
- 11.5 APAC - Market size and forecast 2023-2028
- Chart on APAC - Market size and forecast 2023-2028 ($ million)
- Data Table on APAC - Market size and forecast 2023-2028 ($ million)
- Chart on APAC - Year-over-year growth 2023-2028 (%)
- Data Table on APAC - Year-over-year growth 2023-2028 (%)
- 11.6 South America - Market size and forecast 2023-2028
- Chart on South America - Market size and forecast 2023-2028 ($ million)
- Data Table on South America - Market size and forecast 2023-2028 ($ million)
- Chart on South America - Year-over-year growth 2023-2028 (%)
- Data Table on South America - Year-over-year growth 2023-2028 (%)
- 11.7 Middle East and Africa - Market size and forecast 2023-2028
- Chart on Middle East and Africa - Market size and forecast 2023-2028 ($ million)
- Data Table on Middle East and Africa - Market size and forecast 2023-2028 ($ million)
- Chart on Middle East and Africa - Year-over-year growth 2023-2028 (%)
- Data Table on Middle East and Africa - Year-over-year growth 2023-2028 (%)
- 11.8 US - Market size and forecast 2023-2028
- Chart on US - Market size and forecast 2023-2028 ($ million)
- Data Table on US - Market size and forecast 2023-2028 ($ million)
- Chart on US - Year-over-year growth 2023-2028 (%)
- Data Table on US - Year-over-year growth 2023-2028 (%)
- 11.9 China - Market size and forecast 2023-2028
- Chart on China - Market size and forecast 2023-2028 ($ million)
- Data Table on China - Market size and forecast 2023-2028 ($ million)
- Chart on China - Year-over-year growth 2023-2028 (%)
- Data Table on China - Year-over-year growth 2023-2028 (%)
- 11.10 UK - Market size and forecast 2023-2028
- Chart on UK - Market size and forecast 2023-2028 ($ million)
- Data Table on UK - Market size and forecast 2023-2028 ($ million)
- Chart on UK - Year-over-year growth 2023-2028 (%)
- Data Table on UK - Year-over-year growth 2023-2028 (%)
- 11.11 Germany - Market size and forecast 2023-2028
- Chart on Germany - Market size and forecast 2023-2028 ($ million)
- Data Table on Germany - Market size and forecast 2023-2028 ($ million)
- Chart on Germany - Year-over-year growth 2023-2028 (%)
- Data Table on Germany - Year-over-year growth 2023-2028 (%)
- 11.12 Japan - Market size and forecast 2023-2028
- Chart on Japan - Market size and forecast 2023-2028 ($ million)
- Data Table on Japan - Market size and forecast 2023-2028 ($ million)
- Chart on Japan - Year-over-year growth 2023-2028 (%)
- Data Table on Japan - Year-over-year growth 2023-2028 (%)
- 11.13 Market opportunity by geography
- Market opportunity by geography ($ million)
- Data Tables on Market opportunity by geography ($ million)
- 11.14 US - Market size and forecast (2023-2028)
- Chart on US - Market size and forecast (2023-2028) ($ million)
- Data Table on US - Market size and forecast (2023-2028) ($ million)
- Chart on US - Year-over-year growth (2023-2028) (%)
- Data Table on US - Year-over-year growth (2023-2028) (%)
- 11.15 China - Market size and forecast (2023-2028)
- Chart on China - Market size and forecast (2023-2028) ($ million)
- Data Table on China - Market size and forecast (2023-2028) ($ million)
- Chart on China - Year-over-year growth (2023-2028) (%)
- Data Table on China - Year-over-year growth (2023-2028) (%)
- 11.16 UK - Market size and forecast (2023-2028)
- Chart on UK - Market size and forecast (2023-2028) ($ million)
- Data Table on UK - Market size and forecast (2023-2028) ($ million)
- Chart on UK - Year-over-year growth (2023-2028) (%)
- Data Table on UK - Year-over-year growth (2023-2028) (%)
- 11.17 Germany - Market size and forecast (2023-2028)
- Chart on Germany - Market size and forecast (2023-2028) ($ million)
- Data Table on Germany - Market size and forecast (2023-2028) ($ million)
- Chart on Germany - Year-over-year growth (2023-2028) (%)
- Data Table on Germany - Year-over-year growth (2023-2028) (%)
- 11.18 Japan - Market size and forecast (2023-2028)
- Chart on Japan - Market size and forecast (2023-2028) ($ million)
- Data Table on Japan - Market size and forecast (2023-2028) ($ million)
- Chart on Japan - Year-over-year growth (2023-2028) (%)
- Data Table on Japan - Year-over-year growth (2023-2028) (%)
12 Drivers, Challenges, and Opportunity/Restraints
- 12.3 Impact of drivers and challenges
- Impact of drivers and challenges in 2023 and 2028
- 12.4 Market opportunities/restraints
13 Competitive Landscape
- 13.2 Competitive Landscape
- Overview on criticality of inputs and factors of differentiation
- 13.3 Landscape disruption
- Overview on factors of disruption
- 13.4 Industry risks
- Impact of key risks on business
14 Competitive Analysis
- 14.2 Market positioning of companies
- Matrix on companies position and classification
- 14.3 GE Digital (General Electric)
- GE Digital (General Electric) - Overview
- GE Digital (General Electric) - Product / Service
- GE Digital (General Electric) - Key offerings
- 14.4 Siemens AG
- Siemens AG - Overview
- Siemens AG - Product / Service
- Siemens AG - Key offerings
- 14.5 ABB Ltd.
- ABB Ltd. - Overview
- ABB Ltd. - Product / Service
- ABB Ltd. - Key offerings
- 14.6 Schneider Electric SE
- Schneider Electric SE - Overview
- Schneider Electric SE - Product / Service
- Schneider Electric SE - Key offerings
- 14.7 IBM Corp.
- IBM Corp. - Overview
- IBM Corp. - Product / Service
- IBM Corp. - Key offerings
- 14.8 SAP SE
- SAP SE - Overview
- SAP SE - Product / Service
- SAP SE - Key offerings
- 14.9 Oracle Corp. (Enterprise Asset Management)
- Oracle Corp. (Enterprise Asset Management) - Overview
- Oracle Corp. (Enterprise Asset Management) - Product / Service
- Oracle Corp. (Enterprise Asset Management) - Key offerings
- 14.10 Honeywell International Inc.
- Honeywell International Inc. - Overview
- Honeywell International Inc. - Product / Service
- Honeywell International Inc. - Key offerings
- 14.11 Emerson Electric Co.
- Emerson Electric Co. - Overview
- Emerson Electric Co. - Product / Service
- Emerson Electric Co. - Key offerings
- 14.12 Rockwell Automation Inc.
- Rockwell Automation Inc. - Overview
- Rockwell Automation Inc. - Product / Service
- Rockwell Automation Inc. - Key offerings
- 14.13 Bentley Systems, Inc.
- Bentley Systems, Inc. - Overview
- Bentley Systems, Inc. - Product / Service
- Bentley Systems, Inc. - Key offerings
- 14.14 Aspen Technology Inc.
- Aspen Technology Inc. - Overview
- Aspen Technology Inc. - Product / Service
- Aspen Technology Inc. - Key offerings
- 14.15 IFS AB
- IFS AB - Overview
- IFS AB - Product / Service
- IFS AB - Key offerings
- 14.16 Infor Inc.
- Infor Inc. - Overview
- Infor Inc. - Product / Service
- Infor Inc. - Key offerings
- 14.17 Hexagon AB
- Hexagon AB - Overview
- Hexagon AB - Product / Service
- Hexagon AB - Key offerings
- 14.18 Dassault Systemes
- Dassault Systemes - Overview
- Dassault Systemes - Product / Service
- Dassault Systemes - Key offerings
- 14.19 Hitachi Vantara
- Hitachi Vantara - Overview
- Hitachi Vantara - Product / Service
- Hitachi Vantara - Key offerings
- 14.20 Fujitsu Ltd.
- Fujitsu Ltd. - Overview
- Fujitsu Ltd. - Product / Service
- Fujitsu Ltd. - Key offerings
- 14.21 PTC Inc.
- PTC Inc. - Overview
- PTC Inc. - Product / Service
- PTC Inc. - Key offerings
- 14.22 Cognite AS
- Cognite AS - Overview
- Cognite AS - Product / Service
- Cognite AS - Key offerings
15 Appendix
- 15.2 Inclusions and exclusions checklist
- Inclusions checklist
- Exclusions checklist
- 15.3 Currency conversion rates for US$
- Currency conversion rates for US$
- 15.4 Research methodology
- 15.7 Validation techniques employed for market sizing
- Validation techniques employed for market sizing
- 15.9 360 degree market analysis
- 360 degree market analysis
- 15.10 List of abbreviations