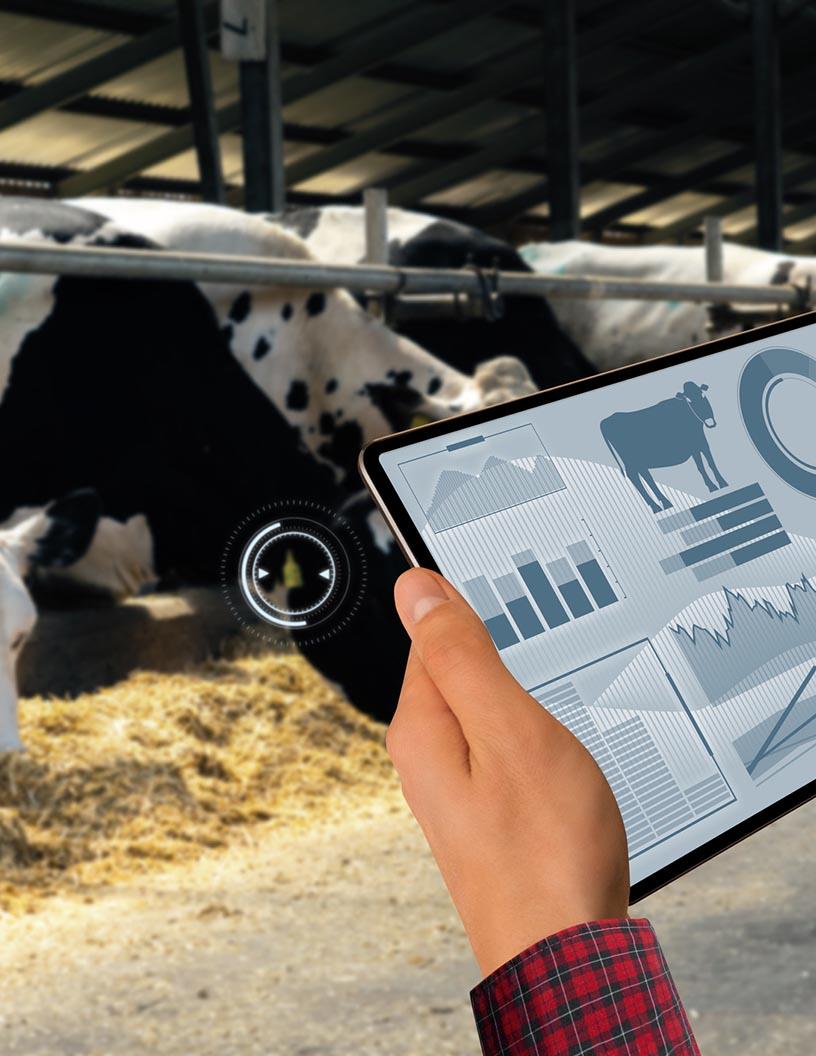
RFID Tags For Livestock Management Market Size 2025-2029
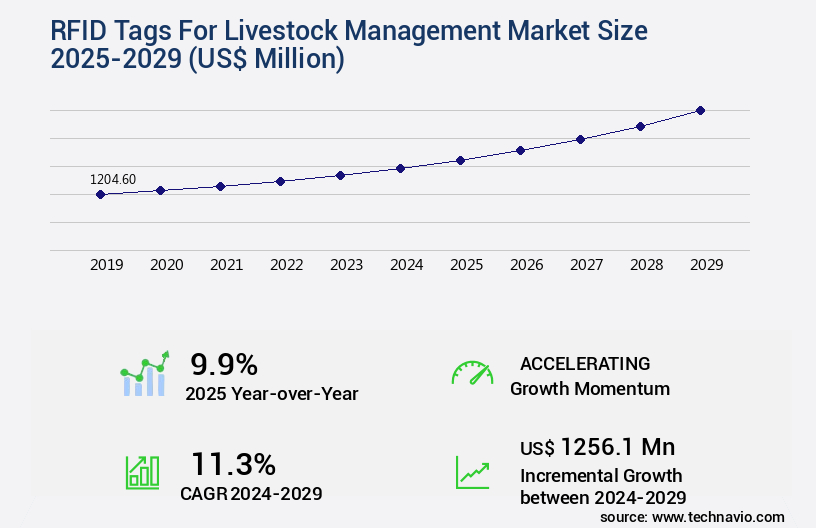
The rfid tags for livestock management market size is valued to increase USD 1.26 billion, at a CAGR of 11.3% from 2024 to 2029. Regulations regarding animal welfare will drive the rfid tags for livestock management market.
Major Market Trends & Insights
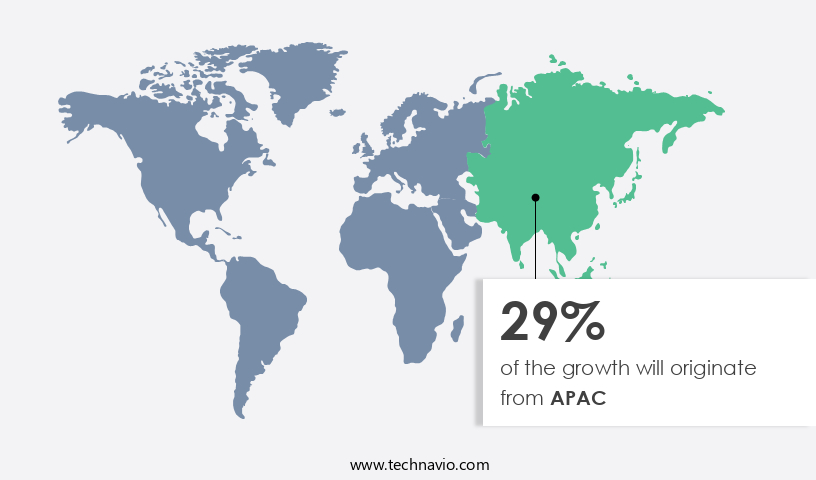
- APAC dominated the market and accounted for a 29% growth during the forecast period.
- By Type - Cattle segment was valued at USD 545.90 billion in 2023
- By Application - Passive segment accounted for the largest market revenue share in 2023
Market Size & Forecast
- Market Opportunities: USD 151.15 million
- Market Future Opportunities: USD 1256.10 million
- CAGR : 11.3%
- APAC: Largest market in 2023
Market Summary
- The market is a continually evolving sector, driven by advancements in core technologies and applications. Real-time tracking and monitoring, improved accuracy, and enhanced data analysis are key benefits fueling the adoption of RFID technology in livestock management. Service types, including installation, integration, and maintenance, are essential components of the market, alongside product categories such as active and passive RFID tags. Regulations, particularly those regarding animal welfare, play a crucial role in market dynamics. Despite the advantages, challenges persist, including the high cost of active RFID tags. Looking ahead, the market is expected to unfold with significant growth in the forecast period, with RFID technology's increasing penetration in the agriculture industry and the rising demand for automation in livestock units.
- According to recent estimates, the passive RFID tag market share in livestock management is projected to reach 70% by 2025. Related markets such as the IoT in agriculture and precision livestock farming also contribute to the market's ongoing evolution.
What will be the Size of the RFID Tags For Livestock Management Market during the forecast period?
Get Key Insights on Market Forecast (PDF) Request Free Sample
How is the RFID Tags For Livestock Management Market Segmented and what are the key trends of market segmentation?
The rfid tags for livestock management industry research report provides comprehensive data (region-wise segment analysis), with forecasts and estimates in "USD million" for the period 2025-2029, as well as historical data from 2019-2023 for the following segments.
- Type
- Cattle
- Goats and sheep
- Others
- Application
- Passive
- Active
- Geography
- North America
- US
- Canada
- Europe
- France
- Germany
- Italy
- UK
- APAC
- China
- India
- Japan
- South America
- Brazil
- Rest of World (ROW)
- North America
By Type Insights
The cattle segment is estimated to witness significant growth during the forecast period.
RFID tags play a pivotal role in revolutionizing livestock management, particularly in the dairy industry. Approximately 25% of global dairy farms currently employ RFID technology for automated data collection, livestock tracking, and behavioral pattern recognition. This figure is expected to rise, with industry experts projecting a 27% increase in RFID tag adoption within the next five years. The technology's benefits extend beyond identification and tracking. RFID tags enable real-time location tracking, feeding behavior analysis, predictive livestock models, and health monitoring metrics. This data is crucial for pasture management optimization, breeding management software, and inventory management systems.
With real-time data, farmers can make informed decisions, improve herd management, and enhance production efficiency metrics. RFID tags offer extended durability, with tag retention rates exceeding 95%. This durability is essential for livestock management, as tags must endure harsh environmental conditions. Moreover, RFID tags facilitate early disease detection, reducing labor costs, and improving animal welfare assessment. The technology's range extends up to 100 feet, allowing for remote health monitoring and environmental monitoring sensors. RFID middleware software ensures seamless data integration with farm management software, GPS integration, and automated feeding systems. This integration results in data visualization dashboards, improved herd management, and supply chain traceability.
Sensor data accuracy is a critical factor in the success of RFID technology. With accurate data, farmers can optimize feeding systems, reduce mortality rates, and predict movement patterns analysis. This information is vital for precision livestock farming, which aims to improve overall animal health and wellbeing.
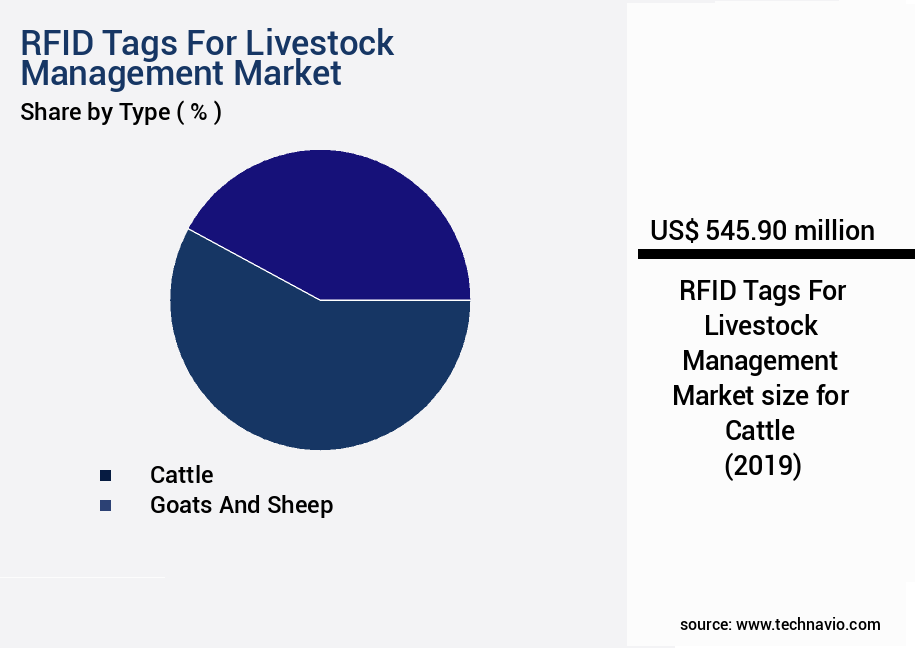
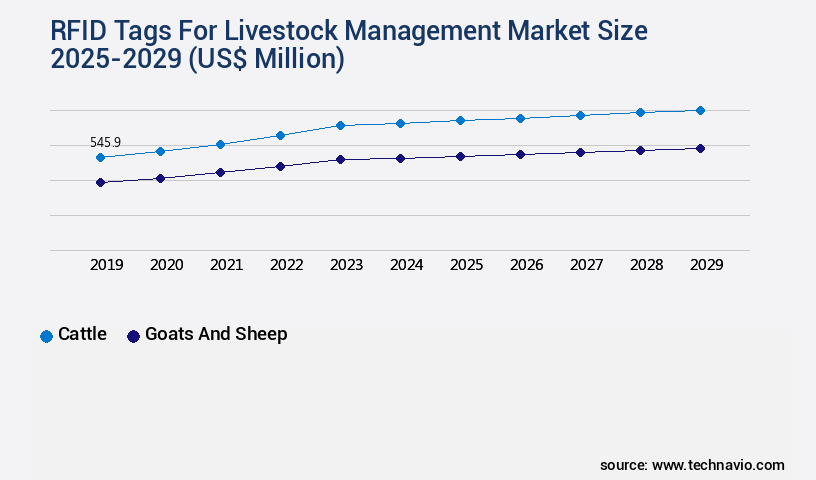
The Cattle segment was valued at USD 545.90 billion in 2019 and showed a gradual increase during the forecast period.
Regional Analysis
APAC is estimated to contribute 29% to the growth of the global market during the forecast period.Technavio’s analysts have elaborately explained the regional trends and drivers that shape the market during the forecast period.
See How RFID Tags For Livestock Management Market Demand is Rising in APAC Request Free Sample
The market is witnessing significant growth due to the increasing population of livestock and rising investments in the farming sector. North America hosts a high concentration of organized livestock farming companies, with various farm sizes and livestock types, including buffalos, sheep, goats, poultry, and pigs. The presence of numerous livestock animals poses management challenges, which RFID technology effectively addresses. The US Department of Agriculture (USDA) mandates the use of RFID technology for livestock welfare and management. As of 2024, a new USDA rule requires electronic identification (EID) tags for cattle and bison.
In North America, over 30% of farms have adopted RFID technology, and this number is projected to reach 50% by 2026. Additionally, European farmers are adopting RFID technology at a CAGR of 12.5% from 2021 to 2026. These trends underscore the market's continuous evolution and the potential for substantial growth.
Market Dynamics
Our researchers analyzed the data with 2024 as the base year, along with the key drivers, trends, and challenges. A holistic analysis of drivers will help companies refine their marketing strategies to gain a competitive advantage.
The market is witnessing significant growth due to the technological advancements in animal tracking and monitoring systems. One of the key factors driving this market is the improved performance of RFID tags in harsh environments, enabling real-time monitoring of livestock in various farming conditions. The placement of RFID tags on livestock also plays a crucial role in ensuring optimal read rates, ensuring accurate data collection. The integration of RFID technology with existing farm management software is another significant trend, allowing for data analysis that leads to improved breeding decisions and disease outbreak prediction. This data-driven approach is revolutionizing the livestock industry, with RFID data being used to optimize grazing patterns, monitor livestock health in real-time using wearable sensors, and assess feed efficiency.
Moreover, RFID technology is enhancing supply chain traceability, enabling farmers to monitor the movement of livestock from farm to market. Automated detection of livestock stress levels and assessing animal welfare using RFID data analysis are also becoming essential components of precision livestock farming applications. The cost-effectiveness of RFID systems in livestock management is another compelling reason for their adoption. According to a study, RFID-based monitoring systems can reduce labor costs by up to 50% and improve productivity by up to 30%. However, challenges exist in integrating RFID data into existing farm management systems, and data security and privacy considerations are essential.
Comparatively, passive RFID tags have a read range of up to 10 meters and require no battery replacement, while active RFID tags have a read range of up to 100 meters and require a battery. Passive RFID tags are more cost-effective, but active RFID tags offer real-time tracking capabilities, making them suitable for larger farms. In conclusion, the market is witnessing significant growth due to its ability to enhance livestock productivity, improve herd management, and optimize farming operations. The integration of RFID technology with existing farm management software, real-time health monitoring, and supply chain traceability are some of the key applications driving the market's growth.
Despite the challenges, the benefits of RFID implementation in modern livestock farms far outweigh the costs.
What are the key market drivers leading to the rise in the adoption of RFID Tags For Livestock Management Industry?
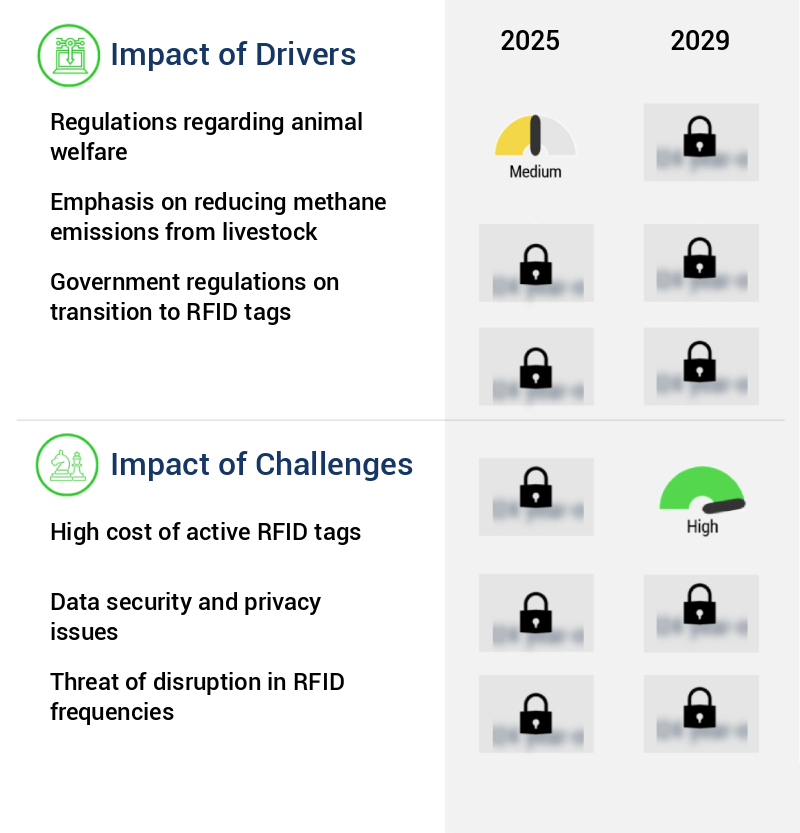
- Compliance with regulations concerning animal welfare is a pivotal factor in driving market trends.
- The global livestock industry is experiencing a notable increase in production, leading to overcapacity in farming units. Consequently, farmers struggle to provide adequate care for each animal due to the limited workforce. This situation has resulted in the prevalence of chronic diseases among livestock, including anthrax and various viral and bacterial infections. The rise in these health issues necessitates regular monitoring and identification of affected animals. Animal welfare organizations have become increasingly vocal about the need for regulations in livestock rearing to ensure animal health and well-being. Numerous comparative studies reveal a significant difference in disease prevalence between intensively farmed and extensively managed livestock systems.
- Proper animal management practices, such as improved biosecurity, vaccination programs, and disease surveillance, can help mitigate the impact of these diseases on livestock populations. The ongoing evolution of livestock farming practices necessitates continuous research and innovation to ensure the health and well-being of animals while maintaining productivity.
What are the market trends shaping the RFID Tags For Livestock Management Industry?
- The increasing adoption of automation is a notable trend in the livestock industry's market. Automation's implementation in livestock units is becoming more prevalent.
- The global agriculture and livestock sectors face a significant labor crunch, with the skilled workforce declining and the population shifting towards non-agricultural jobs. This trend is particularly noticeable in the Americas, where strict immigration rules have further impacted the livestock farming industry. In response, farmers are turning to automation to decrease labor costs and enhance efficiency. For instance, robotic milking systems, automated feeding systems, and drones for crop monitoring are increasingly common. The shift towards automation is not limited to large-scale farms; small and medium-sized operations are also adopting these technologies.
- The implementation of automation not only reduces labor expenses but also ensures consistent quality and productivity. Despite these advancements, the labor shortage persists, highlighting the need for continuous innovation and adaptation in the agriculture and livestock industries.
What challenges does the RFID Tags For Livestock Management Industry face during its growth?
- The high cost of active RFID tags poses a significant challenge to the growth of the industry, as these advanced technology tags require more financial investment compared to their passive counterparts.
- RFID systems have become increasingly popular in livestock management due to their efficiency and accuracy. The cost of implementing these systems varies depending on the type of tags and readers used. Passive RFID tags, commonly used for livestock management, cost approximately 21 cents each. In contrast, active RFID tags, which are necessary for large-scale operations, can be more expensive. A single active RFID reader can cost up to USD1,500.
- Despite the higher cost, RFID systems offer several advantages over traditional identification methods. They provide real-time information, reduce labor costs, and improve overall herd management. The ongoing advancements in RFID technology continue to drive down costs and increase functionality, making these systems an attractive investment for livestock businesses.
Exclusive Customer Landscape
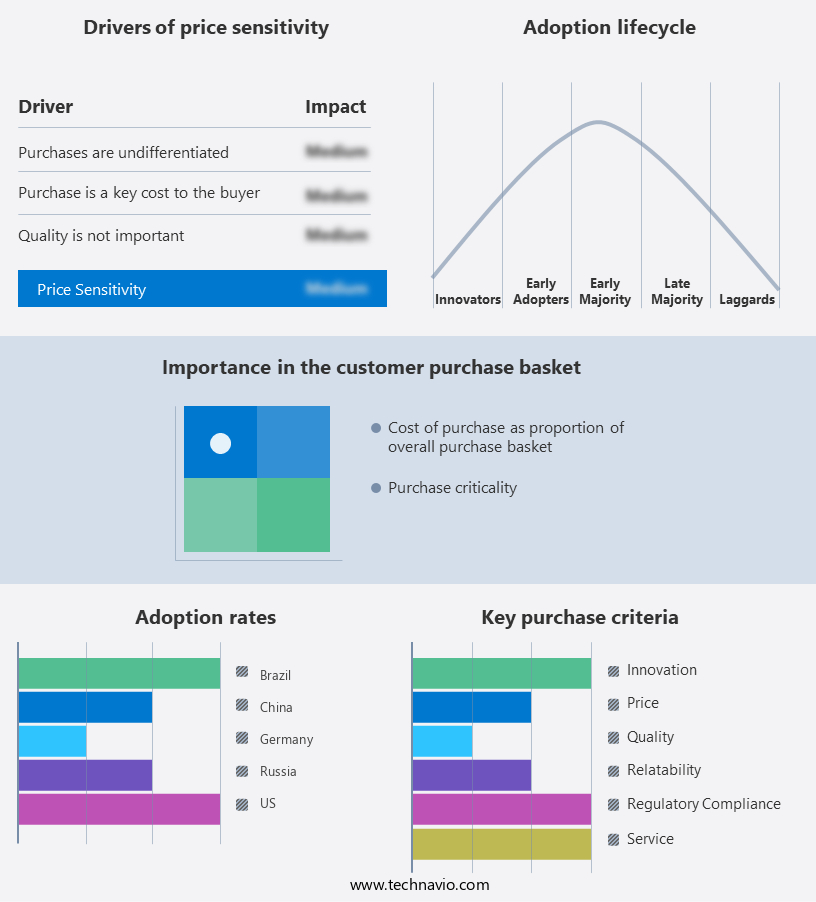
The rfid tags for livestock management market forecasting report includes the adoption lifecycle of the market, covering from the innovator’s stage to the laggard’s stage. It focuses on adoption rates in different regions based on penetration. Furthermore, the rfid tags for livestock management market report also includes key purchase criteria and drivers of price sensitivity to help companies evaluate and develop their market growth analysis strategies.
Customer Landscape of RFID Tags For Livestock Management Industry
Competitive Landscape & Market Insights
Companies are implementing various strategies, such as strategic alliances, rfid tags for livestock management market forecast, partnerships, mergers and acquisitions, geographical expansion, and product/service launches, to enhance their presence in the industry.
Allflex Group - The company specializes in RFID tag solutions, including NLIS Cattle Tags compatible with UltraMatic, Universal, and Identiplier applicators. These tags facilitate efficient livestock management through advanced tracking technology.
The industry research and growth report includes detailed analyses of the competitive landscape of the market and information about key companies, including:
- Allflex Group
- Bartronics India Ltd.
- CoreRFID Ltd.
- Dalton Tags
- Datamars SA
- eAgile Inc.
- Essen Computers Ltd.
- GAO RFID Inc.
- HID Global Corp.
- ID Tech Solutions Pvt. Ltd.
- Impinj Inc.
- Ketchum Mfg. Co Inc.
- Mojix Inc.
- National Band and Tag Co.
- NXP Semiconductors NV
- Omnia Technologies Pvt. Ltd.
- RFID Inc.
- Siemens AG
- Tag Factory
- Zebra Technologies Corp.
Qualitative and quantitative analysis of companies has been conducted to help clients understand the wider business environment as well as the strengths and weaknesses of key industry players. Data is qualitatively analyzed to categorize companies as pure play, category-focused, industry-focused, and diversified; it is quantitatively analyzed to categorize companies as dominant, leading, strong, tentative, and weak.
Recent Development and News in RFID Tags For Livestock Management Market
- In January 2024, Livestock Management Solutions (LMS), a leading provider of RFID technology for livestock tracking, announced the launch of their new generation RFID ear tags, featuring longer battery life and improved accuracy (LMS press release). These advancements aim to enhance the efficiency and reliability of livestock management for farmers.
- In March 2024, AgroStar, a prominent agritech company, entered into a strategic partnership with LMS to integrate RFID technology into their livestock management services. This collaboration will enable AgroStar to offer comprehensive livestock management solutions to their farmers, expanding their product offerings (AgroStar press release).
- In May 2024, SmartFarm Technologies, a major player in the RFID livestock management market, secured a USD10 million series B funding round, led by Siemens AG, to accelerate the development and deployment of their advanced RFID technology (Crunchbase). This investment will support the company's expansion into new markets and the enhancement of their existing product offerings.
- In April 2025, the European Commission approved the use of RFID technology for livestock identification and tracking within the European Union. This decision marks a significant regulatory milestone for the market, allowing for increased transparency and traceability in the livestock industry across Europe (European Commission press release).
Dive into Technavio’s robust research methodology, blending expert interviews, extensive data synthesis, and validated models for unparalleled RFID Tags For Livestock Management Market insights. See full methodology.
|
Market Scope |
|
|
Report Coverage |
Details |
|
Page number |
215 |
|
Base year |
2024 |
|
Historic period |
2019-2023 |
|
Forecast period |
2025-2029 |
|
Growth momentum & CAGR |
Accelerate at a CAGR of 11.3% |
|
Market growth 2025-2029 |
USD 1256.1 million |
|
Market structure |
Fragmented |
|
YoY growth 2024-2025(%) |
9.9 |
|
Key countries |
US, China, Germany, Brazil, UK, Japan, France, Canada, Italy, and India |
|
Competitive landscape |
Leading Companies, Market Positioning of Companies, Competitive Strategies, and Industry Risks |
Research Analyst Overview
- In the dynamic and evolving realm of livestock management, RFID tags have emerged as a game-changer, revolutionizing the way farmers and ranchers monitor and manage their herds. These wireless data transmission devices enable automated data collection, providing insights into behavioral patterns and health records, all crucial for optimizing pasture management and feeding behavior. RFID readers, with extended ranges, facilitate real-time location tracking and animal identification. These systems offer significant advantages over traditional methods, with tag retention rates remaining high despite the rigors of livestock farming. The integration of GPS and database management systems further enhances the capabilities of these livestock tracking systems.
- Behavioral pattern recognition, a key feature, offers farmers valuable insights into feeding behavior analysis and movement patterns. Predictive livestock models, fueled by this data, help in early disease detection and improved herd management. Moreover, these systems enable precision livestock farming, reducing labor costs and increasing production efficiency. Advanced RFID middleware software ensures sensor data accuracy and seamless integration with farm management software. This data is then visualized through data visualization dashboards, providing farmers with actionable insights at their fingertips. Remote health monitoring and automated feeding systems are other significant applications of RFID technology in livestock management.
- Real-time health monitoring metrics and mortality rate prediction help farmers intervene promptly, improving animal welfare and productivity. Environmental monitoring sensors, integrated with RFID technology, provide farmers with valuable data on temperature, humidity, and other environmental factors, contributing to improved herd management and overall farm productivity. In summary, RFID tags and related technologies are transforming livestock management, offering numerous benefits from automated data collection and real-time monitoring to improved herd health and productivity. These systems are increasingly being adopted across the industry, marking a significant shift towards precision farming and data-driven decision-making.
What are the Key Data Covered in this RFID Tags For Livestock Management Market Research and Growth Report?
-
What is the expected growth of the RFID Tags For Livestock Management Market between 2025 and 2029?
-
USD 1.26 billion, at a CAGR of 11.3%
-
-
What segmentation does the market report cover?
-
The report segmented by Type (Cattle, Goats and sheep, and Others), Application (Passive and Active), and Geography (North America, Europe, APAC, South America, and Middle East and Africa)
-
-
Which regions are analyzed in the report?
-
North America, Europe, APAC, South America, and Middle East and Africa
-
-
What are the key growth drivers and market challenges?
-
Regulations regarding animal welfare, High cost of active RFID tags
-
-
Who are the major players in the RFID Tags For Livestock Management Market?
-
Key Companies Allflex Group, Bartronics India Ltd., CoreRFID Ltd., Dalton Tags, Datamars SA, eAgile Inc., Essen Computers Ltd., GAO RFID Inc., HID Global Corp., ID Tech Solutions Pvt. Ltd., Impinj Inc., Ketchum Mfg. Co Inc., Mojix Inc., National Band and Tag Co., NXP Semiconductors NV, Omnia Technologies Pvt. Ltd., RFID Inc., Siemens AG, Tag Factory, and Zebra Technologies Corp.
-
Market Research Insights
- RFID tags have emerged as a transformative technology in livestock management, enabling real-time monitoring and efficient data collection. According to industry estimates, the global market for RFID tags in livestock management is projected to reach USD1.5 billion by 2025, growing at a CAGR of 12% from 2020. This growth is driven by the increasing demand for active RFID tags, which offer higher read rates and improved accuracy compared to passive tags. Active RFID tags, with their read rates of up to 10,000 tags per second, contrast significantly with passive tags' read rates of a few hundred tags per second.
- Group behavior monitoring, biometric identification, and individual animal tracking are key applications benefiting from the enhanced performance of active RFID tags. However, challenges persist, such as data integration, compliance regulations, and signal interference issues. Despite these hurdles, the benefits of RFID technology in livestock management, including system scalability, technical support services, and cost-benefit analysis, continue to outweigh the challenges.
We can help! Our analysts can customize this rfid tags for livestock management market research report to meet your requirements.
 RIA -
RIA - 
