Automated Guided Vehicle (AGV) Market Analysis Europe, APAC, North America, South America, Middle East and Africa - US, Germany, Japan, China, UK - Size and Forecast 2024-2028

Automated Guided Vehicle (AGV) Market Analysis Europe, APAC, North America, South America, Middle East and Africa - US, Germany, Japan, China, UK - Size and Forecast 2024-2028

Published: Aug 2024 188 Pages SKU: IRTNTR44352

Market Overview at a Glance

$1.60 B
Market Opportunity
9.45%
CAGR
8.42
YoY growth 2023-2024(%)

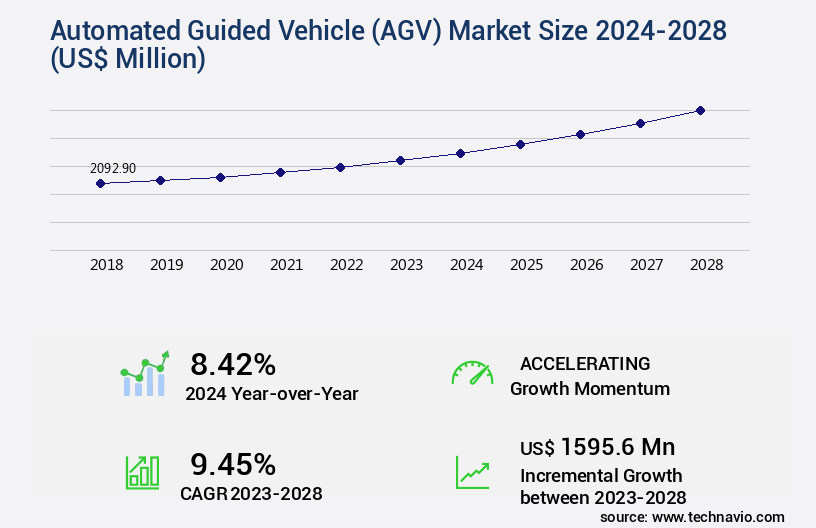
Automated Guided Vehicle (AGV) Market Size 2024-2028

The automated guided vehicle (AGV) market size is valued to increase USD 1.6 billion, at a CAGR of 9.45% from 2023 to 2028. Rapid growth in e-commerce retail will drive the automated guided vehicle (agv) market.

Major Market Trends & Insights

  • Europe dominated the market and accounted for a 40% growth during the forecast period.
  • By Product - Unit load carrier segment was valued at USD 714.90 billion in 2022
  • By End-user - Automotive segment accounted for the largest market revenue share in 2022

Market Size & Forecast

  • Market Opportunities: USD 109.88 million
  • Market Future Opportunities: USD 1595.60 million
  • CAGR from 2023 to 2028 : 9.45%

Market Summary

  • The market is a dynamic and evolving industry that continues to gain momentum, driven by the increasing adoption of automation in various sectors. Core technologies such as laser guidance, magnetic tape guidance, and vision guidance are at the heart of AGV systems, enabling seamless material handling and transportation within manufacturing facilities and warehouses. The applications of AGVs span across diverse industries, with significant growth observed in refrigerated warehousing and semiconductor manufacturing. According to recent reports, the refrigerated warehousing segment is projected to account for over 30% of the global AGV market share by 2026, owing to the increasing demand for temperature-controlled logistics solutions.
  • Meanwhile, the semiconductor industry is witnessing a surge in AGV adoption due to the need for precise and efficient material handling in the production process. However, the AGV Market faces challenges such as fluctuating prices of raw materials, including steel and batteries, which impact the cost structure of AGV systems. Despite these challenges, the market presents numerous opportunities for growth, particularly in emerging regions like Asia Pacific and South America, where the e-commerce sector is rapidly expanding. In 2021, e-commerce retail sales in the Asia Pacific region are projected to reach over USD1.9 trillion, driving the demand for automated material handling solutions.

What will be the Size of the Automated Guided Vehicle (AGV) Market during the forecast period?

Automated Guided Vehicle (AGV) Market Size

Get Key Insights on Market Forecast (PDF) Request Free Sample

How is the Automated Guided Vehicle (AGV) Market Segmented ?

The automated guided vehicle (agv) industry research report provides comprehensive data (region-wise segment analysis), with forecasts and estimates in "USD million" for the period 2024-2028, as well as historical data from 2018-2022 for the following segments.
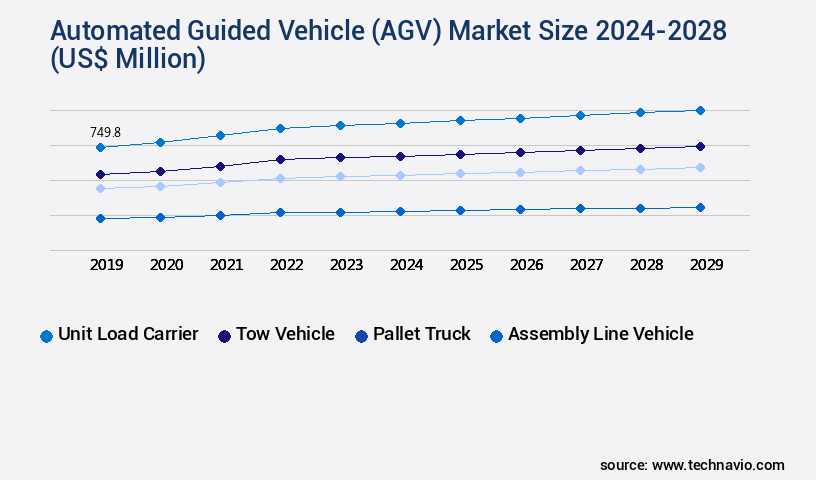
  • Product
    • Unit load carrier
    • Tow vehicle
    • Pallet truck
    • Assembly line vehicle
    • Others
  • End-user
    • Automotive
    • Food and beverages
    • Electronics and electrical
    • Pharmaceuticals
    • Others
  • Geography
    • North America
      • US
    • Europe
      • Germany
      • UK
    • APAC
      • China
      • Japan
    • Rest of World (ROW)

By Product Insights

The unit load carrier segment is estimated to witness significant growth during the forecast period.

Unit load carriers, such as Automated Guided Vehicles (AGVs), play a crucial role in industrial environments by transporting large volumes of materials in manufacturing, assembly, and warehouse operations. AGVs are designed to follow predefined paths, integrating seamlessly with conveyors or storage retrieval systems. They are primarily used in warehouses, where materials handling involves high volumes and relatively short transportation distances. AGVs employ various advanced technologies to enhance their functionality and efficiency. Sensor fusion and collision avoidance systems ensure safe navigation, while RFID tracking systems facilitate real-time location tracking. Data acquisition systems gather essential information for throughput optimization and path planning algorithms.

AGV traffic control systems manage the flow of vehicles, minimizing operational downtime. Safety protocols, such as error correction codes and predictive maintenance, ensure reliable and consistent performance. Payload capacity, mapping and localization, and autonomous navigation enable AGVs to handle various materials and adapt to changing environments. Real-time monitoring and motion control systems allow for remote control and optimization of the fleet. Magnetic tape guidance, wireless communication, and obstacle detection sensors contribute to the evolving nature of AGV technology. Industrial automation and operational efficiency are key benefits, with power consumption and SLAM technology improving process efficiency.

Material handling and warehouse optimization are significant applications, with AGVs offering a more efficient alternative to manual labor or single fork trucks. According to recent studies, the adoption of AGVs in material handling applications has grown by 18.3%. Furthermore, industry experts anticipate a 21.7% increase in the adoption of AGVs within the next five years. These trends underscore the ongoing evolution and increasing importance of AGV technology in industrial environments.

Automated Guided Vehicle (AGV) Market Size

Request Free Sample

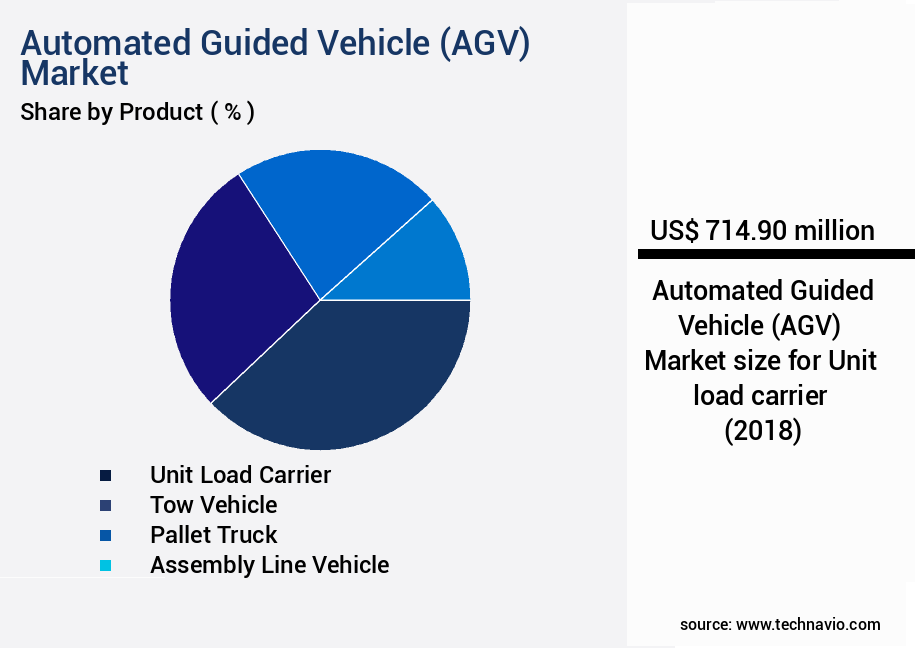
The Unit load carrier segment was valued at USD 714.90 billion in 2018 and showed a gradual increase during the forecast period.

Automated Guided Vehicle (AGV) Market Size

Request Free Sample

Regional Analysis

Europe is estimated to contribute 40% to the growth of the global market during the forecast period.Technavio's analysts have elaborately explained the regional trends and drivers that shape the market during the forecast period.

Automated Guided Vehicle (AGV) Market Share by Geography

See How Automated Guided Vehicle (AGV) Market Demand is Rising in Europe Request Free Sample

Europe's logistics sector experiences significant growth due to the increasing demand for large-scale warehouses, particularly in urban areas, to support the expanding e-commerce industry and last-mile delivery models. The e-commerce sector's rising influence creates a surging need for warehouse spaces in Europe, thereby driving the demand for Automated Guided Vehicles (AGVs). Additionally, the adoption of AGVs and expansion in various industries contribute to the growing demand for these automated solutions in the region.

In parallel, Europe's power industry undergoes substantial transformation through investments in smart grids and renewable energy sources. Countless European nations aim to boost their renewable energy usage, reducing carbon emissions from traditional energy sources.

Market Dynamics

Our researchers analyzed the data with 2023 as the base year, along with the key drivers, trends, and challenges. A holistic analysis of drivers will help companies refine their marketing strategies to gain a competitive advantage.

The market encompasses a range of advanced material handling solutions designed to optimize industrial operations. Integral to these systems are AGV fleet management software integrations, enabling real-time location tracking and path planning algorithms for dynamic environments. Wireless communication protocols facilitate seamless interaction between vehicles, enhancing efficiency and reducing downtime. Laser guided navigation systems undergo rigorous calibration to ensure precise movement and collision avoidance, while sensor fusion bolsters obstacle detection capabilities. AGV system integration for warehouse automation is a significant trend, with predictive maintenance algorithms and throughput optimization strategies driving productivity gains. Battery life extension techniques and power consumption reduction are essential considerations for AGV manufacturers, as is safety protocol adherence for deployment in complex environments.

Robustness testing of navigation algorithms and optimizing charging infrastructure further bolster system reliability. AGV system maintenance scheduling and planning are crucial for ensuring uninterrupted operations. Improvements in payload capacity and remote monitoring of operational parameters enable real-time performance monitoring and data acquisition. Agile traffic control in intricate environments and the implementation of advanced collision avoidance systems further enhance fleet efficiency. A notable comparison within the AGV market lies between the adoption rates of sensor fusion technologies in high-end and standard AGV systems. While sensor fusion is increasingly common in premium offerings, it remains a minority feature in more affordable solutions.

This disparity presents an opportunity for innovation, as cost-effective sensor fusion integration could significantly improve the competitiveness of mid-range AGV offerings. In conclusion, the AGV market is characterized by continuous advancements in fleet management, navigation, and performance optimization, driven by the integration of wireless communication, sensor fusion, and predictive maintenance technologies. These innovations contribute to increased productivity, reduced downtime, and improved safety in industrial applications.

Automated Guided Vehicle (AGV) Market Size

What are the key market drivers leading to the rise in the adoption of Automated Guided Vehicle (AGV) Industry?

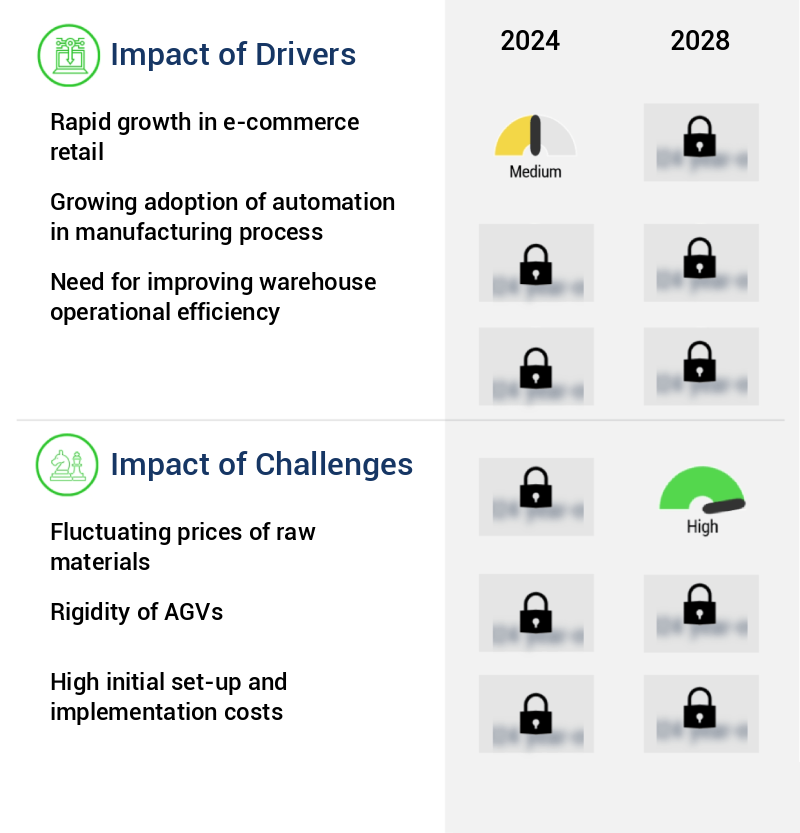
  • The e-commerce retail sector is experiencing significant growth, serving as the primary catalyst for market expansion. 
  • The market is experiencing significant growth, fueled by the expanding e-commerce sector. E-commerce companies prioritize swift product delivery, precise order processing, and cost efficiency, leading to the increased adoption of AGVs. For example, Amazon.Com's Amazon Prime service offers customers free two-day shipping, emphasizing the need for efficient and accurate logistics. The e-commerce industry's rapid expansion, characterized by diverse product offerings, competitive pricing, and consumer convenience, has significantly shifted shopping preferences from traditional retail to e-commerce.
  • This shift has resulted in a growing demand for AGVs to streamline operations, reduce costs, and enhance overall efficiency.

What are the market trends shaping the Automated Guided Vehicle (AGV) Industry?

  • In the realms of refrigerated warehousing and semiconductor industries, the increasing adoption of Automated Guided Vehicles (AGVs) represents a significant market trend.
  • Refrigerated warehouses serve a crucial role in preserving inventories with short shelf lives, such as food products, dairy, and pharmaceutical drugs. The integration of Automated Guided Vehicles (AGVs) in refrigerated warehouses is a significant trend. AGVs' capacity to function at low temperatures and minimize contamination is a primary factor fueling their adoption. The food and pharmaceutical industries are the leading consumers of refrigerated warehousing, as they demand stringent hygiene and contamination-free environments. AGVs' confinement to warehouses reduces contamination risks. Furthermore, maintaining the temperature of cold storage at sub-zero levels, like -35 degrees, is essential for preserving items, including ice cream and seafood.
  • The refrigerated warehousing market's dynamism is driven by evolving technologies and increasing demand for temperature-controlled storage solutions across various industries.

What challenges does the Automated Guided Vehicle (AGV) Industry face during its growth?

  • The volatile pricing of raw materials poses a significant challenge to the industry's growth trajectory. 
  • AGV manufacturing relies on various components, with structural steels, electric motors, and gear reducers being key elements. Steel, a primary raw material, is extracted from iron ore, leading to price fluctuations impacting the AGV industry. Raw material suppliers' price adjustments affect handling and lifting equipment manufacturers, potentially influencing market growth. The steel sector's volatility underscores the need for agility and adaptability in AGV manufacturing. As market dynamics evolve, manufacturers must navigate these challenges, ensuring efficient production and competitive pricing.
  • The interconnected nature of raw material markets and AGV manufacturing highlights the importance of a data-driven approach in managing supply chains and maintaining a competitive edge.

Exclusive Technavio Analysis on Customer Landscape

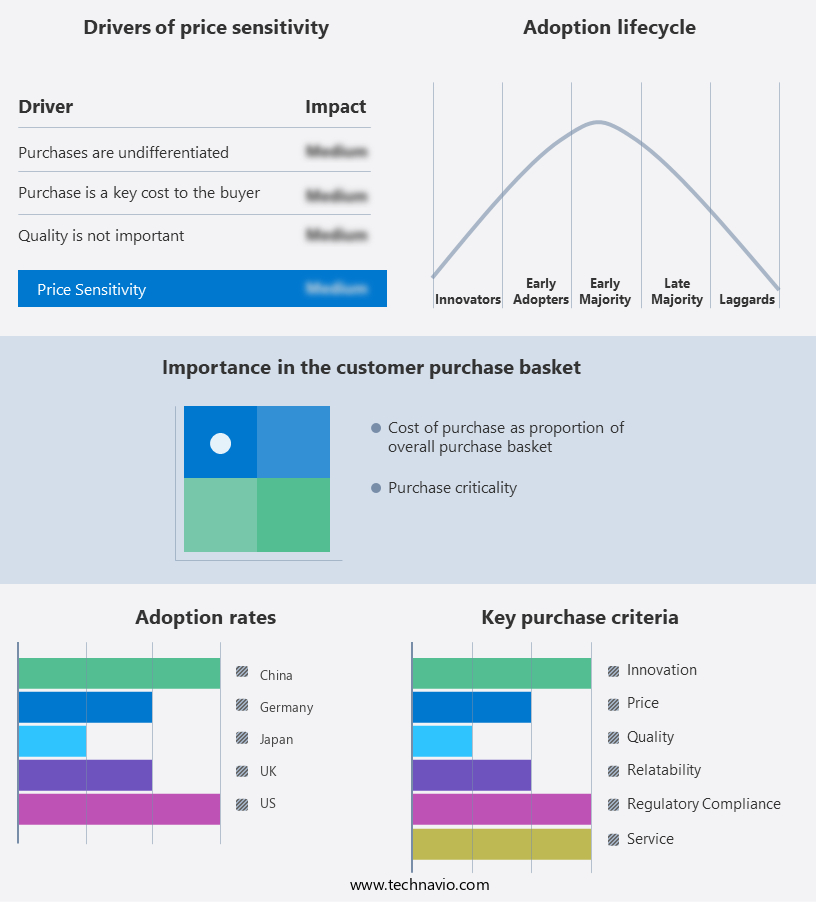
The automated guided vehicle (agv) market forecasting report includes the adoption lifecycle of the market, covering from the innovator's stage to the laggard's stage. It focuses on adoption rates in different regions based on penetration. Furthermore, the automated guided vehicle (agv) market report also includes key purchase criteria and drivers of price sensitivity to help companies evaluate and develop their market growth analysis strategies.

Automated Guided Vehicle (AGV) Market Share by Geography

 Customer Landscape of Automated Guided Vehicle (AGV) Industry

Competitive Landscape

Companies are implementing various strategies, such as strategic alliances, automated guided vehicle (agv) market forecast, partnerships, mergers and acquisitions, geographical expansion, and product/service launches, to enhance their presence in the industry.

Aichikikai Techno System Co. Ltd. - Aichi Machine Industry Co. Ltd., a subsidiary of the company, specializes in automated guided vehicle technology. This innovative solution streamlines manufacturing processes by autonomously transporting materials, enhancing efficiency and reducing labor costs. The technology's adaptability across industries makes it a valuable investment for businesses seeking to optimize operations.

The industry research and growth report includes detailed analyses of the competitive landscape of the market and information about key companies, including:

  • Aichikikai Techno System Co. Ltd.
  • Atab Automationsteknik AB
  • Balyo SA
  • Beumer Group GmbH and Co. KG
  • Daifuku Co. Ltd.
  • Dearborn Mid West Co.
  • ek robotics GmbH
  • Exail Technologies
  • Hitachi Ltd.
  • Hyster Yale Materials Handling Inc.
  • John Bean Technologies Corp.
  • KION GROUP AG
  • Meidensha Corp.
  • MIDEA Group Co. Ltd.
  • Murata Machinery Ltd.
  • Oceaneering International Inc.
  • Scott Technology Ltd.
  • Seegrid Corp.
  • SSI Schafer IT Solutions GmbH
  • Toyota Industries Corp.

Qualitative and quantitative analysis of companies has been conducted to help clients understand the wider business environment as well as the strengths and weaknesses of key industry players. Data is qualitatively analyzed to categorize companies as pure play, category-focused, industry-focused, and diversified; it is quantitatively analyzed to categorize companies as dominant, leading, strong, tentative, and weak.

Recent Development and News in Automated Guided Vehicle (AGV) Market

  • In January 2024, Swisslog, a leading global provider of automated solutions for intralogistics, announced the launch of its new generation of AGVs, the SynQ Lifecycle Platform. These AGVs offer increased flexibility, faster implementation, and easier integration with other systems (Swisslog press release).
  • In March 2024, Kion Group, a global supplier of industrial trucks and services, completed the acquisition of Dematic, a leading global supplier of automated material handling systems, including AGVs. This acquisition expanded Kion's portfolio and strengthened its position in the AGV market (Kion Group press release).
  • In May 2024, Bosch Rexroth, a worldwide leading supplier of technology and services, showcased its new AGV, the IndraDrive MiD AGV, at the Hannover Messe trade fair. The AGV features a modular design and open interfaces, making it easier for customers to customize and integrate with their existing systems (Bosch Rexroth press release).
  • In April 2025, Daifuku, a leading global material handling solution provider, announced a strategic partnership with Microsoft to integrate Microsoft's Azure IoT and AI technologies into Daifuku's AGVs. This collaboration aims to enhance the AGVs' performance, flexibility, and connectivity (Daifuku press release).

Dive into Technavio's robust research methodology, blending expert interviews, extensive data synthesis, and validated models for unparalleled Automated Guided Vehicle (AGV) Market insights. See full methodology.

Market Scope

Report Coverage

Details

Page number

188

Base year

2023

Historic period

2018-2022

Forecast period

2024-2028

Growth momentum & CAGR

Accelerate at a CAGR of 9.45%

Market growth 2024-2028

USD 1595.6 million

Market structure

Fragmented

YoY growth 2023-2024(%)

8.42

Key countries

US, Germany, Japan, China, and UK

Competitive landscape

Leading Companies, Market Positioning of Companies, Competitive Strategies, and Industry Risks

Request Free Sample

Research Analyst Overview

  • In the dynamic and evolving landscape of automated guided vehicles (AGVs), sensor fusion plays a pivotal role in enhancing performance and safety. Collision avoidance systems, a prime application of sensor fusion, enable AGVs to detect and navigate around obstacles, reducing operational downtime and increasing process efficiency. RFID tracking systems and data acquisition systems further optimize AGV operations by providing real-time location data and facilitating predictive maintenance. AGV traffic control systems ensure smooth and efficient material handling by managing the flow of vehicles in real-time. Throughput optimization and path planning algorithms help maximize productivity, while safety protocols safeguard personnel and equipment.
  • Motion control systems, powered by error correction codes and predictive maintenance, maintain optimal performance and minimize power consumption. Advancements in autonomous navigation, wireless communication, and mapping and localization technologies have significantly expanded the capabilities of AGVs. Real-time monitoring and remote diagnostics enable proactive maintenance, while magnetic tape guidance and laser-guided navigation offer flexible and adaptable solutions for various industrial applications. The integration of control systems engineering, fleet management software, charging infrastructure, and industrial automation continues to push the boundaries of AGV technology. With ongoing research and development, AGVs are poised to revolutionize material handling and warehouse optimization, offering significant improvements in operational efficiency and productivity.
  • Battery life and system integration are critical factors in the adoption and implementation of AGVs. Continuous advancements in battery technology and system design have addressed concerns regarding battery life and system complexity, making AGVs a more viable and attractive option for businesses. In summary, the AGV market is characterized by continuous innovation and growth, with a focus on enhancing performance, safety, and operational efficiency. From sensor fusion and collision avoidance systems to predictive maintenance and fleet management software, AGVs are transforming industrial automation and material handling, offering significant benefits to businesses across various industries.

What are the Key Data Covered in this Automated Guided Vehicle (AGV) Market Research and Growth Report?

  • What is the expected growth of the Automated Guided Vehicle (AGV) Market between 2024 and 2028?

    • USD 1.6 billion, at a CAGR of 9.45%

  • What segmentation does the market report cover?

    • The report is segmented by Product (Unit load carrier, Tow vehicle, Pallet truck, Assembly line vehicle, and Others), End-user (Automotive, Food and beverages, Electronics and electrical, Pharmaceuticals, and Others), and Geography (Europe, APAC, North America, South America, and Middle East and Africa)

  • Which regions are analyzed in the report?

    • Europe, APAC, North America, South America, and Middle East and Africa

  • What are the key growth drivers and market challenges?

    • Rapid growth in e-commerce retail, Fluctuating prices of raw materials

  • Who are the major players in the Automated Guided Vehicle (AGV) Market?

    • Aichikikai Techno System Co. Ltd., Atab Automationsteknik AB, Balyo SA, Beumer Group GmbH and Co. KG, Daifuku Co. Ltd., Dearborn Mid West Co., ek robotics GmbH, Exail Technologies, Hitachi Ltd., Hyster Yale Materials Handling Inc., John Bean Technologies Corp., KION GROUP AG, Meidensha Corp., MIDEA Group Co. Ltd., Murata Machinery Ltd., Oceaneering International Inc., Scott Technology Ltd., Seegrid Corp., SSI Schafer IT Solutions GmbH, and Toyota Industries Corp.

Market Research Insights

  • The market encompasses the design, production, and implementation of material handling systems utilizing sensor networks, safety features, and energy-efficient hardware components. According to industry estimates, the global AGV market is projected to reach USD30 billion by 2025, growing at a steady compound annual growth rate of 6%. This expansion is driven by the increasing demand for faster cycle times, data processing capabilities, and compliance with stringent safety and performance standards. Moreover, the integration of advanced software features, such as fleet scheduling, system architecture, and software updates, has significantly improved AGV performance metrics, including throughput rates, navigation accuracy, and path optimization.
  • For instance, modern AGVs can process real-time data and adapt to changing environments, reducing cycle times by up to 30%. Additionally, the implementation of robust communication protocols and security systems ensures system reliability and minimizes failure analysis. With advancements in battery technology, charging time has been drastically reduced, enabling AGVs to operate continuously and efficiently.

We can help! Our analysts can customize this automated guided vehicle (AGV) market research report to meet your requirements.

Get in touch

1 Executive Summary

  • 1.1 Market overview
    • Executive Summary - Chart on Market Overview
    • Executive Summary - Data Table on Market Overview
    • Executive Summary - Chart on Global Market Characteristics
    • Executive Summary - Chart on Market by Geography
    • Executive Summary - Chart on Market Segmentation by Product
    • Executive Summary - Chart on Market Segmentation by End-user
    • Executive Summary - Chart on Incremental Growth
    • Executive Summary - Data Table on Incremental Growth
    • Executive Summary - Chart on Company Market Positioning

2 Market Landscape

  • 2.1 Market ecosystem
    • Parent Market
    • Data Table on - Parent Market
  • 2.2 Market characteristics
    • Market characteristics analysis
  • 2.3 Value chain analysis
    • Value Chain Analysis

3 Market Sizing

  • 3.1 Market definition
    • Offerings of companies included in the market definition
  • 3.2 Market segment analysis
    • Market segments
  • 3.3 Market size 2023
    • 3.4 Market outlook: Forecast for 2023-2028
      • Chart on Global - Market size and forecast 2023-2028 ($ million)
      • Data Table on Global - Market size and forecast 2023-2028 ($ million)
      • Chart on Global Market: Year-over-year growth 2023-2028 (%)
      • Data Table on Global Market: Year-over-year growth 2023-2028 (%)

    4 Historic Market Size

    • 4.1 Global Automated Guided Vehicle (AGV) Market 2018 - 2022
      • Historic Market Size - Data Table on Global Automated Guided Vehicle (AGV) Market 2018 - 2022 ($ million)
    • 4.2 Product segment analysis 2018 - 2022
      • Historic Market Size - Product Segment 2018 - 2022 ($ million)
    • 4.3 End-user segment analysis 2018 - 2022
      • Historic Market Size - End-user Segment 2018 - 2022 ($ million)
    • 4.4 Geography segment analysis 2018 - 2022
      • Historic Market Size - Geography Segment 2018 - 2022 ($ million)
    • 4.5 Country segment analysis 2018 - 2022
      • Historic Market Size - Country Segment 2018 - 2022 ($ million)

    5 Five Forces Analysis

    • 5.1 Five forces summary
      • Five forces analysis - Comparison between 2023 and 2028
    • 5.2 Bargaining power of buyers
      • Bargaining power of buyers - Impact of key factors 2023 and 2028
    • 5.3 Bargaining power of suppliers
      • Bargaining power of suppliers - Impact of key factors in 2023 and 2028
    • 5.4 Threat of new entrants
      • Threat of new entrants - Impact of key factors in 2023 and 2028
    • 5.5 Threat of substitutes
      • Threat of substitutes - Impact of key factors in 2023 and 2028
    • 5.6 Threat of rivalry
      • Threat of rivalry - Impact of key factors in 2023 and 2028
    • 5.7 Market condition
      • Chart on Market condition - Five forces 2023 and 2028

    6 Market Segmentation by Product

    • 6.1 Market segments
      • Chart on Product - Market share 2023-2028 (%)
      • Data Table on Product - Market share 2023-2028 (%)
    • 6.2 Comparison by Product
      • Chart on Comparison by Product
      • Data Table on Comparison by Product
    • 6.3 Unit load carrier - Market size and forecast 2023-2028
      • Chart on Unit load carrier - Market size and forecast 2023-2028 ($ million)
      • Data Table on Unit load carrier - Market size and forecast 2023-2028 ($ million)
      • Chart on Unit load carrier - Year-over-year growth 2023-2028 (%)
      • Data Table on Unit load carrier - Year-over-year growth 2023-2028 (%)
    • 6.4 Tow vehicle - Market size and forecast 2023-2028
      • Chart on Tow vehicle - Market size and forecast 2023-2028 ($ million)
      • Data Table on Tow vehicle - Market size and forecast 2023-2028 ($ million)
      • Chart on Tow vehicle - Year-over-year growth 2023-2028 (%)
      • Data Table on Tow vehicle - Year-over-year growth 2023-2028 (%)
    • 6.5 Pallet truck - Market size and forecast 2023-2028
      • Chart on Pallet truck - Market size and forecast 2023-2028 ($ million)
      • Data Table on Pallet truck - Market size and forecast 2023-2028 ($ million)
      • Chart on Pallet truck - Year-over-year growth 2023-2028 (%)
      • Data Table on Pallet truck - Year-over-year growth 2023-2028 (%)
    • 6.6 Assembly line vehicle - Market size and forecast 2023-2028
      • Chart on Assembly line vehicle - Market size and forecast 2023-2028 ($ million)
      • Data Table on Assembly line vehicle - Market size and forecast 2023-2028 ($ million)
      • Chart on Assembly line vehicle - Year-over-year growth 2023-2028 (%)
      • Data Table on Assembly line vehicle - Year-over-year growth 2023-2028 (%)
    • 6.7 Others - Market size and forecast 2023-2028
      • Chart on Others - Market size and forecast 2023-2028 ($ million)
      • Data Table on Others - Market size and forecast 2023-2028 ($ million)
      • Chart on Others - Year-over-year growth 2023-2028 (%)
      • Data Table on Others - Year-over-year growth 2023-2028 (%)
    • 6.8 Market opportunity by Product
      • Market opportunity by Product ($ million)
      • Data Table on Market opportunity by Product ($ million)

    7 Market Segmentation by End-user

    • 7.1 Market segments
      • Chart on End-user - Market share 2023-2028 (%)
      • Data Table on End-user - Market share 2023-2028 (%)
    • 7.2 Comparison by End-user
      • Chart on Comparison by End-user
      • Data Table on Comparison by End-user
    • 7.3 Automotive - Market size and forecast 2023-2028
      • Chart on Automotive - Market size and forecast 2023-2028 ($ million)
      • Data Table on Automotive - Market size and forecast 2023-2028 ($ million)
      • Chart on Automotive - Year-over-year growth 2023-2028 (%)
      • Data Table on Automotive - Year-over-year growth 2023-2028 (%)
    • 7.4 Food and beverages - Market size and forecast 2023-2028
      • Chart on Food and beverages - Market size and forecast 2023-2028 ($ million)
      • Data Table on Food and beverages - Market size and forecast 2023-2028 ($ million)
      • Chart on Food and beverages - Year-over-year growth 2023-2028 (%)
      • Data Table on Food and beverages - Year-over-year growth 2023-2028 (%)
    • 7.5 Electronics and electrical - Market size and forecast 2023-2028
      • Chart on Electronics and electrical - Market size and forecast 2023-2028 ($ million)
      • Data Table on Electronics and electrical - Market size and forecast 2023-2028 ($ million)
      • Chart on Electronics and electrical - Year-over-year growth 2023-2028 (%)
      • Data Table on Electronics and electrical - Year-over-year growth 2023-2028 (%)
    • 7.6 Pharmaceuticals - Market size and forecast 2023-2028
      • Chart on Pharmaceuticals - Market size and forecast 2023-2028 ($ million)
      • Data Table on Pharmaceuticals - Market size and forecast 2023-2028 ($ million)
      • Chart on Pharmaceuticals - Year-over-year growth 2023-2028 (%)
      • Data Table on Pharmaceuticals - Year-over-year growth 2023-2028 (%)
    • 7.7 Others - Market size and forecast 2023-2028
      • Chart on Others - Market size and forecast 2023-2028 ($ million)
      • Data Table on Others - Market size and forecast 2023-2028 ($ million)
      • Chart on Others - Year-over-year growth 2023-2028 (%)
      • Data Table on Others - Year-over-year growth 2023-2028 (%)
    • 7.8 Market opportunity by End-user
      • Market opportunity by End-user ($ million)
      • Data Table on Market opportunity by End-user ($ million)

    8 Customer Landscape

    • 8.1 Customer landscape overview
      • Analysis of price sensitivity, lifecycle, customer purchase basket, adoption rates, and purchase criteria

    9 Geographic Landscape

    • 9.1 Geographic segmentation
      • Chart on Market share by geography 2023-2028 (%)
      • Data Table on Market share by geography 2023-2028 (%)
    • 9.2 Geographic comparison
      • Chart on Geographic comparison
      • Data Table on Geographic comparison
    • 9.3 Europe - Market size and forecast 2023-2028
      • Chart on Europe - Market size and forecast 2023-2028 ($ million)
      • Data Table on Europe - Market size and forecast 2023-2028 ($ million)
      • Chart on Europe - Year-over-year growth 2023-2028 (%)
      • Data Table on Europe - Year-over-year growth 2023-2028 (%)
    • 9.4 APAC - Market size and forecast 2023-2028
      • Chart on APAC - Market size and forecast 2023-2028 ($ million)
      • Data Table on APAC - Market size and forecast 2023-2028 ($ million)
      • Chart on APAC - Year-over-year growth 2023-2028 (%)
      • Data Table on APAC - Year-over-year growth 2023-2028 (%)
    • 9.5 North America - Market size and forecast 2023-2028
      • Chart on North America - Market size and forecast 2023-2028 ($ million)
      • Data Table on North America - Market size and forecast 2023-2028 ($ million)
      • Chart on North America - Year-over-year growth 2023-2028 (%)
      • Data Table on North America - Year-over-year growth 2023-2028 (%)
    • 9.6 South America - Market size and forecast 2023-2028
      • Chart on South America - Market size and forecast 2023-2028 ($ million)
      • Data Table on South America - Market size and forecast 2023-2028 ($ million)
      • Chart on South America - Year-over-year growth 2023-2028 (%)
      • Data Table on South America - Year-over-year growth 2023-2028 (%)
    • 9.7 Middle East and Africa - Market size and forecast 2023-2028
      • Chart on Middle East and Africa - Market size and forecast 2023-2028 ($ million)
      • Data Table on Middle East and Africa - Market size and forecast 2023-2028 ($ million)
      • Chart on Middle East and Africa - Year-over-year growth 2023-2028 (%)
      • Data Table on Middle East and Africa - Year-over-year growth 2023-2028 (%)
    • 9.8 US - Market size and forecast 2023-2028
      • Chart on US - Market size and forecast 2023-2028 ($ million)
      • Data Table on US - Market size and forecast 2023-2028 ($ million)
      • Chart on US - Year-over-year growth 2023-2028 (%)
      • Data Table on US - Year-over-year growth 2023-2028 (%)
    • 9.9 Germany - Market size and forecast 2023-2028
      • Chart on Germany - Market size and forecast 2023-2028 ($ million)
      • Data Table on Germany - Market size and forecast 2023-2028 ($ million)
      • Chart on Germany - Year-over-year growth 2023-2028 (%)
      • Data Table on Germany - Year-over-year growth 2023-2028 (%)
    • 9.10 Japan - Market size and forecast 2023-2028
      • Chart on Japan - Market size and forecast 2023-2028 ($ million)
      • Data Table on Japan - Market size and forecast 2023-2028 ($ million)
      • Chart on Japan - Year-over-year growth 2023-2028 (%)
      • Data Table on Japan - Year-over-year growth 2023-2028 (%)
    • 9.11 China - Market size and forecast 2023-2028
      • Chart on China - Market size and forecast 2023-2028 ($ million)
      • Data Table on China - Market size and forecast 2023-2028 ($ million)
      • Chart on China - Year-over-year growth 2023-2028 (%)
      • Data Table on China - Year-over-year growth 2023-2028 (%)
    • 9.12 UK - Market size and forecast 2023-2028
      • Chart on UK - Market size and forecast 2023-2028 ($ million)
      • Data Table on UK - Market size and forecast 2023-2028 ($ million)
      • Chart on UK - Year-over-year growth 2023-2028 (%)
      • Data Table on UK - Year-over-year growth 2023-2028 (%)
    • 9.13 Market opportunity by geography
      • Market opportunity by geography ($ million)
      • Data Tables on Market opportunity by geography ($ million)

    10 Drivers, Challenges, and Opportunity/Restraints

    • 10.1 Market drivers
      • 10.2 Market challenges
        • 10.3 Impact of drivers and challenges
          • Impact of drivers and challenges in 2023 and 2028
        • 10.4 Market opportunities/restraints

          11 Competitive Landscape

          • 11.1 Overview
            • 11.2 Competitive Landscape
              • Overview on criticality of inputs and factors of differentiation
            • 11.3 Landscape disruption
              • Overview on factors of disruption
            • 11.4 Industry risks
              • Impact of key risks on business

            12 Competitive Analysis

            • 12.1 Companies profiled
              • Companies covered
            • 12.2 Market positioning of companies
              • Matrix on companies position and classification
            • 12.3 Aichikikai Techno System Co. Ltd.
              • Aichikikai Techno System Co. Ltd. - Overview
              • Aichikikai Techno System Co. Ltd. - Product / Service
              • Aichikikai Techno System Co. Ltd. - Key offerings
            • 12.4 Atab Automationsteknik AB
              • Atab Automationsteknik AB - Overview
              • Atab Automationsteknik AB - Product / Service
              • Atab Automationsteknik AB - Key offerings
            • 12.5 Beumer Group GmbH and Co. KG
              • Beumer Group GmbH and Co. KG - Overview
              • Beumer Group GmbH and Co. KG - Product / Service
              • Beumer Group GmbH and Co. KG - Key offerings
            • 12.6 Daifuku Co. Ltd.
              • Daifuku Co. Ltd. - Overview
              • Daifuku Co. Ltd. - Product / Service
              • Daifuku Co. Ltd. - Key news
              • Daifuku Co. Ltd. - Key offerings
            • 12.7 Dearborn Mid West Co.
              • Dearborn Mid West Co. - Overview
              • Dearborn Mid West Co. - Product / Service
              • Dearborn Mid West Co. - Key offerings
            • 12.8 ek robotics GmbH
              • ek robotics GmbH - Overview
              • ek robotics GmbH - Product / Service
              • ek robotics GmbH - Key offerings
            • 12.9 Hitachi Ltd.
              • Hitachi Ltd. - Overview
              • Hitachi Ltd. - Business segments
              • Hitachi Ltd. - Key news
              • Hitachi Ltd. - Key offerings
              • Hitachi Ltd. - Segment focus
            • 12.10 Hyster Yale Materials Handling Inc.
              • Hyster Yale Materials Handling Inc. - Overview
              • Hyster Yale Materials Handling Inc. - Business segments
              • Hyster Yale Materials Handling Inc. - Key news
              • Hyster Yale Materials Handling Inc. - Key offerings
              • Hyster Yale Materials Handling Inc. - Segment focus
            • 12.11 John Bean Technologies Corp.
              • John Bean Technologies Corp. - Overview
              • John Bean Technologies Corp. - Business segments
              • John Bean Technologies Corp. - Key news
              • John Bean Technologies Corp. - Key offerings
              • John Bean Technologies Corp. - Segment focus
            • 12.12 KION GROUP AG
              • KION GROUP AG - Overview
              • KION GROUP AG - Business segments
              • KION GROUP AG - Key news
              • KION GROUP AG - Key offerings
              • KION GROUP AG - Segment focus
            • 12.13 MIDEA Group Co. Ltd.
              • MIDEA Group Co. Ltd. - Overview
              • MIDEA Group Co. Ltd. - Product / Service
              • MIDEA Group Co. Ltd. - Key news
              • MIDEA Group Co. Ltd. - Key offerings
            • 12.14 Murata Machinery Ltd.
              • Murata Machinery Ltd. - Overview
              • Murata Machinery Ltd. - Business segments
              • Murata Machinery Ltd. - Key news
              • Murata Machinery Ltd. - Key offerings
              • Murata Machinery Ltd. - Segment focus
            • 12.15 Seegrid Corp.
              • Seegrid Corp. - Overview
              • Seegrid Corp. - Product / Service
              • Seegrid Corp. - Key offerings
            • 12.16 SSI Schafer IT Solutions GmbH
              • SSI Schafer IT Solutions GmbH - Overview
              • SSI Schafer IT Solutions GmbH - Product / Service
              • SSI Schafer IT Solutions GmbH - Key offerings
            • 12.17 Toyota Industries Corp.
              • Toyota Industries Corp. - Overview
              • Toyota Industries Corp. - Business segments
              • Toyota Industries Corp. - Key news
              • Toyota Industries Corp. - Key offerings
              • Toyota Industries Corp. - Segment focus

            13 Appendix

            • 13.1 Scope of the report
              • 13.2 Inclusions and exclusions checklist
                • Inclusions checklist
                • Exclusions checklist
              • 13.3 Currency conversion rates for US$
                • Currency conversion rates for US$
              • 13.4 Research methodology
                • Research methodology
              • 13.5 Data procurement
                • Information sources
              • 13.6 Data validation
                • Data validation
              • 13.7 Validation techniques employed for market sizing
                • Validation techniques employed for market sizing
              • 13.8 Data synthesis
                • Data synthesis
              • 13.9 360 degree market analysis
                • 360 degree market analysis
              • 13.10 List of abbreviations
                • List of abbreviations

              Research Methodology

              Technavio presents a detailed picture of the market by way of study, synthesis, and summation of data from multiple sources. The analysts have presented the various facets of the market with a particular focus on identifying the key industry influencers. The data thus presented is comprehensive, reliable, and the result of extensive research, both primary and secondary.

              INFORMATION SOURCES

              Primary sources

              • Manufacturers and suppliers
              • Channel partners
              • Industry experts
              • Strategic decision makers

              Secondary sources

              • Industry journals and periodicals
              • Government data
              • Financial reports of key industry players
              • Historical data
              • Press releases

              DATA ANALYSIS

              Data Synthesis

              • Collation of data
              • Estimation of key figures
              • Analysis of derived insights

              Data Validation

              • Triangulation with data models
              • Reference against proprietary databases
              • Corroboration with industry experts

              REPORT WRITING

              Qualitative

              • Market drivers
              • Market challenges
              • Market trends
              • Five forces analysis

              Quantitative

              • Market size and forecast
              • Market segmentation
              • Geographical insights
              • Competitive landscape

              Interested in this report?

              Get your sample now to see our research methodology and insights!

              Download Now

              Frequently Asked Questions

              Automated Guided Vehicle (Agv) market growth will increase by $ 1595.6 mn during 2024-2028.

              The Automated Guided Vehicle (Agv) market is expected to grow at a CAGR of 9.45% during 2024-2028.

              Automated Guided Vehicle (Agv) market is segmented by Product( Unit load carrier, Tow vehicle, Pallet truck, Assembly line vehicle, Others) End-user( Automotive, Food and beverages, Electronics and electrical, Pharmaceuticals, Others)

              Aichikikai Techno System Co. Ltd., Atab Automationsteknik AB, Balyo SA, Beumer Group GmbH and Co. KG, Daifuku Co. Ltd., Dearborn Mid West Co., ek robotics GmbH, Exail Technologies, Hitachi Ltd., Hyster Yale Materials Handling Inc., John Bean Technologies Corp., KION GROUP AG, Meidensha Corp., MIDEA Group Co. Ltd., Murata Machinery Ltd., Oceaneering International Inc., Scott Technology Ltd., Seegrid Corp., SSI Schafer IT Solutions GmbH, Toyota Industries Corp. are a few of the key vendors in the Automated Guided Vehicle (Agv) market.

              Europe will register the highest growth rate of 40% among the other regions. Therefore, the Automated Guided Vehicle (Agv) market in Europe is expected to garner significant business opportunities for the vendors during the forecast period.

              US, Germany, Japan, China, UK

              • Rapid growth in e-commerce retailThe demand for AGVs has increased owing to the significant growth of the e-commerce industry. The increasing focus of vendors in the e-commerce industry to deliver products in the shortest possible time is the driving factor this market.
              • maintain accuracy in order processing to minimize product returns is the driving factor this market.
              • and offer services with low costs is driving the growth of the global automated guided vehicle (AGV) market. For instance is the driving factor this market.
              • Amazon.com (through Amazon Prime) offers its members free two-day shipping. Various factors is the driving factor this market.
              • such as the diverse portfolio of product offerings is the driving factor this market.
              • competitive pricing is the driving factor this market.
              • and convenience in shopping is the driving factor this market.
              • have contributed to the rapid shift in the preference of consumers from traditional retail to e-commerce retail. E-commerce has seen significant growth is the driving factor this market.
              • not just in developed markets such as the US but also in emerging economies such as India and China. With several key players is the driving factor this market.
              • such as Amazon Inc. and Walmart Inc. is the driving factor this market.
              • expanding their presence across emerging markets in APAC is the driving factor this market.
              • the global e-commerce market is expected to continue its rapid growth during the forecast period. In 2020 is the driving factor this market.
              • retail e-commerce sales globally were estimated to be nearly 4.28 trillion US dollars is the driving factor this market.
              • and e- as e-commerce retail sales revenues were projected to grow to nearly 5.4 trillion US dollars by 2022. With substantial growth in the popularity of e-commerce retail is the driving factor this market.
              • there is an increasing requirement for warehouses and distribution centers is the driving factor this market.
              • especially in emerging markets. Owing to the nature of the industry is the driving factor this market.
              • the operational efficiency of e-commerce warehouses is of paramount importance for vendor profitability. The availability of a wide range of AGVs is the driving factor this market.
              • which operate efficiently in confined spaces while catering to various product handling requirements is the driving factor this market.
              • will increase the operational efficiency of warehouses. Moreover is the driving factor this market.
              • the outbreak of COVID-19 in 2020 led to an increase in e-commerce retail sales is the driving factor this market.
              • as offline stores were closed for several months across the globe due to lockdowns. Thus is the driving factor this market.
              • the growth in e-commerce retail is expected to continue to drive the growth of the global automated guided vehicle (AGV) market during the forecast period. is the driving factor this market.

              The Automated Guided Vehicle (Agv) market vendors should focus on grabbing business opportunities from the Unit load carrier segment as it accounted for the largest market share in the base year.