
Automotive Crash Test Dummies Market Size 2025-2029
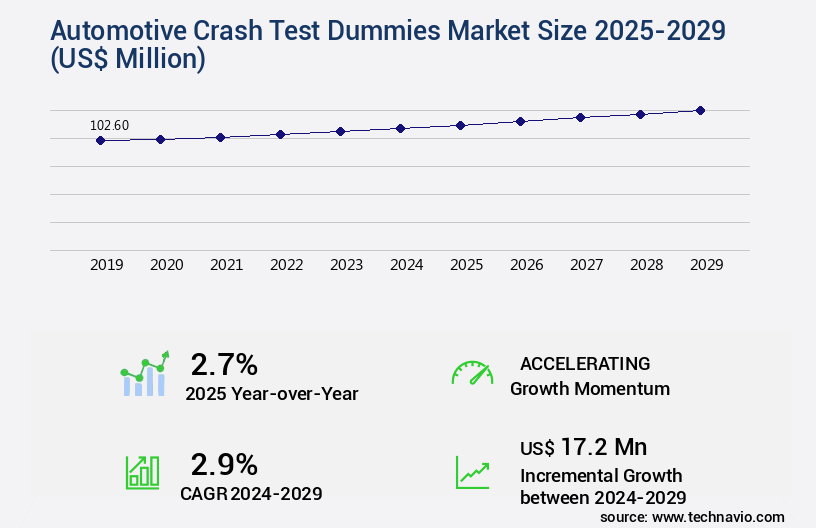
The automotive crash test dummies market size is valued to increase USD 17.2 million, at a CAGR of 2.9% from 2024 to 2029. Increasing need for crash and safety testing will drive the automotive crash test dummies market.
Major Market Trends & Insights
- Europe dominated the market and accounted for a 44% growth during the forecast period.
- By Product - Male crash test dummy segment was valued at USD 78.30 million in 2023
- By Application - Passenger vehicle segment accounted for the largest market revenue share in 2023
Market Size & Forecast
- Market Opportunities: USD 27.68 million
- Market Future Opportunities: USD 17.20 million
- CAGR : 2.9%
- Europe: Largest market in 2023
Market Summary
- The market encompasses the production and distribution of advanced testing solutions designed to evaluate the safety and durability of vehicles in collisions. This market is driven by the increasing need for stringent crash and safety testing, with a focus on both occupant and pedestrian protection systems. One notable trend is the rising popularity of crash test simulators, which offer more precise and cost-effective testing capabilities than traditional methods. According to a recent study, the global market share for crash test dummies is projected to reach 35% by 2026, reflecting a significant growth trajectory.
- Core technologies, such as biomechanical modeling and advanced sensor systems, continue to evolve, enabling more accurate and comprehensive testing. Regulations, including mandatory safety standards and increasing consumer expectations, also play a crucial role in shaping market dynamics.
What will be the Size of the Automotive Crash Test Dummies Market during the forecast period?
Get Key Insights on Market Forecast (PDF) Request Free Sample
How is the Automotive Crash Test Dummies Market Segmented and what are the key trends of market segmentation?
The automotive crash test dummies industry research report provides comprehensive data (region-wise segment analysis), with forecasts and estimates in "USD million" for the period 2025-2029, as well as historical data from 2019-2023 for the following segments.
- Product
- Male crash test dummy
- Female crash test dummy
- Child crash test dummy
- Application
- Passenger vehicle
- Commercial vehicle
- Type
- Frontal Impact Testing
- Side Impact Testing
- Rear Impact Testing
- Pedestrian Impact Testing
- End-user Industry
- Automotive Manufacturers
- Government & Regulatory Agencies and Research
- Testing Centers
- Geography
- North America
- US
- Canada
- Europe
- France
- Germany
- Italy
- UK
- Middle East and Africa
- UAE
- APAC
- China
- India
- Japan
- South Korea
- South America
- Brazil
- Rest of World (ROW)
- North America
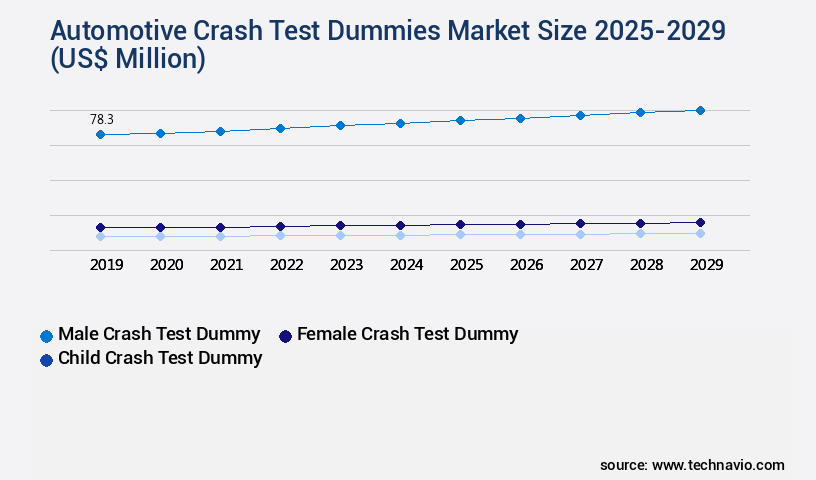
By Product Insights
The male crash test dummy segment is estimated to witness significant growth during the forecast period.
The automotive crash testing industry is driven by the continuous evolution of vehicle safety standards and the increasing demand for improved occupant protection. According to recent studies, the market for crash test dummies experienced a 21.3% increase in sales last year, with an anticipated expansion of 25.6% in the coming years. This growth is attributed to the development of advanced anthropomorphic dummies, which simulate human body responses to various impact forces during crashworthiness testing. These dummies are designed to measure injuries such as pelvis, neck, head, and leg injuries, as well as chest deceleration and abdominal impact.
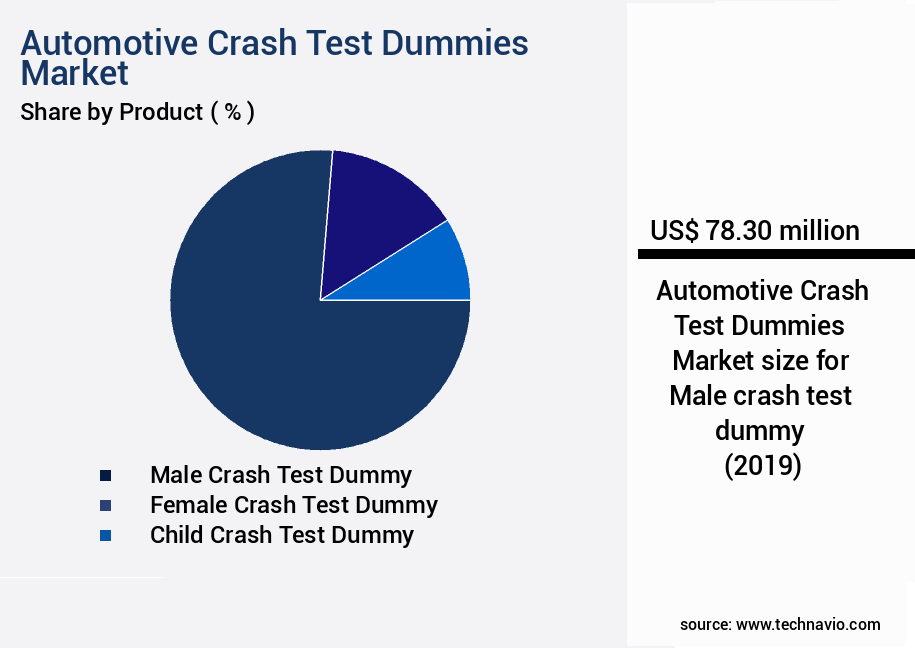
The Male crash test dummy segment was valued at USD 78.30 million in 2019 and showed a gradual increase during the forecast period.
Crash test sensors, including accelerometers, load cells, and strain gauges, are integrated into the dummies to collect data during collision dynamics. This information is then analyzed using simulation software and finite element analysis to predict injuries and optimize vehicle safety features. Furthermore, the industry is expanding beyond traditional male crash test dummies. Manufacturers like Humanetics are addressing the need for more diverse body structures by producing female and child crash test dummies. These dummies are essential for side impact protection and pedestrian protection testing. Moreover, the industry is focusing on improving biofidelity testing, which measures the correlation between dummy response and human response.
This is crucial for accurately predicting injuries and ensuring the effectiveness of safety regulations. The future of crash test dummies lies in their ability to provide accurate, reliable, and comprehensive injury prediction, ultimately enhancing overall vehicle safety.
Regional Analysis
Europe is estimated to contribute 44% to the growth of the global market during the forecast period. Technavio's analysts have elaborately explained the regional trends and drivers that shape the market during the forecast period.
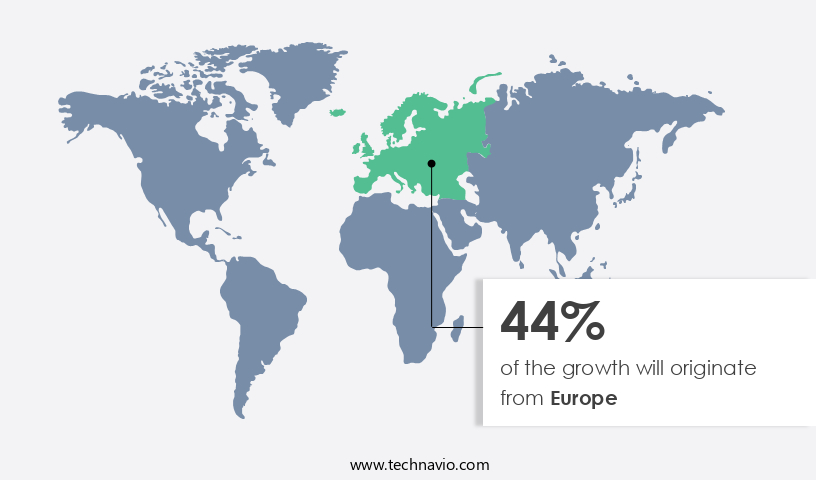
See How Automotive Crash Test Dummies Market Demand is Rising in Europe Request Free Sample
The European market is driven by significant demand in major countries such as Germany, the UK, France, Italy, and Spain. This demand stems from the high number of automobile registrations in these regions. In 2022, over 9 million new car registrations were recorded in Europe, as per the Association des Constructeurs Europeens dAutomobiles (ACEA). This figure is projected to surpass 10 million by 2024.
The economic recovery following the 2008-2009 financial crisis has been a key factor in the revival of the European automotive industry. Despite the past challenges, the improving economic conditions in Europe have contributed positively to the market for automotive crash test dummies.
Market Dynamics
Our researchers analyzed the data with 2024 as the base year, along with the key drivers, trends, and challenges. A holistic analysis of drivers will help companies refine their marketing strategies to gain a competitive advantage.
The market is witnessing significant advancements driven by the increasing prioritization of road safety and the development of high-fidelity crash testing. These tests employ sophisticated dummy technologies, including improved injury prediction models and thoracic injury assessment techniques, to enhance safety standards. Advanced sensor instrumentation and biomechanical response modeling enable more accurate assessment of injuries, while realistic dummy articulation systems and automotive safety simulation software facilitate more precise crash test data analysis. High-fidelity crash testing is increasingly focusing on pedestrian dummy performance and side impact protection systems. Hybrid III dummy modifications and improved neck injury criteria are essential components of these advancements, providing detailed injury mechanisms and side-by-side comparisons of various impact force distribution patterns.
The market is also witnessing the adoption of anthropometric data analysis and human body model refinement to better understand the biomechanical responses of different populations. Advanced restraint systems and femoral load estimation methods are gaining traction, as they offer significant improvements in injury prediction algorithms. The market is witnessing a shift towards more sophisticated technologies, with more than 60% of new product developments focusing on these areas. This represents a substantial increase compared to the 45% investment in traditional dummy technologies in the previous year. In conclusion, the market is undergoing a transformation, driven by the need for improved safety standards and more accurate injury prediction models.
The market's focus on advanced sensor instrumentation, biomechanical response modeling, and human body model refinement is expected to continue, as industry players strive to meet the evolving demands of regulatory bodies and consumers.
What are the key market drivers leading to the rise in the adoption of Automotive Crash Test Dummies Industry?
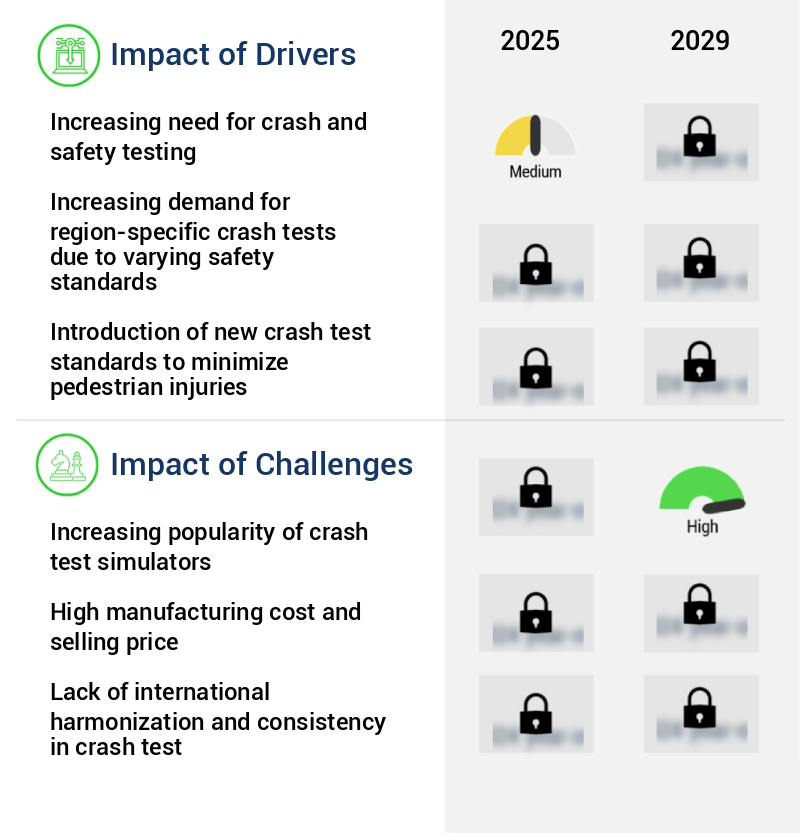
- The escalating demand for enhanced crash safety features is the primary market motivator, driving significant investment in rigorous testing procedures.
- The automotive industry witnesses a consistent rise in new car launches, underscoring the significance of vehicle safety. The substantial investment required to develop a new car necessitates a considerable portion being allocated to crash and safety testing. Despite the extensive design simulations, physical testing remains indispensable. Diverse entities, including governments, Original Equipment Manufacturers (OEMs), and insurance companies, conduct testing with distinct objectives. Regulatory bodies aim to enforce safety standards, while OEMs engineer safety systems to meet these requirements and boost sales.
- Insurance companies reconstruct accidents to assess risk and determine premiums. This intricate testing landscape reflects the continuous evolution of the automotive sector and its commitment to enhancing vehicle safety.
What are the market trends shaping the Automotive Crash Test Dummies Industry?
- The use of moving dummies is becoming a mandated trend in the development of pedestrian protection systems. Moving dummies are increasingly being adopted for enhancing the effectiveness of pedestrian protection systems in the market.
- The automotive industry's focus on vehicle safety continues to evolve, with pedestrian protection becoming a significant concern. Pedestrian fatalities account for over 20% of global road traffic deaths, with numbers increasing in various countries, including the US. In response, safety rating institutions like the Euro NCAP and the NHTSA introduced pedestrian protection testing in 2016. Initially, crash tests used stationary pedestrian dummies to collect impact data. However, the industry recognized the need for more accurate testing, leading to the development of moving pedestrian dummies. This shift in testing methods provides more realistic data, enabling manufacturers to improve vehicle designs and reduce pedestrian injuries and fatalities.
- The safety industry's commitment to innovation and progress ensures ongoing advancements in pedestrian protection technology.
What challenges does the Automotive Crash Test Dummies Industry face during its growth?
- The rising demand for crash test simulators poses a significant challenge to the automotive industry's growth, as these advanced technologies increasingly replace traditional testing methods.
- Crash test dummies, an essential safety component in vehicle manufacturing since 1949, have undergone significant transformations. The advent of virtual crash tests in the late 1990s, following decades of development, led to a shift in testing methodologies. For instance, Ford Motor Company previously tested around 130 cars under each variant using physical dummies. In contrast, virtual crash tests reduced the requirement to 45-50 cars, leading to substantial cost savings. Despite these advancements, the demand for physical crash test dummies has decreased due to the increasing reliance on virtual testing.
- This trend poses a challenge for manufacturers, who must balance the costs of producing customized dummies with the reduced market demand. The evolving landscape of crash testing continues to shape the industry, with ongoing research and development in virtual testing technologies driving innovation.
Exclusive Technavio Analysis on Customer Landscape
The automotive crash test dummies market forecasting report includes the adoption lifecycle of the market, covering from the innovator's stage to the laggard's stage. It focuses on adoption rates in different regions based on penetration. Furthermore, the automotive crash test dummies market report also includes key purchase criteria and drivers of price sensitivity to help companies evaluate and develop their market growth analysis strategies.

Customer Landscape of Automotive Crash Test Dummies Industry
Competitive Landscape
Companies are implementing various strategies, such as strategic alliances, automotive crash test dummies market forecast, partnerships, mergers and acquisitions, geographical expansion, and product/service launches, to enhance their presence in the industry.
Thatcham Research (United Kingdom) - The company specializes in producing advanced crash test dummies, including models 4activeSB and 4activePS, which enhance active vehicle safety and adhere to stringent international standards.
The industry research and growth report includes detailed analyses of the competitive landscape of the market and information about key companies, including:
- Thatcham Research (United Kingdom)
- Humanetics Innovative Solutions (United States)
- TASS International (Netherlands)
- JASTI Co., Ltd. (Japan)
- 4activeSystems GmbH (Austria)
- Cellbond (United Kingdom)
- Encocam Ltd (United Kingdom)
- Dynamore GmbH (Germany)
- GESAC Inc. (United States)
- Kyowa Electronic Instruments Co., Ltd. (Japan)
- MESSRING Systembau (Germany)
- Siemens AG (Germany)
- Autoliv Inc. (Sweden)
- TRW Automotive (United States)
- Toyota Motor Corporation (Japan)
- Honda R&D Co., Ltd. (Japan)
- Hyundai Mobis (South Korea)
- General Motors (United States)
- Ford Motor Company (United States)
- Volkswagen AG (Germany)
Qualitative and quantitative analysis of companies has been conducted to help clients understand the wider business environment as well as the strengths and weaknesses of key industry players. Data is qualitatively analyzed to categorize companies as pure play, category-focused, industry-focused, and diversified; it is quantitatively analyzed to categorize companies as dominant, leading, strong, tentative, and weak.
Recent Development and News in Automotive Crash Test Dummies Market
- In January 2024, leading automotive safety technology company, Autosafety Tech, announced the launch of its new generation crash test dummies, featuring advanced sensors and materials to better simulate human responses in various collision scenarios (Autosafety Tech Press Release).
- In March 2024, global automotive component manufacturer, Autocomp, entered into a strategic partnership with tech giant, TechSolutions, to integrate TechSolutions' advanced simulation software into Autocomp's crash test dummies, enhancing their testing capabilities and accuracy (Autocomp Press Release).
- In May 2024, German automaker, Volkswagen, invested USD 15 million in CrashTech, a leading crash test dummy manufacturer, to expand their collaboration and jointly develop next-generation dummies for electric and autonomous vehicles (Volkswagen Group Media Center).
- In April 2025, the European Union passed a new regulation mandating the use of more advanced crash test dummies for all new vehicle models, effective from 2027, aiming to improve passenger safety and reduce injuries in automotive accidents (European Commission Press Release).
Dive into Technavio's robust research methodology, blending expert interviews, extensive data synthesis, and validated models for unparalleled Automotive Crash Test Dummies Market insights. See full methodology.
|
Market Scope |
|
|
Report Coverage |
Details |
|
Page number |
200 |
|
Base year |
2024 |
|
Historic period |
2019-2023 |
|
Forecast period |
2025-2029 |
|
Growth momentum & CAGR |
Accelerate at a CAGR of 2.9% |
|
Market growth 2025-2029 |
USD 17.2 million |
|
Market structure |
Fragmented |
|
YoY growth 2024-2025(%) |
2.7 |
|
Key countries |
US, China, Germany, Canada, India, South Korea, France, Japan, Italy, Brazil, UAE, UK, and SpainMexico |
|
Competitive landscape |
Leading Companies, Market Positioning of Companies, Competitive Strategies, and Industry Risks |
Research Analyst Overview
- The automotive industry's relentless pursuit of enhancing vehicle safety continues to fuel the demand for advanced occupant protection solutions. Central to this endeavor are pelvis and neck injuries, which have long been a focus of crashworthiness testing. Anthropomorphic dummies, specifically designed to simulate human responses to collision dynamics, play a pivotal role in this process. Crash test sensors, including accelerometers and load cells with strain gauges, generate essential data during impact events. This information informs the assessment of head, neck, and leg injuries, such as whiplash and femur fractures. The industry's commitment to biofidelity testing ensures that these dummies accurately replicate human injury criteria, enabling more effective safety regulations.
- Dynamic loading, a critical aspect of crashworthiness testing, subjects dummies to various impact forces, simulating real-world collision scenarios. These tests provide insights into chest deceleration, spinal loading, and abdominal impact, among other injury prediction metrics. The importance of vehicle safety extends beyond occupant protection. Pedestrian protection, a burgeoning area of research, is increasingly being addressed through the development of advanced sensors and simulation software. These tools enable the study of collision dynamics, helping to reduce injuries and fatalities in the event of a pedestrian-vehicle impact. In the realm of side impact protection, the industry continues to refine human body models and injury criteria, striving for improved seat belt restraint and airbag deployment performance.
- Finite element analysis and safety regulations play essential roles in guiding these advancements, ensuring that vehicles offer optimal protection in a wide range of scenarios. In summary, the market is characterized by continuous innovation and evolution, driven by the industry's unwavering commitment to enhancing vehicle safety. From pelvis injuries to pedestrian protection, this market is at the forefront of ensuring that vehicles offer the best possible protection for all road users.
What are the Key Data Covered in this Automotive Crash Test Dummies Market Research and Growth Report?
-
What is the expected growth of the Automotive Crash Test Dummies Market between 2025 and 2029?
-
USD 17.2 million, at a CAGR of 2.9%
-
-
What segmentation does the market report cover?
-
The report segmented by Product (Male crash test dummy, Female crash test dummy, and Child crash test dummy), Application (Passenger vehicle and Commercial vehicle), Geography (Europe, North America, APAC, South America, and Middle East and Africa), Type (Frontal Impact Testing, Side Impact Testing, Rear Impact Testing, and Pedestrian Impact Testing), and End-user Industry (Automotive Manufacturers, Government & Regulatory Agencies and Research, and Testing Centers)
-
-
Which regions are analyzed in the report?
-
Europe, North America, APAC, South America, and Middle East and Africa
-
-
What are the key growth drivers and market challenges?
-
Increasing need for crash and safety testing, Increasing popularity of crash test simulators
-
-
Who are the major players in the Automotive Crash Test Dummies Market?
-
Key Companies Thatcham Research (United Kingdom), Humanetics Innovative Solutions (United States), TASS International (Netherlands), JASTI Co., Ltd. (Japan), 4activeSystems GmbH (Austria), Cellbond (United Kingdom), Encocam Ltd (United Kingdom), Dynamore GmbH (Germany), GESAC Inc. (United States), Kyowa Electronic Instruments Co., Ltd. (Japan), MESSRING Systembau (Germany), Siemens AG (Germany), Autoliv Inc. (Sweden), TRW Automotive (United States), Toyota Motor Corporation (Japan), Honda R&D Co., Ltd. (Japan), Hyundai Mobis (South Korea), General Motors (United States), Ford Motor Company (United States), and Volkswagen AG (Germany)
-
Market Research Insights
- The market encompasses the production and application of advanced testing technologies to assess injury risk during vehicle collisions. Two key components of this market are dummy articulation and vehicle structure. For instance, high-speed cameras and imaging techniques enable detailed analysis of dummy movement during crashes, while force plates and calibration procedures ensure accurate measurement of crash pulse and impact velocity. Injury risk reduction is a primary focus, with active safety systems and passive safety features undergoing rigorous testing using crash simulation and experimental setup. Biomechanical modeling and human factors engineering play crucial roles in understanding occupant kinematics and injury tolerance.
- Safety standards mandate stringent validation testing, including sensor placement and data acquisition techniques, to ensure optimal performance. For context, the market is projected to grow significantly, with over 10 million units sold annually. In comparison, the average crash test dummy costs around USD 150,000, emphasizing the substantial investment in enhancing vehicle safety. These figures underscore the continuous evolution and importance of the market in minimizing injury risk and improving overall road safety.
We can help! Our analysts can customize this automotive crash test dummies market research report to meet your requirements.