
Automotive Diagnostic Scan Tools Market Size 2025-2029
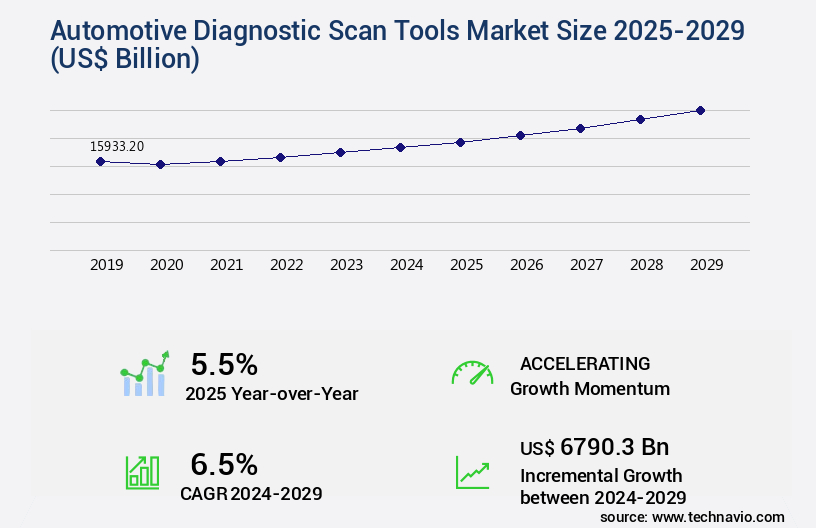
The automotive diagnostic scan tools market size is valued to increase USD 6,790.3 billion, at a CAGR of 6.5% from 2024 to 2029. The increasing complexity of modern vehicles will drive the automotive diagnostic scan tools market.
Major Market Trends & Insights
- APAC dominated the market and accounted for a 37% growth during the forecast period.
- By Vehicle Type - Passenger vehicles segment was valued at USD 10,531.20 billion in 2023
- By Connectivity - Wired diagnostic tools segment accounted for the largest market revenue share in 2023
Market Size & Forecast
- Market Opportunities: USD 58.17 billion
- Market Future Opportunities: USD 6,790.30 billion
- CAGR : 6.5%
- APAC: Largest market in 2023
Market Summary
- The market is a dynamic and ever-evolving landscape driven by the increasing complexity of modern vehicles. Core technologies, such as wireless connectivity and cloud-based platforms, are revolutionizing diagnostic processes, enabling real-time analysis and remote vehicle servicing. Applications span from individual vehicle owners to automotive repair shops and OEMs, with service types ranging from basic engine diagnostics to advanced systems analysis. Despite these opportunities, challenges persist, including the high cost of advanced diagnostic tools and the need for continuous software updates to keep pace with vehicle technology. Regulations, such as the European Union's On-Board Diagnostic (OBD) system, are driving market growth, while regional differences in vehicle types and diagnostic standards add complexity.
- According to recent studies, the market is expected to experience significant expansion in the coming years, with a growing number of vehicle manufacturers and repair shops adopting these tools to enhance efficiency and accuracy in vehicle maintenance. For instance, the European market is projected to account for over 35% of the global market share by 2025. Related markets such as telematics and vehicle connectivity are also experiencing rapid growth, offering opportunities for synergies and innovation in the market. Stay tuned for the latest developments and trends in this dynamic industry.
What will be the Size of the Automotive Diagnostic Scan Tools Market during the forecast period?
Get Key Insights on Market Forecast (PDF) Request Free Sample
How is the Automotive Diagnostic Scan Tools Market Segmented and what are the key trends of market segmentation?
The automotive diagnostic scan tools industry research report provides comprehensive data (region-wise segment analysis), with forecasts and estimates in "USD billion" for the period 2025-2029, as well as historical data from 2019-2023 for the following segments.
- Vehicle Type
- Passenger vehicles
- Commercial vehicles
- Electric vehicles
- Connectivity
- Wired diagnostic tools
- Wireless diagnostic tools
- Channel
- OEM authorized service centers
- Independent garages
- Mobile mechanics
- Product
- PC-based tools
- Hand-held tools
- Geography
- North America
- US
- Canada
- Europe
- France
- Germany
- UK
- APAC
- China
- India
- Japan
- South Korea
- South America
- Brazil
- Rest of World (ROW)
- North America
By Vehicle Type Insights
The passenger vehicles segment is estimated to witness significant growth during the forecast period.
The market experiences significant growth, driven by the increasing complexity of modern vehicles. According to recent reports, the passenger vehicles segment holds the largest market share, accounting for approximately 70% of the revenue. This dominance can be attributed to the expanding global fleet of passenger cars, the integration of advanced driver-assistance systems (ADAS), and stringent emission regulations. Modern passenger vehicles are equipped with numerous electronic systems, including engine diagnostic systems, brake system diagnostics, powertrain control modules, and emission system diagnostics. These systems require precise calibration procedures and real-time monitoring, leading to a growing demand for sophisticated diagnostic tools.
Moreover, the implementation of CAN bus communication, OBD-II scan tools, and wireless diagnostic adapters has revolutionized vehicle diagnostics. These tools enable vehicle network analysis, fault code interpretation, and data logging capabilities, allowing mechanics to efficiently diagnose and repair issues. The market also witnesses the emergence of advanced features such as reprogramming capabilities, system performance monitoring, and proprietary diagnostic software. These tools facilitate live data parameters, real-time data streaming, and J1939 communication, enhancing the diagnostic experience for mechanics and workshops. Furthermore, the adoption of ISO 15031-6 standard and sensor data acquisition has become essential for diagnostic tools. This standard ensures the accuracy and reliability of diagnostic data, while sensor data acquisition enables the analysis of sensor data in real-time, improving overall vehicle performance and safety.
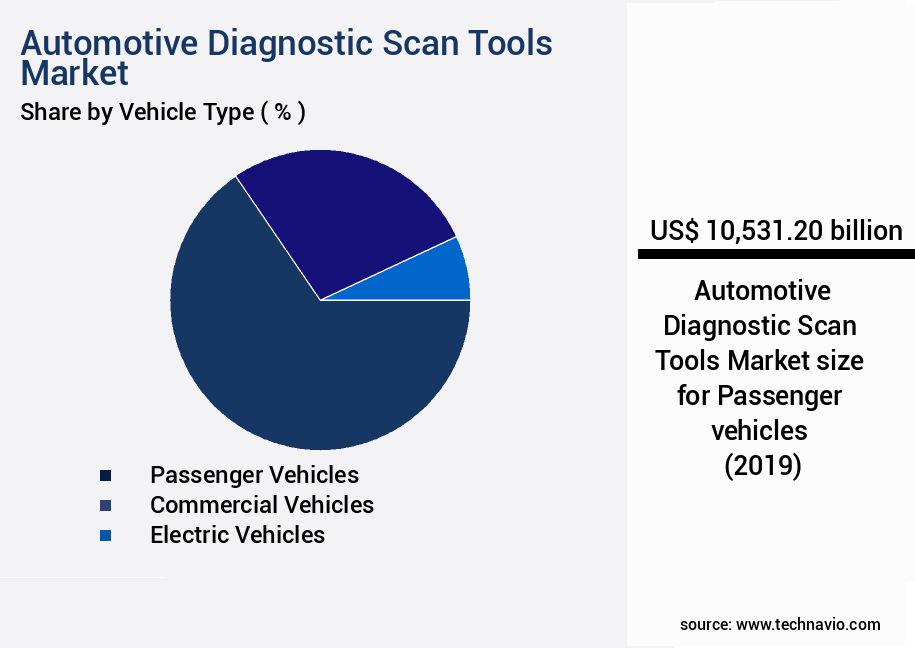
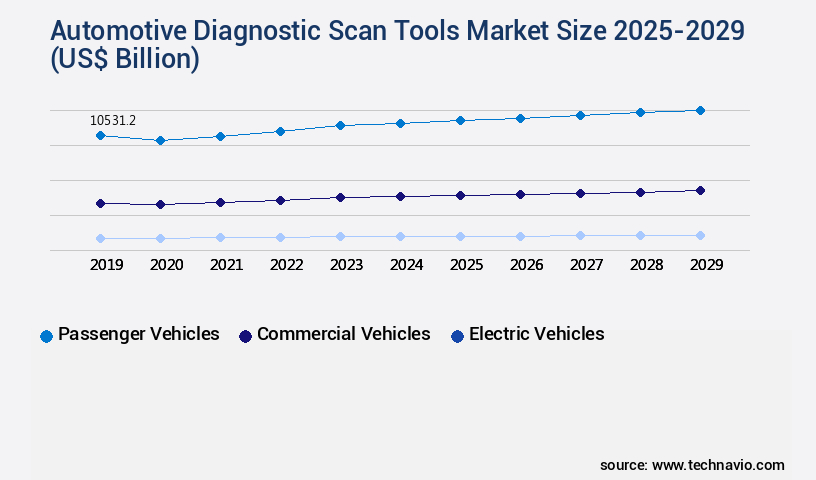
The Passenger vehicles segment was valued at USD 10,531.20 billion in 2019 and showed a gradual increase during the forecast period.
Looking ahead, the market is expected to grow further, with an estimated 30% of workshops adopting advanced diagnostic tools by 2025. The increasing popularity of electric and hybrid vehicles, as well as the ongoing development of autonomous driving technologies, will create new opportunities for diagnostic tool manufacturers. In conclusion, the market is a dynamic and evolving industry, driven by the growing complexity of modern vehicles and the need for precise diagnostics. The adoption of advanced technologies, such as CAN bus communication, OBD-II scan tools, and proprietary diagnostic software, will continue to shape the market landscape, providing opportunities for growth and innovation.
Regional Analysis
APAC is estimated to contribute 37% to the growth of the global market during the forecast period. Technavio's analysts have elaborately explained the regional trends and drivers that shape the market during the forecast period.

See How Automotive Diagnostic Scan Tools Market Demand is Rising in APAC Request Free Sample
The Asia-Pacific (APAC) region, with its rapid industrialization and increasing vehicle ownership, is driving the demand for advanced automotive diagnostic scan tools. These tools are crucial for maintaining vehicle performance, ensuring regulatory compliance, and efficient maintenance. Japan and South Korea, as mature markets, lead the way, while India and ASEAN nations contribute to the industry's growth trajectory. China, as the world's largest vehicle producer, manufactured over 30 million units in 2024, accounting for approximately 33% of global production. In 2025, APAC is projected to account for over 50% of the market share.
With over 1.5 billion vehicles expected on APAC roads by 2030, the demand for diagnostic tools will continue to grow. Additionally, the region's focus on electric vehicles and autonomous driving technologies will further fuel market expansion.
Market Dynamics
Our researchers analyzed the data with 2024 as the base year, along with the key drivers, trends, and challenges. A holistic analysis of drivers will help companies refine their marketing strategies to gain a competitive advantage.
The market is witnessing significant growth due to the increasing complexity of modern vehicles, particularly hybrid and electric vehicles (EVs) that require advanced diagnostic features. OBD-II scan tools for hybrid vehicles are gaining popularity as they offer real-time data streaming for engine diagnostics and fault code interpretation for advanced systems. Moreover, wireless diagnostic adapters for CAN bus systems enable vehicle network analysis using dedicated tools. Data logging capabilities of OBD readers are essential for identifying intermittent faults and system performance monitoring with OBD-II. Bidirectional control module testing protocols and ECU communication protocols for various makes and models ensure accurate diagnostics.
Advanced driver-assistance systems (ADAS) diagnostics and proprietary diagnostic software for specialized repairs are becoming increasingly important as vehicles become more technologically advanced. Sensor calibration procedures for modern vehicles and actuator testing methods for automotive systems are crucial for maintaining vehicle safety and efficiency. Transmission diagnostic testing using scan tools and brake system diagnostics and troubleshooting are other critical applications of automotive diagnostic scan tools. Electrical system testing with advanced features is also essential to ensure vehicle reliability. Comparing the capabilities of different OBD-II scan tools, it is noteworthy that some advanced models offer live data parameters for accurate vehicle analysis.
For instance, Tool A provides up to 10 live data streams, while Tool B offers up to 20 live data streams. This significant difference in live data capabilities can significantly impact the efficiency and accuracy of vehicle diagnostics. In conclusion, the market is evolving rapidly to meet the demands of modern vehicles. Advanced diagnostic features, wireless connectivity, and real-time data streaming are becoming essential for efficient and accurate vehicle diagnostics. The market is expected to continue growing as vehicle complexity increases, and automakers continue to introduce new technologies.
What are the key market drivers leading to the rise in the adoption of Automotive Diagnostic Scan Tools Industry?
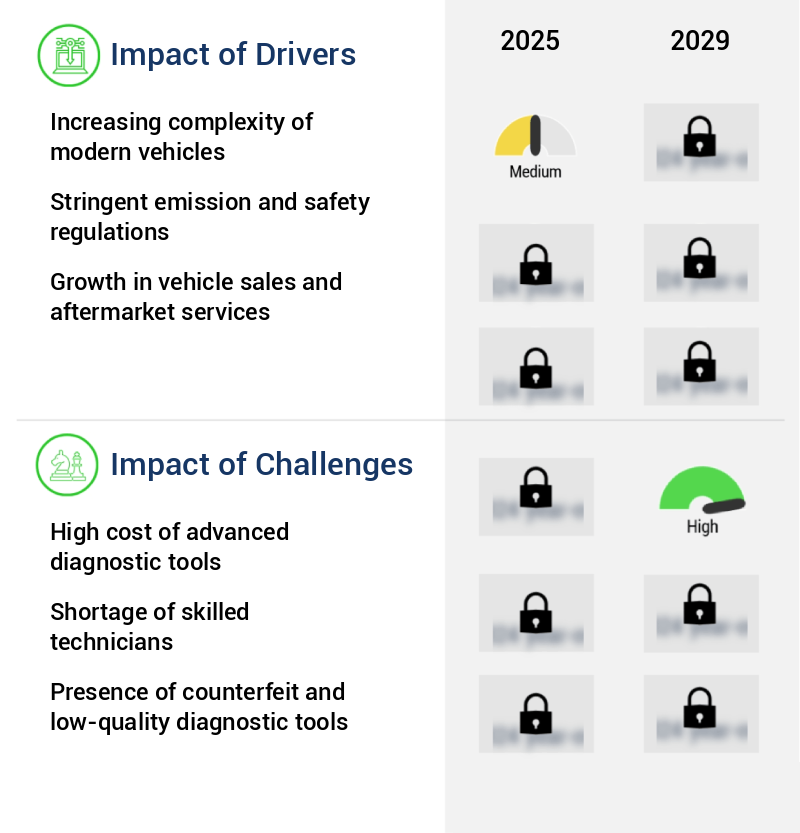
- The escalating complexity of modern vehicles serves as the primary catalyst for market growth.
- The market is driven by the increasing complexity of modern vehicles. Contemporary automobiles are no longer mere mechanical machines; they have transformed into sophisticated systems that incorporate advanced electronics, embedded software, and interconnected sensors. These systems encompass features such as advanced driver-assistance systems, autonomous driving technologies, infotainment platforms, electronic fuel injection, and automatic climate control. Each of these features is governed by electronic control units (ECUs) that manage real-time operations and necessitate precise calibration and monitoring. Modern vehicles typically contain over seventy ECUs, which communicate through protocols such as Controller Area Network (CAN), Local Interconnect Network (LIN), and Ethernet.
- The intricacy of these systems necessitates the use of specialized diagnostic scan tools to ensure efficient and accurate maintenance. As vehicles continue to evolve, the demand for advanced diagnostic tools will persist, with a focus on supporting the integration of emerging technologies like electric and autonomous vehicles. The diagnostic scan tools market is characterized by continuous innovation, with companies investing in research and development to cater to the evolving needs of the automotive industry. This ongoing evolution underscores the importance of staying informed about the latest market trends and advancements to effectively address the diagnostic challenges posed by modern vehicles.
What are the market trends shaping the Automotive Diagnostic Scan Tools Industry?
- Focusing on new product launches is currently a significant market trend. A professional approach prioritizes this area for business growth and innovation.
- The market is experiencing significant advancements, with a focus on new product launches and enhanced functionality. Manufacturers are prioritizing user-centric design, performance, connectivity, and ease of use to cater to both professional technicians and entry-level users. In October 2024, XtoolOnline introduced an extensive range of eight diagnostic tools, including the D5, D5S, D6, D6S, and IP500 series. These tools offer multi-system diagnostics, brand-specific functions, and special service features.
- The commitment to long-term value and technological relevance is underscored by lifetime free updates. The market's evolution reflects the industry's ongoing pursuit of innovation and adaptability to evolving customer needs. This trend is expected to continue, with manufacturers investing in research and development to deliver advanced diagnostic solutions.
What challenges does the Automotive Diagnostic Scan Tools Industry face during its growth?
- The escalating costs of advanced diagnostic tools pose a significant challenge to the industry's growth trajectory.
- The market experiences continuous growth due to the increasing complexity of vehicles, necessitating advanced diagnostic equipment. However, the high cost of these tools poses a significant challenge, particularly for smaller repair shops. For instance, the Autel MaxiSys Ultra EV, designed for electric vehicles, retails at approximately USD 5,999, while the Autel MaxiSys Elite II Pro, a comprehensive diagnostic scanner, is priced around USD 2,799. Premium tools like the Zeus plus from Snap-on can cost up to USD 12,000, with even used models remaining expensive.
- These costs hinder market penetration and accessibility, creating a notable barrier to entry for many businesses. Despite the financial burden, the demand for high-performance diagnostic tools remains robust, as vehicles continue to evolve with advanced electronic systems and software-driven components.
Exclusive Customer Landscape
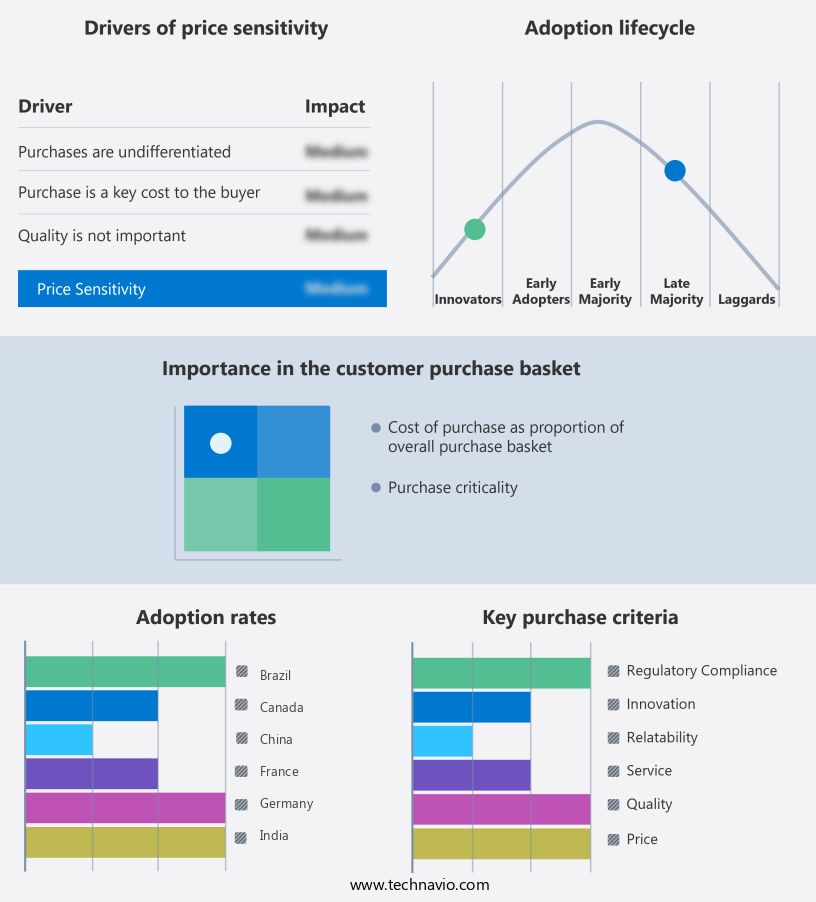
The automotive diagnostic scan tools market forecasting report includes the adoption lifecycle of the market, covering from the innovator's stage to the laggard's stage. It focuses on adoption rates in different regions based on penetration. Furthermore, the automotive diagnostic scan tools market report also includes key purchase criteria and drivers of price sensitivity to help companies evaluate and develop their market growth analysis strategies.
Customer Landscape of Automotive Diagnostic Scan Tools Industry
Competitive Landscape & Market Insights
Companies are implementing various strategies, such as strategic alliances, automotive diagnostic scan tools market forecast, partnerships, mergers and acquisitions, geographical expansion, and product/service launches, to enhance their presence in the industry.
ACTIA Group - This company specializes in providing advanced automotive diagnostic scan tools.
The industry research and growth report includes detailed analyses of the competitive landscape of the market and information about key companies, including:
- ACTIA Group
- Autel Intelligent Technology Co.
- Autocom
- AVL List GmbH
- Continental AG
- Delphi Technologies Plc
- DENSO Corp.
- Fluke Corp.
- HELLA GmbH and Co. KGaA
- Innova Electronics Corp.
- LAUNCH TECH CO.LTD
- MAHLE GmbH
- Robert Bosch GmbH
- Shenzhen Foxwell Technology Co. Ltd.
- Snap On Inc.
- Softing AG
- Vector Informatik GmbH
Qualitative and quantitative analysis of companies has been conducted to help clients understand the wider business environment as well as the strengths and weaknesses of key industry players. Data is qualitatively analyzed to categorize companies as pure play, category-focused, industry-focused, and diversified; it is quantitatively analyzed to categorize companies as dominant, leading, strong, tentative, and weak.
Recent Development and News in Automotive Diagnostic Scan Tools Market
- In January 2024, Bosch Automotive Solutions, a leading global supplier of technology and services, introduced its new Bosch KTS 530 diagnostic tool. This advanced scan tool offers enhanced capabilities for diagnosing complex vehicle systems and is compatible with a broad range of domestic and Asian vehicle makes and models (Bosch press release).
- In March 2024, Snap-on Tools, a renowned provider of diagnostic and repair solutions, announced a strategic partnership with Autodata Solutions, a leading provider of vehicle repair information. This collaboration aims to integrate Autodata's repair information into Snap-on's diagnostic tools, providing repair shops with a more comprehensive solution for vehicle diagnostics and repair (Snap-on Tools press release).
- In May 2024, DYKON, a global manufacturer of automotive diagnostic equipment, completed a series C funding round, raising USD 20 million. This investment will be used to expand its product portfolio, enhance research and development, and strengthen its presence in key markets (DYKON press release).
- In April 2025, the European Union passed a new regulation, mandating the use of diagnostic and repair tools that comply with the European Automotive Aftermarket Association's (EAA) standard for diagnostic tools. This regulation aims to ensure a level playing field for independent repair shops and promote competition in the automotive diagnostic market (European Commission press release).
Dive into Technavio's robust research methodology, blending expert interviews, extensive data synthesis, and validated models for unparalleled Automotive Diagnostic Scan Tools Market insights. See full methodology.
|
Market Scope |
|
|
Report Coverage |
Details |
|
Page number |
246 |
|
Base year |
2024 |
|
Historic period |
2019-2023 |
|
Forecast period |
2025-2029 |
|
Growth momentum & CAGR |
Accelerate at a CAGR of 6.5% |
|
Market growth 2025-2029 |
USD 6790.3 billion |
|
Market structure |
Fragmented |
|
YoY growth 2024-2025(%) |
5.5 |
|
Key countries |
China, US, Germany, India, UK, Canada, Japan, South Korea, Brazil, and France |
|
Competitive landscape |
Leading Companies, Market Positioning of Companies, Competitive Strategies, and Industry Risks |
Research Analyst Overview
- The market is a dynamic and evolving landscape, shaped by advancements in technology and the growing complexity of modern vehicles. Emission system diagnostics have become a crucial aspect of this market, with sensor calibration procedures playing a significant role in ensuring vehicles meet regulatory standards. ECU communication protocols have become more intricate, enabling deeper vehicle analysis and fault code interpretation. Vehicle network analysis and data logging capabilities have expanded, allowing technicians to examine freeze frame data and live data parameters in real-time. This data is essential for diagnosing issues related to electrical system testing, vehicle communication interfaces, and engine diagnostic systems.
- Advanced driver-assistance systems (ADAS) and brake system diagnostics have also gained prominence, requiring specialized diagnostic tools and techniques. OBD-II scan tools have become indispensable, with bidirectional control modules and actuator testing methods enabling comprehensive vehicle diagnostics. The market is continually evolving, with the adoption of CAN bus communication, OBD-II connector types, and ISO 15031-6 standard becoming increasingly common. Proprietary diagnostic software and wireless diagnostic adapters offer real-time data streaming, providing technicians with valuable insights for system performance monitoring and diagnostic software updates. The market's sophistication is further illustrated by the integration of J1939 communication and transmission diagnostic testing, enabling comprehensive analysis of heavy-duty vehicles.
- As vehicles continue to evolve, diagnostic tools must adapt, offering advanced features and capabilities to meet the demands of the automotive industry.
What are the Key Data Covered in this Automotive Diagnostic Scan Tools Market Research and Growth Report?
-
What is the expected growth of the Automotive Diagnostic Scan Tools Market between 2025 and 2029?
-
USD 6790.3 billion, at a CAGR of 6.5%
-
-
What segmentation does the market report cover?
-
The report segmented by Vehicle Type (Passenger vehicles, Commercial vehicles, and Electric vehicles), Connectivity (Wired diagnostic tools and Wireless diagnostic tools), Channel (OEM authorized service centers, Independent garages, and Mobile mechanics), Product (PC-based tools and Hand-held tools), and Geography (APAC, Europe, North America, South America, and Middle East and Africa)
-
-
Which regions are analyzed in the report?
-
APAC, Europe, North America, South America, and Middle East and Africa
-
-
What are the key growth drivers and market challenges?
-
Increasing complexity of modern vehicles, High cost of advanced diagnostic tools
-
-
Who are the major players in the Automotive Diagnostic Scan Tools Market?
-
Key Companies ACTIA Group, Autel Intelligent Technology Co., Autocom, AVL List GmbH, Continental AG, Delphi Technologies Plc, DENSO Corp., Fluke Corp., HELLA GmbH and Co. KGaA, Innova Electronics Corp., LAUNCH TECH CO.LTD, MAHLE GmbH, Robert Bosch GmbH, Shenzhen Foxwell Technology Co. Ltd., Snap On Inc., Softing AG, and Vector Informatik GmbH
-
Market Research Insights
- The market encompasses a diverse range of technologies and applications, from hybrid vehicle diagnostics and emission control diagnostics to advanced diagnostic features and wireless diagnostic solutions. The expansion is driven by the increasing complexity of modern vehicles and the demand for more efficient and accurate diagnostic methods. Engine performance diagnostics and component testing methods continue to dominate the market, with traditional diagnostic connector pinouts remaining the standard for physical access to vehicle systems.
- However, the rise of active diagnostic systems, system level diagnostics, and remote diagnostics is transforming the landscape. Advanced features such as fault tree analysis, OBD reader software, and code reader functions are increasingly integrated into vehicle diagnostic software, enabling more comprehensive and data-driven repair information databases. Furthermore, cloud-based diagnostics, in-vehicle network data acquisition hardware, fuel efficiency monitoring, and electric vehicle diagnostics are gaining traction as key areas of innovation.
We can help! Our analysts can customize this automotive diagnostic scan tools market research report to meet your requirements.
 RIA -
RIA - 
