Automotive E-Compressor Market Size 2024-2029
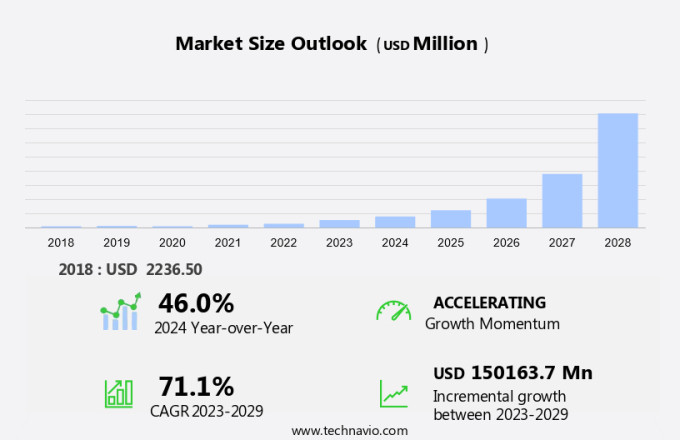
The automotive e-compressor market size is forecast to increase by USD 150.16 billion at a CAGR of 71.1% between 2023 and 2029.
- The market is experiencing significant growth due to the increasing adoption of electric motor-driven HVAC compressors in passenger automobiles and light commercial vehicles (LCVs). This shift is driven by the need to reduce vehicle emissions and improve cabin air quality. Variable e-compressors and displacement e-compressors are gaining popularity due to their ability to provide quieter operation and low oil carryover. The installation of e-compressors requires consideration of the electrical system and storage battery capacity. Strategic alliances among market players are also contributing to market growth. However, the declining automotive production may pose a challenge to market growth. Noise reduction and improving cabin air quality are key priorities for automakers, making e-compressors an essential component in modern vehicles.
What will the size of the market be during the forecast period?
- The market is witnessing significant growth due to the increasing demand for cleaner air and improved climate control systems in vehicles. E-compressors, also known as electric HVAC compressors, play a crucial role in the heating, ventilation, and air conditioning (HVAC) systems of both hybrid and electric vehicles (EVs). HVAC systems are essential components in vehicles, ensuring cabin air quality and maintaining a comfortable climate for passengers. The adoption of e-compressors in these systems is increasing due to their fuel efficiency and lower emissions compared to traditional compressors powered by internal combustion engines (ICEs). E-compressors operate using an electric motor, which consumes less power and generates fewer greenhouse gas emissions compared to ICE-powered compressors. This contributes to the overall reduction of vehicle emissions and the improvement of air quality. The electrical system in a vehicle, including the storage battery, generator, starting motor, lighting system, ignition system, climate control, sensors, electronic control unit, and other components, all require efficient power management. E-compressors are designed to operate with minimal oil carryover, ensuring the electrical system's longevity and reliability. The installation of e-compressors in vehicles is a complex process that requires a thorough understanding of the electrical system's requirements and compatibility with other vehicle components.
- Manufacturers are investing in research and development to simplify the installation process and make it more cost-effective for consumers. The automotive industry is undergoing electrification, with a growing number of manufacturers focusing on the production of EVs and hybrid vehicles. The adoption of e-compressors in these vehicles is expected to increase as manufacturers strive to improve fuel efficiency, reduce emissions, and enhance cabin air quality. In conclusion, the market is experiencing steady growth due to the increasing demand for cleaner air, improved climate control systems, and the electrification trend in the automotive industry. E-compressors offer several advantages, including fuel efficiency, lower emissions, and minimal oil carryover, making them an attractive alternative to traditional compressors. Manufacturers are investing in research and development to simplify the installation process and make e-compressors more accessible to consumers.
How is this market segmented and which is the largest segment?
The market research report provides comprehensive data (region-wise segment analysis), with forecasts and estimates in "USD billion" for the period 2024-2029, as well as historical data from 2018-2022 for the following segments.
- Application
- Passenger cars
- Commercial vehicles
- Geography
- APAC
- China
- India
- Japan
- North America
- Canada
- US
- Europe
- Germany
- UK
- France
- South America
- Brazil
- Middle East and Africa
- APAC
By Application Insights
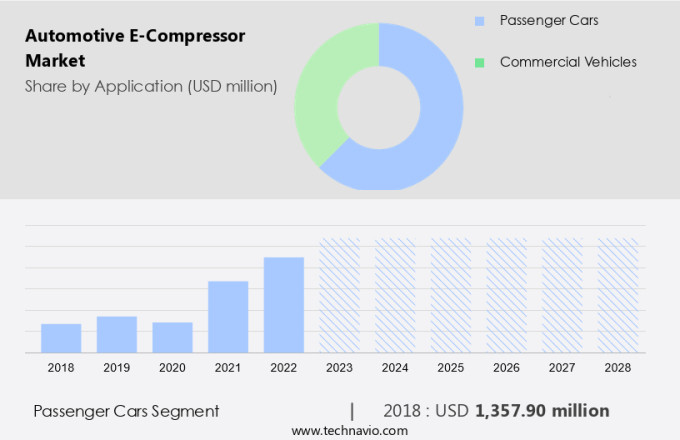
- The passenger cars segment is estimated to witness significant growth during the forecast period.
The global market for automotive e-compressors has seen significant growth, particularly in the passenger cars and light commercial vehicles (LCV) segments. Nearly all passenger car manufacturers have adopted e-compressors, making their penetration rate close to 100%. This trend is driven by the increasing production of passenger cars, as the demand for internal combustion engine (ICE) based cars decreased in 2023 due to the shift towards electric powertrains. The sale of electric passenger cars has been on the rise and is projected to expand further in the coming years. E-compressors, which use electric motors instead of traditional compressors, offer several advantages, including noise reduction, low oil carryover, and improved cabin air quality. These factors have made e-compressors a preferred choice for vehicle manufacturers.
Moreover, the electrical system, including the storage battery, plays a crucial role in the functioning of e-compressors. The market's growth is influenced by various factors, including vehicle emissions regulations and the need for better cabin air quality. The installation of e-compressors helps in reducing vehicle emissions, making them an essential component in the automotive industry. Additionally, the electrical system's advancements have made e-compressors more efficient and cost-effective, further fueling their adoption.
Get a glance at the market report of share of various segments Request Free Sample
The passenger cars segment was valued at USD 1.35 billion in 2018 and showed a gradual increase during the forecast period.
Regional Analysis
- APAC is estimated to contribute 86% to the growth of the global market during the forecast period.
Technavio's analysts have elaborately explained the regional trends and drivers that shape the market during the forecast period.
For more insights on the market share of various regions Request Free Sample
In the Asia Pacific (APAC) region, the market is experiencing significant growth, particularly in the passenger vehicles and light duty vehicles segments. Nearly all passenger cars in APAC are equipped with HVAC (Heating, Ventilation, and Air Conditioning) systems, making it the primary revenue contributor to the market in the region. The adoption of HVAC systems in commercial vehicles is also increasing, fueling the growth of the market in APAC. The region is poised for a swift uptake of plug-in electric vehicles (PEVs) and battery electric vehicles (BEVs) over the forecast period, with China, Japan, and South Korea leading the charge. This trend is attributed to the growing emphasis on fuel-efficient solutions, rapid charging infrastructure development, and the need for thermal management and cooling systems in these vehicles.
Moreover, the reduction of tailpipe emissions and associated healthcare costs are crucial factors driving the demand for e-compressors in the APAC market. Turbocharged engines, which often experience turbo lag and torque transient response issues, can also benefit from the use of e-compressors. As a result, the market in APAC is expected to expand substantially during the forecast period.
Market Dynamics
Our researchers analyzed the data with 2023 as the base year, along with the key drivers, trends, and challenges. A holistic analysis of drivers will help companies refine their marketing strategies to gain a competitive advantage.
What are the key market drivers leading to the rise in adoption of Automotive E-Compressor Market?
Increasing adoption of automotive electric HVAC compressors is the key driver of the market.
- In the automotive industry, traditional HVAC compressors in both Internal Combustion Engine (ICE) vehicles and Electric Vehicles (EVs) have a significant limitation: they are powered by the engine through a drive belt, which increases engine load and leads to increased fuel consumption and exhaust emissions. This issue is particularly relevant in EVs, where reducing exhaust emissions is a top priority. To address this challenge, automotive manufacturers have developed e-compressors, which operate independently using an integrated motor. This innovation eliminates the need for the engine to be running, improving energy efficiency and reducing emissions.
- The e-compressor technology is essential for intelligent climate control systems in EVs, ensuring optimal battery charge levels and enhancing overall vehicle performance. EV charging infrastructure, including charging stations, plays a crucial role in the adoption of e-compressor technology. By utilizing e-compressors, automotive manufacturers can provide more sustainable and efficient climate control systems for their vehicles, aligning with the growing trend towards electrification. Thus, such factors are driving the growth of the market during the forecast period.
What are the market trends shaping the Automotive E-Compressor Market?
Increasing strategic alliances is the upcoming trend in the market.
- The market is characterized by a high level of competition, with numerous global and regional players. These companies are continually innovating and collaborating to expand their customer base and stay ahead of the competition. For instance, Hanon Systems, a key player, announced plans to construct a new USD155 million facility in Woodbridge, Ontario, set to produce e-compressors for electric vehicles. This investment is projected to generate around 300 new jobs. Market participants are focusing on strategies such as product development, partnerships, mergers and acquisitions, and joint ventures to strengthen their market position.
- As the demand for electric vehicles and hybrid HVAC systems grows, the need for efficient and cleaner air conditioning solutions, like electric e-compressors, becomes increasingly important. This trend is further driven by the need to reduce fuel consumption, emissions, and greenhouse gas emissions in line with stricter environmental regulations. The use of lithium-ion batteries in electric vehicles is also fueling the growth of the market. The increasing adoption of autonomous vehicles and the integration of advanced HVAC systems in these vehicles are further expected to boost market growth.
What challenges does Automotive E-Compressor Market face during its growth?
Declining automotive production is a key challenge affecting market growth.
- The automotive industry experienced an unprecedented decline in production of approximately 16% in 2020. This downturn contrasts with the production slump during the 2008-2009 global financial crisis, which was primarily driven by a liquidity crunch. In contrast, the current production decrease is primarily attributed to the shrinking demand for vehicles in major automotive markets. The increasing preference for ride-hailing and ride-sharing services worldwide has further influenced this trend, compelling automakers to adjust production levels accordingly. Smart e-compressors are gaining traction in the automotive sector as an alternative to conventional compressors. Power electronics and inverter systems are integral components of these advanced compressors.
- These compressors are increasingly being adopted in mild hybrid systems, urban logistics, and thermal management systems of compact vehicles. Custom-tailored solutions are being developed to cater to the unique requirements of these applications. The market growth is being driven by the adoption of these compressors in small-capacity vehicles. The use of advanced materials in the production of e-compressors is expected to further boost market growth.
Exclusive Customer Landscape
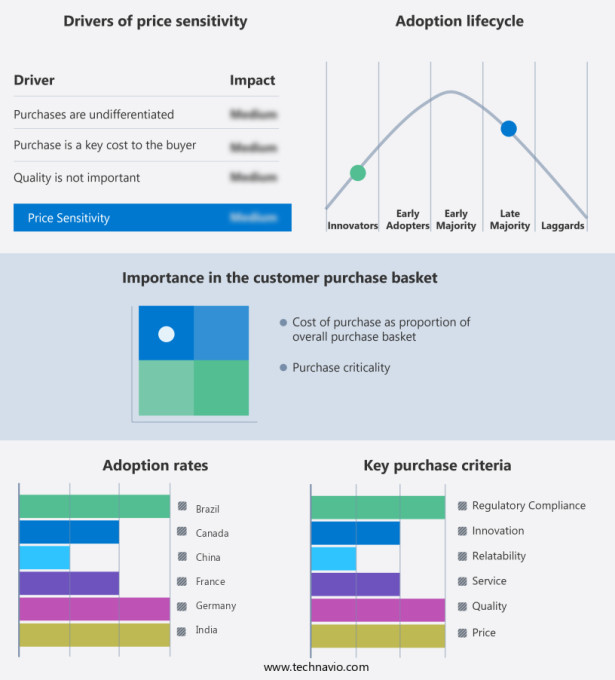
The market forecasting report includes the adoption lifecycle of the market, covering from the innovator's stage to the laggard's stage. It focuses on adoption rates in different regions based on penetration. Furthermore, the market report also includes key purchase criteria and drivers of price sensitivity to help companies evaluate and develop their market growth analysis strategies.
Customer Landscape
Key Companies & Market Insights
Companies are implementing various strategies, such as strategic alliances, market forecast, partnerships, mergers and acquisitions, geographical expansion, and product/service launches, to enhance their presence in the market. The market research and growth report includes detailed analyses of the competitive landscape of the market and information about key companies, including:
- Anhui Dyne Automotive Air Conditioning Co. Ltd.
- BorgWarner Inc.
- Brose Fahrzeugteile SE and Co. KG
- Carl Zeiss Stiftung
- Continental AG
- DENSO Corp.
- Faurecia SE
- Hanon Systems
- Ingersoll Rand Inc.
- MAHLE GmbH
- Marelli Holdings Co. Ltd.
- Mitsubishi Heavy Industries Ltd.
- Panasonic Holdings Corp.
- Robert Bosch GmbH
- Sanden Corp.
- Tata Sons Pvt. Ltd.
- Toyota Motor Corp.
- Valeo SA
- Volkswagen Group
- ZF Friedrichshafen AG
Qualitative and quantitative analysis of companies has been conducted to help clients understand the wider business environment as well as the strengths and weaknesses of key market players. Data is qualitatively analyzed to categorize companies as pure play, category-focused, industry-focused, and diversified; it is quantitatively analyzed to categorize companies as dominant, leading, strong, tentative, and weak.
Research Analyst Overview
The market is witnessing significant growth due to the increasing adoption of electric and hybrid vehicles (EVs and HEVs). These vehicles integrate e-compressors into their HVAC systems to ensure cleaner air and improved climate control. E-compressors, which are electric motor-driven compressors, offer several advantages over conventional compressors. They provide fuel-efficient solutions, reduce tailpipe emissions, and contribute to the reduction of greenhouse gas emissions. Moreover, e-compressors offer autonomous functioning, noise reduction, and low oil carryover, making them an ideal choice for passenger automobiles and light commercial vehicles (LCVs). The integration of e-compressors in EVs and HEVs is essential for thermal management, cooling, and range extenders.
Furthermore, e-compressors are also used in internal combustion engine (ICE) vehicles with mild hybrid systems and turbocharged engines to improve efficiency and reduce emissions. The market for automotive e-compressors is expected to grow further due to the increasing demand for energy efficiency, intelligent climate control, and custom-tailored solutions in the automotive industry. The integration of advanced materials, power electronics, and inverter systems in e-compressors is expected to enhance their performance and reduce their size and weight. The market for automotive e-compressors is expected to witness significant growth in the coming years due to the increasing adoption of EVs and HVAC systems in various vehicle segments, including passenger vehicles, light duty vehicles, buses and coaches, and OEMs.
|
Market Scope |
|
|
Report Coverage |
Details |
|
Page number |
177 |
|
Base year |
2023 |
|
Historic period |
2018-2022 |
|
Forecast period |
2024-2029 |
|
Growth momentum & CAGR |
Accelerate at a CAGR of 71.1% |
|
Market Growth 2024-2029 |
USD 150.16 billion |
|
Market structure |
Fragmented |
|
YoY growth 2023-2024(%) |
46.0 |
|
Key countries |
US, China, Japan, Germany, India, UK, Canada, France, Brazil, and Saudi Arabia |
|
Competitive landscape |
Leading Companies, Market Positioning of Companies, Competitive Strategies, and Industry Risks |
What are the Key Data Covered in this Market Research and Growth Report?
- CAGR of the market during the forecast period
- Detailed information on factors that will drive the market growth and forecasting between 2024 and 2029
- Precise estimation of the size of the market and its contribution of the market in focus to the parent market
- Accurate predictions about upcoming market growth and trends and changes in consumer behaviour
- Growth of the market across APAC, North America, Europe, South America, and Middle East and Africa
- Thorough analysis of the market's competitive landscape and detailed information about companies
- Comprehensive analysis of factors that will challenge the growth of market companies
We can help! Our analysts can customize this market research report to meet your requirements. Get in touch


