Automotive Energy Recovery Systems Market Size 2024-2028
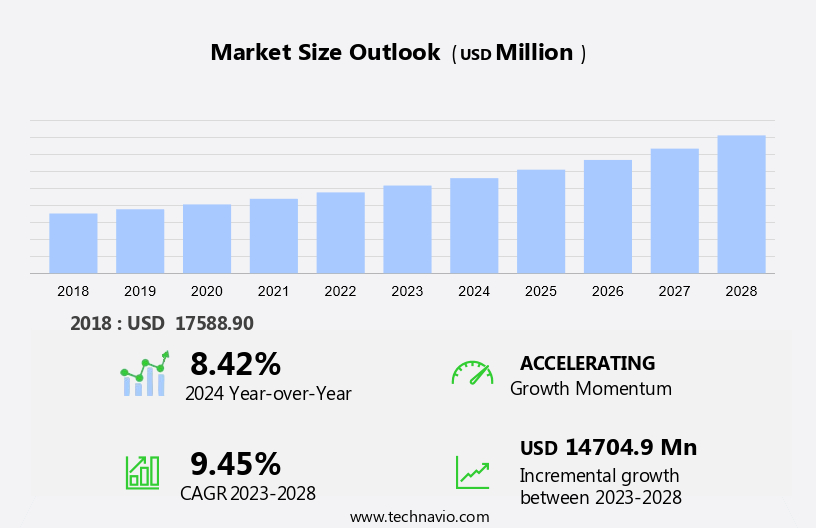
The automotive energy recovery systems market size is forecast to increase by USD 14.7 billion at a CAGR of 9.45% between 2023 and 2028. The market is driven by the increasing demand for electrical energy efficiency in vehicles. Accessories such as regenerative braking systems and e-axles are gaining popularity due to their ability to recover electrical energy in electric vehicles during deceleration and convert it into usable power. In the motorsport industry, waste energy recovery technologies, like motor generators, are being adopted to enhance vehicle performance and reduce fuel consumption. However, the market faces challenges such as the complexity of implementing these systems, which can increase operating costs and adoption costs for manufacturers and consumers. Additionally, the standards for energy recovery systems are continually evolving, requiring continuous investment in research and development.
The automotive industry is witnessing a significant shift towards increased energy efficiency and reduced fuel emissions. One of the most promising solutions to this challenge is the adoption of energy recovery systems in vehicles. These systems enable the capture and utilization of energy that would otherwise be wasted, thereby enhancing vehicle performance and reducing fuel consumption. Fuel Cell Electric Vehicles (FCEVs) equipped with an e-axle are poised to meet stringent fuel emission regulations by providing a zero-emission alternative to traditional internal combustion engine vehicles. Automotive energy recovery systems primarily focus on harnessing power from engine and exhaust gases using waste heat recovery system . These systems employ various technologies such as regenerative braking, electric motors, and e-axles to convert energy into electrical energy.
Furthermore, the electrical energy generated is then stored in batteries, which can be used to power electric accessories or even propel electric vehicles (EVs) and hybrid electric vehicles (HEVs) during certain driving conditions. Regenerative braking is a popular energy recovery technique that utilizes the vehicle's kinetic energy during braking to recharge the batteries. This not only reduces the workload on the conventional braking system but also improves the overall efficiency of the vehicle. The electrical energy generated during braking can be used to power accessories such as air conditioning, lighting, and infotainment systems, reducing the load on the engine and improving fuel economy.
Market Segmentation
The market research report provides comprehensive data (region-wise segment analysis), with forecasts and estimates in "USD billion" for the period 2024-2028, as well as historical data from 2018-2022 for the following segments.
- Product
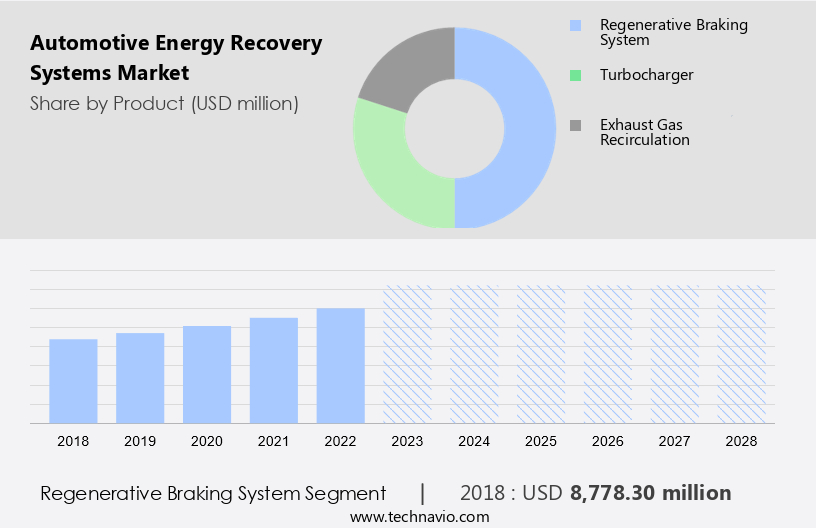
- Regenerative braking system
- Turbocharger
- Exhaust gas recirculation
- Type
- Passenger cars
- Commercial vehicles
- Electric vehicles
- Geography
- APAC
- China
- India
- North America
- Canada
- US
- Europe
- Germany
- South America
- Middle East and Africa
- APAC
By Product Insights
The regenerative braking system segment is estimated to witness significant growth during the forecast period. In the automotive industry, Energy Recovery Systems (ERS) have emerged as a significant innovation, harnessing power from various sources within a vehicle. One such system is the Automotive Regenerative Braking System, which recovers the energy lost during braking. This mechanism converts the vehicle's kinetic energy into electrical energy, which can be used immediately or stored in batteries for later use. The benefits of this system include improved fuel efficiency, enhanced braking performance, and reduced emissions of greenhouse gases. The global trend towards Electric Vehicles (EVs) and the increasing investment in their manufacturing and sales by governments worldwide have fueled the demand for these systems.
For instance, the Indian government's National Electric Mobility Mission Plan 2020 aims to accelerate the adoption of hybrid and electric vehicles in the country. Automakers are integrating ERS into both Diesel-powered and Gasoline-powered vehicles to optimize engine performance and reduce dependence on fossil fuels. Exhaust gases, particularly from the Turbocharger and Exhaust Gas Recirculation systems, are another potential source of energy recovery. By recycling these gases, automakers can further enhance vehicle efficiency and reduce emissions. In summary, Automotive Energy Recovery Systems represent a promising development in the automotive industry, offering improved performance, enhanced fuel efficiency, and reduced emissions. The growing demand for EVs and the increasing focus on sustainability are expected to drive the market's growth in the coming years.
Get a glance at the market share of various segments Request Free Sample
The Regenerative braking system segment was valued at USD 8.77 billion in 2018 and showed a gradual increase during the forecast period.
Regional Insights
APAC is estimated to contribute 45% to the growth of the global market during the forecast period. Technavio's analysts have elaborately explained the regional trends and drivers that shape the market during the forecast period.

For more insights on the market share of various regions Request Free Sample
The market is experiencing significant growth due to increasing focus on improving air quality and reducing carbon footprints. In North America, the trend is particularly prominent in the sales of light trucks and electric passenger cars. Turbocharger heating is a popular technology used in these vehicles to recover energy that would otherwise be lost during braking and deceleration. Electric buses and heavy vehicles, including electric school buses, are also adopting energy recovery systems to enhance net benefits. Safety features, such as electronic stability control, are becoming increasingly important in the automotive industry, further driving the demand for energy recovery systems.
Furthermore, in the APAC region, China and Japan are major contributors to the global market. The Chinese government's initiatives to promote the adoption of electric vehicles (EVs) to combat pollution in urban areas are a significant factor. Strict emission norms and the growing popularity of EVs, particularly among foreign and local Original Equipment Manufacturers (OEMs), are propelling the market forward.
Our researchers analyzed the data with 2023 as the base year, along with the key drivers, trends, and challenges. A holistic analysis of drivers will help companies refine their marketing strategies to gain a competitive advantage.
Market Driver
Increasing traffic congestion and traffic jams are pushing demand for regenerative braking is the key driver of the market. In the face of escalating traffic congestion in metropolitan areas worldwide, the adoption of automotive energy recovery systems in Electric Vehicles (EVs), Plug-in Hybrids (PHEVs), and Hybrid Electric Vehicles (HEVs) is gaining momentum. During braking, these systems capture the kinetic energy that would otherwise be lost due to the engine idling in stop-and-go traffic.
Furthermore, this energy can be stored in advanced battery technology or utilized during acceleration, thereby enhancing the overall energy efficiency of the vehicle. The efficiency of these systems hinges on the performance of the storage system, with an average efficiency of 60%-70% achievable. By converting braking energy into electrical energy, automotive energy recovery systems contribute significantly to reducing energy waste and promoting eco-friendly transportation solutions.
Market Trends
Technological innovations such as waste energy recovery in automotive is the upcoming trend in the market. The utilization of energy recovery systems in the automotive sector refers to the capture and application of excess heat generated by the engine, which would otherwise be discharged into the atmosphere. This technology enhances vehicle energy efficiency, lessens fuel consumption, and decreases emissions. Incentives for improved fuel efficiency and extended driving range are driving the automotive industry to innovate and adopt advanced energy recovery systems. Leading automotive manufacturers are focusing on optimizing energy usage by effectively employing waste heat. Companies such as Brembo and Sensify are at the forefront of this technology, developing subsystem and propulsion analyses to increase electric vehicle efficiency.
Furthermore, regulations mandating reduced carbon emissions and production cost savings further fuel the market expansion for these systems during the forecast period. Valve blocks and heat exchangers are essential components of automotive energy recovery systems. By integrating these systems, automakers can achieve substantial energy savings and contribute to more sustainable transportation solutions. The market growth is influenced by these factors, making it an attractive investment opportunity for businesses and investors in the automotive sector.
Market Challenge
Operational issues and the relatively higher cost of automotive energy recovery systems is a key challenge affecting the market growth. Automotive energy recovery systems offer significant benefits for the US market, particularly in enhancing braking efficiency during stop-and-go traffic, thereby improving fuel economy and decreasing carbon emissions. These systems facilitate engine energy optimization, minimizing energy waste. However, their adoption faces challenges due to their high cost.
Furthermore, the expensive nature of these systems adds to the vehicle's overall price. In the aftermarket, the installation of automotive energy recovery systems becomes even more costly, as they incorporate advanced electronic systems, controllers, and high installation expenses. Despite these challenges, the standards and fuel prices continue to influence the market's growth. The complexity of these systems may also deter some consumers, but the long-term savings on operating costs could justify the initial adoption costs.
Exclusive Customer Landscape
The market forecasting report includes the adoption lifecycle of the market, covering from the innovator's stage to the laggard's stage. It focuses on adoption rates in different regions based on penetration. Furthermore, the report also includes key purchase criteria and drivers of price sensitivity to help companies evaluate and develop their market growth analysis strategies.

Customer Landscape
Key Companies & Market Insights
Companies are implementing various strategies, such as strategic alliances, partnerships, mergers and acquisitions, geographical expansion, and product/service launches, to enhance their presence in the market.
Stellantis- The company offers automotive energy recovery systems such as Regenerative Braking System, the Turbocharger, and the Exhaust Gas Recirculation System.
The market research and growth report includes detailed analyses of the competitive landscape of the market and information about key companies, including:
- Autoliv Inc.
- BorgWarner Inc.
- Continental AG
- Cummins Inc.
- DENSO Corp.
- Gentherm Inc.
- Hitachi Ltd.
- Honeywell International Inc.
- Hyundai Motor Co.
- IHI Corp.
- Mitsubishi Motors Corp.
- Panasonic Holdings Corp.
- Rheinmetall AG
- Ricardo Plc
- Robert Bosch GmbH
- Skeleton Technologies GmbH
- Stellantis NV
- Tenneco Inc.
- UCAP Power Inc.
- ZF Friedrichshafen AG
Qualitative and quantitative analysis of companies has been conducted to help clients understand the wider business environment as well as the strengths and weaknesses of key market players. Data is qualitatively analyzed to categorize companies as pure play, category-focused, industry-focused, and diversified; it is quantitatively analyzed to categorize companies as dominant, leading, strong, tentative, and weak.
Research Analyst Overview
Automotive energy recovery systems have gained significant attention in the global automotive industry as a means to enhance power and efficiency in both conventional and electric vehicles. These systems utilize exhaust gases and braking energy to generate electrical energy, which can be stored in batteries or used directly to boost vehicle performance. Exhaust gas recycling through technologies like exhaust gas recirculation (EGR) and turbochargers, particularly electric turbochargers, play a crucial role in improving engine efficiency and reducing overall emissions. Diesel-powered and gasoline-powered vehicles have adopted these systems to meet stringent fuel economy standards and reduce their carbon footprints. Battery technologies, such as lithium-ion batteries, have been instrumental in the growth of electric vehicles (EVs), plug-in hybrids, and hybrid electric vehicles.
Furthermore, energy recovery systems in EVs, like regenerative braking and coasting, help extend the driving range and reduce reliance on external energy sources. The adoption of automotive energy recovery systems is influenced by various factors, including vehicle type (passenger cars, commercial vehicles, light trucks, heavy vehicles, electric buses, and two-wheelers), product type (electric turbochargers, fuel cell systems, and e-axles), fuel prices, operating costs, and regulations. The net benefits of these systems include improved vehicle performance, reduced emissions, and overall cost savings. Safety features, such as electronic stability control, and evolving infrastructure for electric passenger cars and electric buses, are also driving the market growth.
|
Market Scope |
|
|
Report Coverage |
Details |
|
Page number |
175 |
|
Base year |
2023 |
|
Historic period |
2017-2022 |
|
Forecast period |
2024-2028 |
|
Growth momentum & CAGR |
Accelerate at a CAGR of 9.45% |
|
Market Growth 2024-2028 |
USD 14.70 billion |
|
Market structure |
Fragmented |
|
YoY growth 2023-2024(%) |
8.42 |
|
Regional analysis |
APAC, North America, Europe, South America, and Middle East and Africa |
|
Performing market contribution |
APAC at 45% |
|
Key countries |
China, India, US, Germany, and Canada |
|
Competitive landscape |
Leading Companies, Market Positioning of Companies, Competitive Strategies, and Industry Risks |
|
Key companies profiled |
Autoliv Inc., BorgWarner Inc., Continental AG, Cummins Inc., DENSO Corp., Gentherm Inc., Hitachi Ltd., Honeywell International Inc., Hyundai Motor Co., IHI Corp., Mitsubishi Motors Corp., Panasonic Holdings Corp., Rheinmetall AG, Ricardo Plc, Robert Bosch GmbH, Skeleton Technologies GmbH, Stellantis NV, Tenneco Inc., UCAP Power Inc., and ZF Friedrichshafen AG |
|
Market dynamics |
Parent market analysis, market growth inducers and obstacles, market forecast, fast-growing and slow-growing segment analysis, COVID-19 impact and recovery analysis and future consumer dynamics, market condition analysis for the forecast period |
|
Customization purview |
If our market report has not included the data that you are looking for, you can reach out to our analysts and get segments customized. |
What are the Key Data Covered in this Market Research and Growth Report?
- CAGR of the market during the forecast period
- Detailed information on factors that will drive the market growth and forecasting between 2024 and 2028
- Precise estimation of the size of the market and its contribution of the market in focus to the parent market
- Accurate predictions about upcoming market growth and trends and changes in consumer behaviour
- Growth of the market across APAC, North America, Europe, South America, and Middle East and Africa
- Thorough analysis of the market's competitive landscape and detailed information about companies
- Comprehensive analysis of factors that will challenge the growth of market companies
We can help! Our analysts can customize this market research report to meet your requirements. Get in touch
 RIA -
RIA - 
