
Automotive Service Market Size 2025-2029
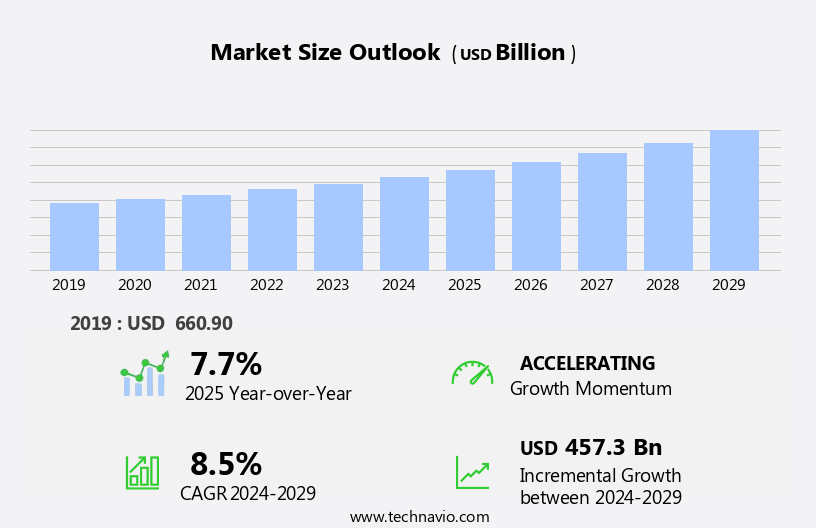
The automotive service market size is forecast to increase by USD 457.3 billion, at a CAGR of 8.5% between 2024 and 2029.
- The market is experiencing significant growth, driven by the increasing vehicle population and the ongoing digitization and electrification trends in the industry. The expanding vehicle base presents a substantial opportunity for service providers, as routine maintenance and repairs remain essential for ensuring the longevity and safety of vehicles. Moreover, the shift towards digitization and electrification is transforming the automotive landscape, with advanced technologies such as telematics, connectivity, and autonomous systems increasingly shaping the service requirements. However, the market faces challenges that necessitate strategic planning and adaptability. Uncertainty in the industry, particularly due to regulatory changes, economic fluctuations, and evolving consumer preferences, poses a significant risk for market participants.
- Additionally, the increasing complexity of vehicles, driven by digitization and electrification, demands a high level of expertise and investment in technology and training for service providers. To capitalize on opportunities and navigate challenges effectively, companies must focus on innovation, collaboration, and flexibility, ensuring they stay ahead of the curve in this dynamic and evolving market.
What will be the Size of the Automotive Service Market during the forecast period?
Explore in-depth regional segment analysis with market size data - historical 2019-2023 and forecasts 2025-2029 - in the full report.
Request Free Sample
The market continues to evolve, with dynamic market activities unfolding across various sectors. Fleet maintenance remains a significant focus, as businesses seek to optimize their vehicle fleets for maximum efficiency and productivity. Steering system repair and drivetrain repair are crucial services, ensuring the smooth operation of vehicles and minimizing downtime. Timing belt replacement and emission system repair are essential for maintaining engine performance and complying with regulatory requirements. Reputation management is increasingly important in the competitive automotive service landscape, with customer satisfaction a key differentiator. Alternator replacement, tire rotation, and A/C repair are common services that impact customer experience and loyalty.
Mobile repair services offer convenience, while engine repair and struts replacement address critical vehicle issues. Service contracts, brake pad replacement, and diagnostic scanners provide value-added services, enhancing customer offerings and shop efficiency. Light bulb replacement and wiper blade replacement are routine services that contribute to overall vehicle maintenance. Exhaust system repair, heating system repair, and electrical system repair address specific vehicle needs. Parts sourcing, ADAS calibration, and paint repair require specialized tools and expertise. Preventive maintenance, fuel system repair, and transmission service ensure vehicle longevity and reduce repair costs. Specialized tools and shop management software streamline operations and improve labor rates.
Market trends include the integration of technology, such as online scheduling, roadside assistance, and performance tuning. Mechanic certification and technician training ensure a skilled workforce, while recall repair and oxygen sensor replacement address safety concerns. Warranty repair and spark plug replacement address manufacturer issues. In the evolving market, continuous adaptation and innovation are essential to meet customer needs and stay competitive.
How is this Automotive Service Industry segmented?
The automotive service industry research report provides comprehensive data (region-wise segment analysis), with forecasts and estimates in "USD billion" for the period 2025-2029, as well as historical data from 2019-2023 for the following segments.
- Type
- Mechanical services
- Exterior and structural services
- Maintenance services
- Vehicle Type
- Passenger cars
- Light commercial vehicles
- Two wheelers
- Heavy commercial vehicles
- Channel
- OEM authorized service centers
- Independent garages
- Mobile repair services
- Digital service platforms
- Geography
- North America
- US
- Canada
- Mexico
- Europe
- France
- Germany
- UK
- APAC
- China
- India
- Japan
- South Korea
- Rest of World (ROW)
- North America
By Type Insights
The mechanical services segment is estimated to witness significant growth during the forecast period.
The market encompasses a range of offerings, from fluid flushes and starter replacement to windshield repair and transmission rebuilding. Customer satisfaction is a key driver in this market, with services such as wheel bearing replacement, fuel injection cleaning, body repair, and detailing services all contributing to maintaining vehicle value and longevity. Advanced technologies, like ADAS calibration and emission system repair, require specialized tools and technician training, further increasing the importance of automotive services. The growing popularity of light commercial vehicles, particularly in emerging markets, fuels the demand for automotive services. Vehicle manufacturers focus on producing light-duty commercial vehicles, like minivans, for cost-sensitive markets, leading to increased sales and subsequent service needs.
Fleet maintenance and commercial vehicle usage further boost the market, with services like engine diagnostics, drivetrain repair, and alignment services ensuring optimal performance and longevity. Customer reviews and reputation management play a crucial role in attracting clients, while appointment scheduling and shop management software streamline operations. Inventory management, preventive maintenance, and performance tuning help maintain efficiency and reduce downtime. Additionally, services like tire rotation, brake pad replacement, and battery replacement ensure the ongoing functionality of vehicles. Automotive services are essential for maintaining the performance and reliability of modern vehicles. As economic activities expand, the demand for automotive services is expected to grow, with a focus on providing efficient, high-quality solutions to meet the evolving needs of consumers and businesses alike.
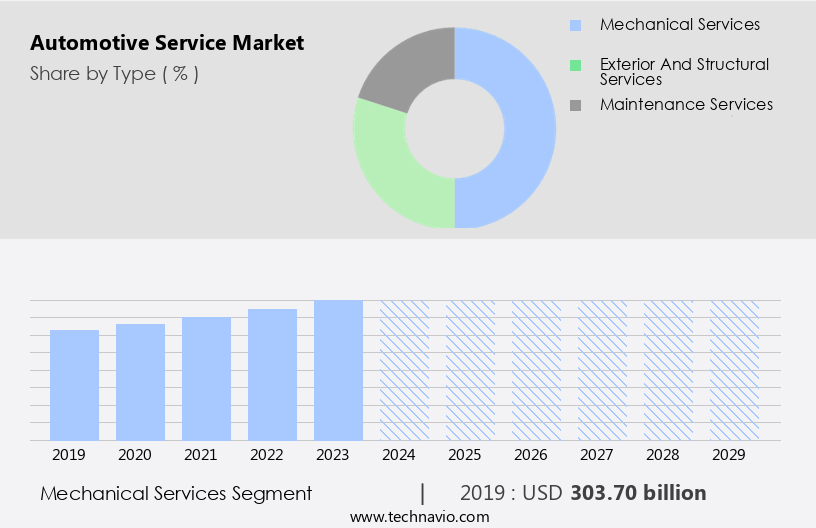
The Mechanical services segment was valued at USD 303.70 billion in 2019 and showed a gradual increase during the forecast period.
Regional Analysis
APAC is estimated to contribute 32% to the growth of the global market during the forecast period. Technavio's analysts have elaborately explained the regional trends and drivers that shape the market during the forecast period.

The market in technologically advanced nations, including the US and Canada, experiences growth due to the development of advanced engines that require regular testing and maintenance. This demand for powertrain testing and related services will propel market expansion during the forecast period. Additionally, the concentration of commercial vehicle manufacturers increases the need for automotive testing, contributing to market growth. Some vehicle manufacturers are relocating production to Mexico to take advantage of labor arbitrage and low costs, resulting in increased vehicle production in the country. This trend, with companies like BMW, KIA MOTORS, Daimler, and Renault-Nissan establishing new facilities, will continue to exhibit robust growth rates.
Automotive services encompass various offerings such as fluid flushes, starter replacement, windshield repair, transmission rebuilding, customer satisfaction, wheel bearing replacement, fuel injection cleaning, body repair, detailing services, exhaust system repair, heating system repair, parts sourcing, ADS calibration, paint repair, electrical system repair, clutch replacement, recall repair, oxygen sensor replacement, mechanic certification, alignment services, CV joint replacement, engine diagnostics, technician training, brake fluid flush, oil changes, engine rebuilding, specialized tools, suspension repair, vehicle maintenance records, car wash, towing services, customer reviews, shock absorber replacement, appointment scheduling, fleet maintenance, steering system repair, drivetrain repair, timing belt replacement, emission system repair, reputation management, alternator replacement, tire rotation, A/C repair, wiper blade replacement, mobile repair, engine repair, struts replacement, service contracts, brake pad replacement, diagnostic scanners, light bulb replacement, waste management, transmission service, warranty repair, spark plug replacement, online scheduling, roadside assistance, battery replacement, shop efficiency, performance tuning, service advisor, inventory management, preventive maintenance, fuel system repair, lift equipment, labor rates, water pump replacement, and shop management software.
These services cater to the diverse needs of the automotive industry, ensuring optimal vehicle performance and longevity.
Market Dynamics
Our researchers analyzed the data with 2024 as the base year, along with the key drivers, trends, and challenges. A holistic analysis of drivers will help companies refine their marketing strategies to gain a competitive advantage.
What are the key market drivers leading to the rise in the adoption of Automotive Service Industry?
- The vehicle population's continual expansion serves as the primary catalyst for market growth. The expansion of the vehicle population represents the primary driving force behind market growth, as this trend continues to shape the industry landscape. The escalating number of vehicles on the road plays a pivotal role in fueling market expansion, making it an essential factor to consider in the automotive industry.
- The market is experiencing significant growth across various regions, with Asia Pacific (APAC) leading the way due to its expanding vehicle production and consumption. The region's rapid industrialization and increasing disposable income have created a vast opportunity for automotive players. In APAC, India and China are particularly noteworthy markets, with large domestic populations driving high vehicle demand. Additionally, China's commitment to electric vehicles and hybrid cars is expected to further boost the market. Mechanic certification, engine diagnostics, and technician training are essential services in demand, as vehicles become increasingly complex. Specialized tools are necessary for alignment services, cv joint replacement, engine rebuilding, suspension repair, shock absorber replacement, and brake fluid flush.
- Vehicle maintenance records are crucial for ensuring the longevity of cars and the accuracy of service history. Car washes and towing services are also essential components of the market. Customer reviews play a significant role in attracting new clients, making appointment scheduling systems and excellent communication skills essential for businesses. Overall, the market is a dynamic and growing industry, driven by the increasing demand for vehicle maintenance and repair services.
What are the market trends shaping the Automotive Service Industry?
- The automotive industry is witnessing a significant shift towards increased vehicle digitization and electrification, which is becoming a prominent market trend. This transition encompasses the integration of advanced technologies and the adoption of electric powertrains in vehicles.
- The automotive industry is experiencing significant advancements due to the integration of technology into modern vehicles. In recent years, electronic systems have increasingly replaced mechanical components, enhancing driver information, reducing fuel consumption, lowering emissions, improving safety, and providing a more enjoyable driving experience. Original Equipment Manufacturers (OEMs) continue to innovate in response to these trends. For instance, the International Energy Agency's (IEA) Global EV Outlook 2024 reports a 25% year-on-year increase in global electric vehicle (EV) sales, surpassing 17 million units. Automotive maintenance services remain essential to keep these advanced vehicles running efficiently. Fleet maintenance, steering system repair, drivetrain repair, timing belt replacement, emission system repair, and service contracts are among the key services in demand.
- Additionally, mobile repair services offer convenience for tire rotation, alternator replacement, a/c repair, wiper blade replacement, and brake pad replacement. Diagnostics play a crucial role in maintaining vehicle performance, with diagnostic scanners essential for identifying issues related to engine repair, struts replacement, and other electronic systems. Light bulb replacement is another common service, ensuring optimal visibility for the driver. Reputation management is increasingly important for automotive service providers, as customer satisfaction and online reviews influence business success. As the automotive industry continues to evolve, service providers must adapt to meet the needs of technology-driven vehicles and the changing expectations of consumers.
What challenges does the Automotive Service Industry face during its growth?
- The automotive industry faces significant uncertainty as a major challenge to its growth. This uncertainty can stem from various sources, including economic instability, regulatory changes, and technological disruptions. However, by staying informed of industry trends and adapting to these challenges, industry professionals can help mitigate their impact and drive growth.
- The automotive industry is currently facing challenges due to the global semiconductor chip shortage and geopolitical tensions. The chip shortage has resulted in production delays for new automobiles, affecting various automotive original equipment manufacturers (OEMs). This situation is expected to persist, potentially impacting the market in the coming years. Additionally, the invasion of Ukraine by Russia has led to increased costs of raw materials used in automobile production, negatively impacting the industry's growth. Despite these challenges, the market continues to evolve, with key trends shaping the industry. These include the increasing adoption of online scheduling and roadside assistance services, the growing importance of shop efficiency, and the rise of performance tuning and preventive maintenance.
- Shop management software, inventory management, and lift equipment are essential tools for maintaining shop efficiency. Moreover, warranty repair, transmission service, spark plug replacement, fuel system repair, and water pump replacement remain essential services for maintaining the performance and longevity of automobiles. Labor rates continue to be a critical factor in shop profitability, making it essential for service advisors to effectively manage their businesses. In conclusion, the market is experiencing both challenges and opportunities. The chip shortage and geopolitical tensions present significant hurdles, but the market's ongoing evolution, including the adoption of technology and changing customer preferences, offers potential for growth.
- Effective waste management, efficient shop operations, and a focus on customer satisfaction are key to success in this dynamic market.
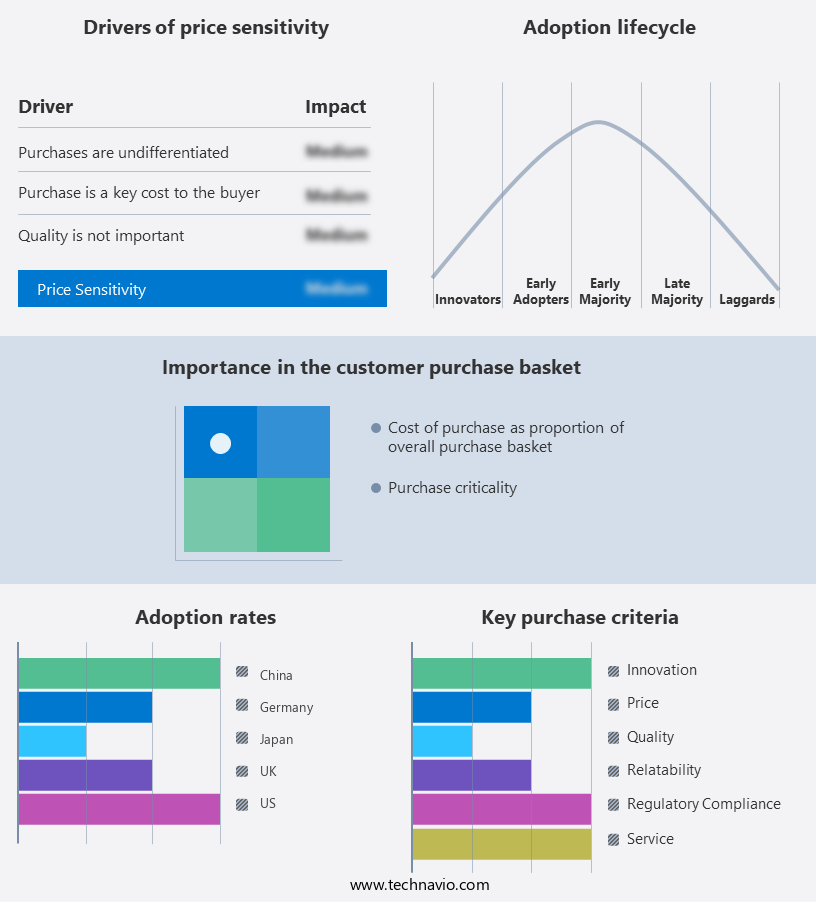
Exclusive Customer Landscape
The automotive service market forecasting report includes the adoption lifecycle of the market, covering from the innovator's stage to the laggard's stage. It focuses on adoption rates in different regions based on penetration. Furthermore, the automotive service market report also includes key purchase criteria and drivers of price sensitivity to help companies evaluate and develop their market growth analysis strategies.
Customer Landscape
Key Companies & Market Insights
Companies are implementing various strategies, such as strategic alliances, automotive service market forecast, partnerships, mergers and acquisitions, geographical expansion, and product/service launches, to enhance their presence in the industry.
Arnold Clark Automobiles Ltd. - This company specializes in providing comprehensive automotive services, encompassing both manufacturer-specific offerings and value-oriented solutions.
The industry research and growth report includes detailed analyses of the competitive landscape of the market and information about key companies, including:
- Arnold Clark Automobiles Ltd.
- Asbury Automotive Group Inc.
- Ashland Automotive Inc.
- Belron International Ltd.
- Bridgestone Corp.
- Carmax Autocare Center
- Driven Brands Holdings Inc.
- EUROPART Group GmbH
- Halfords Group Plc
- Inter Cars S.A
- Jiffy Lube International Inc.
- LKQ Corp.
- M and M Automotive
- MEKO Auto Components Inc.
- Mobivia
- Monro Inc.
- Sumitomo Corp.
- The Goodyear Tire and Rubber Co.
- USA Automotive
- Wrench Inc.
Qualitative and quantitative analysis of companies has been conducted to help clients understand the wider business environment as well as the strengths and weaknesses of key industry players. Data is qualitatively analyzed to categorize companies as pure play, category-focused, industry-focused, and diversified; it is quantitatively analyzed to categorize companies as dominant, leading, strong, tentative, and weak.
Recent Development and News in Automotive Service Market
- In January 2024, Tesla, a leading electric vehicle manufacturer, announced the launch of its new full-service Autopark network. This network aims to provide Tesla owners with convenient, one-stop solutions for vehicle maintenance, repairs, and upgrades. The company plans to expand the Autopark network to 20 locations by the end of 2025 (Tesla Press Release, 2024).
- In March 2024, General Motors (GM) and Microsoft Corporation formed a strategic partnership to develop an integrated, in-vehicle experience. This collaboration focuses on leveraging Microsoft's Azure cloud platform to enhance GM's vehicles with advanced connectivity, personalization, and predictive maintenance features (General Motors Press Release, 2024).
- In May 2024, Bosch, a global technology company, completed the acquisition of Cargotec's automotive service business, known as Car Service International (CSI). This acquisition strengthens Bosch's aftermarket presence and expands its service offerings to include heavy-duty commercial vehicles (Bosch Press Release, 2024).
- In April 2025, the European Union approved new regulations mandating the use of telematics systems in all new passenger cars and light commercial vehicles. These systems will enable real-time monitoring of vehicle performance and diagnostic capabilities, enhancing safety and reducing maintenance costs (European Commission Press Release, 2025).
Research Analyst Overview
- The market is experiencing significant shifts, driven by performance metrics and safety standards. Alternative Fuels, such as electric and hybrid vehicles, are gaining traction, necessitating expansion strategies for service providers. Remote diagnostics and IoT sensors enable proactive maintenance, enhancing customer loyalty programs and retention. Financial performance analysis and profitability are crucial, with dealership partnerships offering opportunities for synergy. Automated repair systems and virtual reality training improve efficiency and accuracy. Supply chain management, lease maintenance, and online reviews management are essential for maintaining a strong market presence.
- Sustainable parts, data analytics, and pricing strategies are key trends in the industry. Regulatory compliance, competitive benchmarking, and specialized training programs ensure business continuity. Digital marketing and social media engagement are vital for attracting new customers and fostering brand loyalty. Insurance claims processing and recycling programs contribute to operational sustainability.
Dive into Technavio's robust research methodology, blending expert interviews, extensive data synthesis, and validated models for unparalleled Automotive Service Market insights. See full methodology.
|
Market Scope |
|
|
Report Coverage |
Details |
|
Page number |
212 |
|
Base year |
2024 |
|
Historic period |
2019-2023 |
|
Forecast period |
2025-2029 |
|
Growth momentum & CAGR |
Accelerate at a CAGR of 8.5% |
|
Market growth 2025-2029 |
USD 457.3 billion |
|
Market structure |
Fragmented |
|
YoY growth 2024-2025(%) |
7.7 |
|
Key countries |
US, Canada, China, UK, Germany, Mexico, Japan, India, France, and South Korea |
|
Competitive landscape |
Leading Companies, Market Positioning of Companies, Competitive Strategies, and Industry Risks |
What are the Key Data Covered in this Automotive Service Market Research and Growth Report?
- CAGR of the Automotive Service industry during the forecast period
- Detailed information on factors that will drive the growth and forecasting between 2025 and 2029
- Precise estimation of the size of the market and its contribution of the industry in focus to the parent market
- Accurate predictions about upcoming growth and trends and changes in consumer behaviour
- Growth of the market across North America, APAC, Europe, South America, and Middle East and Africa
- Thorough analysis of the market's competitive landscape and detailed information about companies
- Comprehensive analysis of factors that will challenge the automotive service market growth of industry companies
We can help! Our analysts can customize this automotive service market research report to meet your requirements.
 RIA -
RIA - 
