
Automotive Multi Wheel Drive Systems Market Size 2024-2028
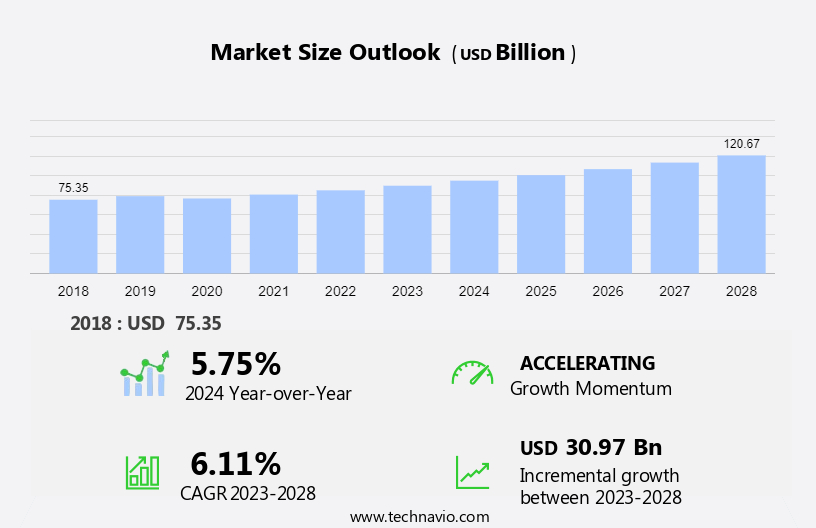
The automotive multi wheel drive systems market size is forecast to increase by USD 30.97 billion, at a CAGR of 6.11% between 2023 and 2028.
- The market is witnessing significant growth due to several key factors. One of the primary drivers is the growing demand for SUVs and pickup trucks, which often come equipped with multi wheel drive systems for enhanced traction and off-road capabilities. Another trend influencing the market is the increasing incorporation of multi wheel drive systems in various vehicle types to improve overall vehicle performance and handling. However, it is important to note that the adoption of these systems comes with an added cost, which may limit their widespread adoption among budget-conscious consumers. Overall, the market for multi wheel drive systems is expected to continue expanding, driven by the need for improved vehicle performance and the rising popularity of SUVs and pickup trucks.
What will be the Size of the Automotive Multi Wheel Drive Systems Market During the Forecast Period?
- The market is experiencing significant growth due to the increasing popularity of SUVs, pickup trucks, and luxury cars with all-wheel drive (AWD) and automatic multi-wheel drive (4WD) systems. Recreational activities such as off-roading events and adventure sports have driven demand for these vehicles, which offer improved driver safety, control, and stability in various terrain and weather conditions. The drivetrain system market, which includes differentials, sensors, and wheels, is a crucial component of these vehicles. Heavy vehicles, including commercial lorries and military vehicles, also utilize multi-wheel drive systems for enhanced torque and fuel efficiency. The market is expected to continue growing due to the affordability and advanced technology of automatic AWD and 4WD systems, making them increasingly accessible to a wider range of consumers.
How is this Automotive Multi Wheel Drive Systems Industry segmented and which is the largest segment?
The automotive multi wheel drive systems industry research report provides comprehensive data (region-wise segment analysis), with forecasts and estimates in "USD billion" for the period 2024-2028, as well as historical data from 2018-2022 for the following segments.
- Type
- Manual
- Automatic
- Vehicle Type
- Passenger car
- Commercial vehicle
- Geography
- APAC
- China
- Japan
- South Korea
- Europe
- Germany
- North America
- US
- South America
- Middle East and Africa
- APAC
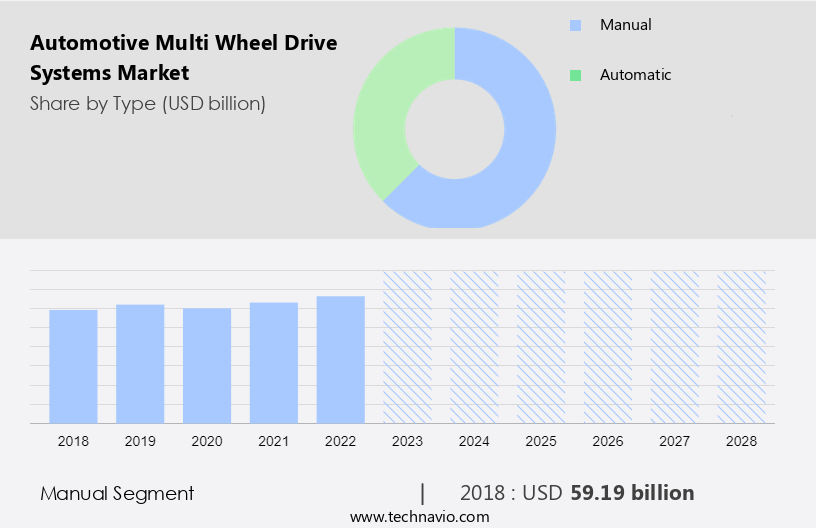
By Type Insights
- The manual segment is estimated to witness significant growth during the forecast period.
Manual automotive multi wheel drive systems enable drivers to manually engage or disengage four-wheel drive functionality in select vehicles, such as off-road vehicles, SUVs, and trucks. These systems utilize a transfer case with gears and mechanisms to switch between two-wheel drive and four-wheel drive modes. The manual control offers enhanced versatility for off-road conditions and is favored by professionals and enthusiasts seeking precise power distribution. Additionally, the growing emphasis on passenger safety contributes to the increasing demand for these systems. The manual automotive multi wheel drive system includes a differential to distribute power evenly to all wheels, ensuring optimal traction and performance.
Get a glance at the Automotive Multi Wheel Drive Systems Industry report of share of various segments Request Free Sample
The manual segment was valued at USD 59.19 billion in 2018 and showed a gradual increase during the forecast period.
Regional Analysis
- APAC is estimated to contribute 44% to the growth of the global market during the forecast period.
Technavio's analysts have elaborately explained the regional trends and drivers that shape the market during the forecast period.

For more insights on the market share of various regions, Request Free Sample
The market for All-Wheel Drive (AWD) systems in automotive applications, particularly in SUVs, has witnessed significant growth due to increasing sales volumes in emerging economies such as China, Malaysia, Indonesia, India, and others. The demand for compact and mid-size SUVs in countries like India, Korea, and China is driving this trend. Improving economic conditions and socioeconomic factors, including the establishment of automotive manufacturing plants and a shift in consumer preferences towards larger, spacious vehicles, are additional growth drivers. AWD systems provide enhanced driver safety and improved vehicle performance on various terrains and weather conditions, making them increasingly popular among consumers. The APAC region is expected to dominate the global AWD market due to these factors.
Market Dynamics
Our automotive multi wheel drive systems market researchers analyzed the data with 2023 as the base year, along with the key drivers, trends, and challenges. A holistic analysis of drivers will help companies refine their marketing strategies to gain a competitive advantage.
What are the key market drivers leading to the rise In the adoption of Automotive Multi Wheel Drive Systems Industry?
Advantages associated with multi wheel drive system is the key driver of the market.
- The market encompasses the production, sales, and installation of all-wheel drive (AWD) and four-wheel drive (4WD) systems in various vehicle types, including SUVs, trucks, commercial lorries, luxury cars, and passenger cars. These systems enhance driving safety and control, particularly during recreational activities such as off-roading events and adventure sports, as well as in adverse terrain and weather conditions. The drivetrain system's primary function is to distribute engine torque to all wheels, ensuring optimal control and stability, especially in heavy vehicles. Sensors play a crucial role in detecting road conditions and automatically engaging the AWD or 4WD system when necessary.
- Advanced technologies like regenerative braking, hybrid powertrains, and electronic control units further improve fuel efficiency and driving dynamics. Consumer preferences for luxury driving experiences, enhanced safety, and improved driving characteristics have led to an increased demand for automatic multi-wheel drive systems. Safety awareness, affordability, and fuel economy norms are essential factors influencing the market's growth. The market caters to various vehicle segments, including light commercial vehicles, heavy commercial vehicles, and sports vehicles. Automobile companies invest in research and development to introduce innovative AWD and 4WD systems that cater to diverse consumer needs and preferences. The market's growth is driven by the increasing demand for improved driving experiences, advanced technologies, and safety concerns.
What are the market trends shaping the Automotive Multi Wheel Drive Systems Industry?
Growing demand for SUVs and pickup trucks is the upcoming market trend.
- The market encompasses the production and supply of wheel drive systems for various vehicle types, including SUVs, trucks, commercial lorries, luxury cars, and passenger cars. These systems, which include All-Wheel Drive (AWD) and Four-Wheel Drive (4WD), provide enhanced control and stability, especially during recreational activities such as off-roading events and adventure sports. AWD systems use sensors to monitor terrain and weather conditions, ensuring optimal driving characteristics for the specific situation. Automakers are integrating advanced technologies like electronic control units, regenerative braking, and hybrid powertrains to improve fuel efficiency and safety. Manual and automatic MWD systems are available for different vehicle classes, from light commercial vehicles to heavy commercial vehicles.
- Safety awareness and affordability are key consumer preferences, leading automobile companies to prioritize safety features and fuel economy norms. The market for multi-wheel drive systems is expanding, with increasing demand for luxury driving experiences and advanced technologies. However, the focus on driving dynamics and passenger safety remains paramount. Sedans, which are increasingly being equipped with multi-wheel drive systems, are witnessing the implementation of electric axles and hybrid powertrains, offering improved control and fuel efficiency.
What challenges does the Automotive Multi Wheel Drive Systems Industry face during its growth?
Incorporation of multi wheel drive system increases overall vehicle cost is a key challenge affecting the industry growth.
- The market encompasses the production and implementation of advanced technologies in vehicles, enabling power distribution to all wheels for improved control and stability. SUVs, trucks, commercial lorries, luxury cars, and other passenger and commercial vehicles utilize these systems to enhance driver safety and optimize performance in various terrain and weather conditions. Components of multi-wheel drive systems include differentials, transfer cases, rear-drive shafts, rear axles, and sophisticated electronics. torque vectoring systems and limited-slip differentials are among the advanced features found in premium and luxury segments, catering to recreational activities such as off-roading events and adventure sports. Consumer preferences for SUVs and crossovers have led to a rise in demand for four-wheel drive systems.
- However, the fuel economy of larger SUVs and their higher pricing have resulted in a shift towards compact SUVs and crossovers. Fuel efficiency, regenerative braking, and hybrid powertrains are essential considerations in the market, driven by increasing income levels, safety awareness, and fuel economy norms. Manual and automatic multi-wheel drive systems cater to various vehicle segments, including passenger cars, light commercial vehicles, and heavy commercial vehicles. Driving dynamics, passenger safety, and driving experience are crucial factors influencing consumer choices. Advanced technologies, such as sensors, electronic control units, and driving characteristics, are essential in ensuring optimal performance and safety.
Exclusive Customer Landscape
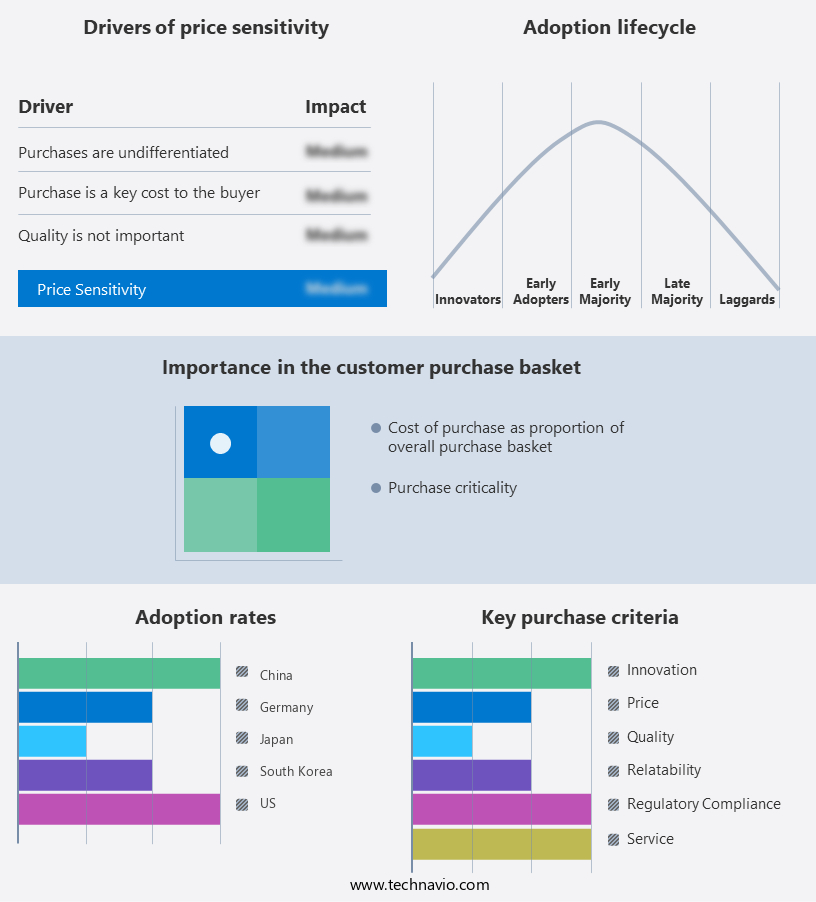
The automotive multi wheel drive systems market forecasting report includes the adoption lifecycle of the market, covering from the innovator's stage to the laggard's stage. It focuses on adoption rates in different regions based on penetration. Furthermore, the automotive multi wheel drive systems market report also includes key purchase criteria and drivers of price sensitivity to help companies evaluate and develop their market growth analysis strategies.
Customer Landscape
Key Companies & Market Insights
Companies are implementing various strategies, such as strategic alliances, automotive multi wheel drive systems market forecast, partnerships, mergers and acquisitions, geographical expansion, and product/service launches, to enhance their presence In the industry.
The industry research and growth report includes detailed analyses of the competitive landscape of the market and information about key companies, including:
- American Axle and Manufacturing Holdings Inc.
- BorgWarner Inc.
- Dana Inc.
- Ford Motor Co.
- GKN Automotive Ltd.
- Honda Motor Co. Ltd.
- Magna International Inc.
- Mitsubishi Motors Corp.
- Porsche Automobil Holding SE
- Renault SAS
- Toyota Motor Corp.
- ZF Friedrichshafen AG
Qualitative and quantitative analysis of companies has been conducted to help clients understand the wider business environment as well as the strengths and weaknesses of key industry players. Data is qualitatively analyzed to categorize companies as pure play, category-focused, industry-focused, and diversified; it is quantitatively analyzed to categorize companies as dominant, leading, strong, tentative, and weak.
Research Analyst Overview
The automotive multi-wheel drive systems market encompasses a diverse range of applications, from recreational activities and off-roading events to commercial lorries and military vehicles. These systems, which include all-wheel drive (AWD), four-wheel drive (4WD), and manual and automatic multi-wheel drive (MWD and AMTWD), offer enhanced control and stability in various terrain and weather conditions. The demand for multi-wheel drive systems is driven by several factors. SUVs and pickup trucks, popular choices for adventure sports and recreational activities, often come equipped with these systems to provide better traction and driving dynamics on rough terrain. Luxury cars and sports vehicles also utilize these systems to improve driving experience and handling.
Driving conditions, such as urbanization and income levels, also influence the market dynamics. In densely populated areas, fuel efficiency and safety awareness are key considerations, making automatic multi-wheel drive systems with regenerative braking and hybrid powertrains increasingly popular. In contrast, heavy commercial vehicles and military applications prioritize heavy-duty performance and affordability. The automotive industry is continuously innovating to meet consumer preferences and regulatory requirements. Advanced technologies, such as sensors and electronic control units, are integrated into multi-wheel drive systems to optimize torque distribution and improve control and stability. Fuel economy norms and safety regulations further push automobile companies to develop more efficient and safe systems.
|
Automotive Multi Wheel Drive Systems Market Scope |
|
|
Report Coverage |
Details |
|
Page number |
155 |
|
Base year |
2023 |
|
Historic period |
2018-2022 |
|
Forecast period |
2024-2028 |
|
Growth momentum & CAGR |
Accelerate at a CAGR of 6.11% |
|
Market growth 2024-2028 |
USD 30.97 billion |
|
Market structure |
Fragmented |
|
YoY growth 2023-2024(%) |
5.75 |
|
Key countries |
US, China, Japan, South Korea, and Germany |
|
Competitive landscape |
Leading Companies, Market Positioning of Companies, Competitive Strategies, and Industry Risks |
What are the Key Data Covered in this Automotive Multi Wheel Drive Systems Market Research and Growth Report?
- CAGR of the Automotive Multi Wheel Drive Systems industry during the forecast period
- Detailed information on factors that will drive the Automotive Multi Wheel Drive Systems Market growth and forecasting between 2024 and 2028
- Precise estimation of the size of the market and its contribution of the industry in focus to the parent market
- Accurate predictions about upcoming growth and trends and changes in consumer behaviour
- Growth of the market across APAC, Europe, North America, South America, and Middle East and Africa
- Thorough analysis of the market's competitive landscape and detailed information about companies
- Comprehensive analysis of factors that will challenge the automotive multi wheel drive systems market growth of industry companies
We can help! Our analysts can customize this automotive multi wheel drive systems market research report to meet your requirements.
 RIA -
RIA - 
